A Novel Adaptive Method for Robotic Wheelchair Navigation Using Brain Signals
脳信号によるロボット車椅子の適応型 ナビゲーションシステムの研究
by
Marsel Mano
B.Sc., Polytechnic University of Tirana, Tirana, Albania, 2004 M.Sc., Beihang University (BUAA), Beijing, China, 2008
A thesis submitted in partial fulfillment of the requirements for the degree of Doctor of Philosophy
Graduate School of Science and Engineering for Education Faculty of Engineering
University of Toyama August 9, 2013 Advisor: Prof. Genci Capi
Copyright © Marsel Mano, 2013
Declaration
I hereby declare that this submission is my own work and that, to the best of my knowledge and belief, it contains no material previously published or written by another person nor material which to a substantial extent has been accepted for the award of any other degree or diploma of the university or other institute of higher learning, except where due acknowledgment has been made in the text.
Name: Marsel Mano Date: 2013/08/09
The Evaluation Committee for Marsel Mano Certifies that this is the approved version of the following dissertation:
A Novel Adaptive Method for Robotic Wheelchair Navigation Using Brain Signals
脳信号によるロボット車椅子の適応型 ナビゲーションシステムの研究
Evaluation Committee:
印 Prof. Genci Capi, Advisor
印 Prof. Iwata Sakagami
印 Prof. Koichi Ogawa
印 Prof. Masato Tajima
印 Prof. Shigenori Kawahara
Acknowledgments
First, I’d like to express my deepest appreciation to my advisor Prof. Genci Capi, for the time he spent consulting and helping me on my ideas. He provided me with the opportunity to work with his research group. His constant support, guidance, enthusiasm and encouragement were invaluable throughout my PhD studies.
I also would like to thank the rest of the members of the evaluation committee: Prof.
Koichi Ogawa, Prof. Iwata Sakagami, Prof. Masato Tajima, and Prof. Shigenori Kawaha- ra for their insightful comments, questions and especially for carefully evaluating my work.
My sincere thanks go to Dr Hideki Toda and Dr Mitsuki Kitani for offering their support during my time at the University of Toyama.
I thank my fellow lab members at the intelligent robotics laboratory of University of Toyama, who volunteered for the BMI experiments. Their help was indispensable in the achievements of my research.
I’d like to express my deepest gratitude to my parents Pandi and Fidella Mano and my sister Etleva for supporting my choices throughout my life, for their dedication, encouragement, advice, and the many years of support. Their unconditional love has been a very strong motivation during all my life.
Most importantly, I’d like to thank my wife Estela whose continued patience and encouragement was what made it all possible. Without her continuous support and comprehension, I’d not have been able to find the drive and willingness to finish my PhD.
Dedication
To my unborn daughter and my wife
Abstract
A brain machine interface (BMI) is a direct communication pathway between the brain and an external device (i.e. robot). The BMI ability to directly communicate with machines and bypass the peripheral nerves and muscles is often used to assist or repair human sensorimotor functions in severely disable or locked-in syndrome affected hu- mans. Therefore, the BMI coupled with the assistive technology is seen as a promising approach to restore mobility in disable people. A very important application in rehabilita- tion technology is the BMI based navigation of robotic wheelchairs. The aim of this application is to restore some mobility independence to paralyzed patients.
Navigating a robotic wheelchair by using only brain signals is a very challenging task. Since only brain signals and no other means can be used to control the wheelchair, the safety requirements are higher than standard wheelchairs. Proximity sensing data are usually used to detect objects and avoid collisions to improve wheelchair navigation safety.
BMI is a low-bit communication channel. This means, the subject has to perform a high amount of mental tasks for a relatively long period of time, even for simple naviga- tion scenarios. This makes the navigation task tiring and long for the BMI subject. Shared control between subject’s mental intentions and intelligent robots is usually proposed as a solution of these problems. Shared control generally improves the navigation experience but also restricts the subject’s control over the robot. Also prior environment training and/or goal location information are required to assist the robot during navigation.
In this thesis, we present a novel adaptive method that improves the navigation of a brain controlled robotic wheelchair. We employ a synchronous brain machine interface to
retrieve mental intentions from the subject at specific points in time. Furthermore, we have developed two modules to assist the robotic wheelchair navigation. The first module is capable of navigating the wheelchair autonomously following assistive information (tactile paving for visually impaired people) on the floor captured by the visual sensor in real time. The second module uses a laser range finder sensor to detect and avoid objects in the navigation path. The adaptive platform integrates the brain signals, the robot sensing and the navigation modules in order to provide the subject with context based navigation choices through acoustic and visual queries.
Based on environment conditions the subject can choose to navigate the robot turn- by-turn or give high-level control commands, and allow the robot to navigate autono- mously following the assistive information. The subject is able to accept or reject the assistance by using only brain signals.
Experimental results show that the proposed adaptive navigation, the robotic wheelchair is able to navigate on a shorter trajectory, avoid potential collisions and reduce the navigation time. The number of mental tasks required is reduced significantly when the assistive information is used. As a consequence of a reduced mental workload the subject is more relaxed and is able to perform better mental tasks, which lead to a higher BMI classification accuracy during adaptive navigation.
Table of Contents
Declaration ... i
Acknowledgments ... iii
Dedication ... v
Abstract ... vii
Table of Contents ... ix
List of Figures ... xiii
List of Tables ... xvii
List of Abbreviations ... xix
1 Introduction ... 1
1.1 Thesis Objectives ... 2
1.2 Overview of Proposed Method and Contributions ... 3
1.3 Thesis Structure ... 4
2 Background ... 7
2.1 Human Brain Anatomy ... 7
2.2 Measuring Neural Activity ... 11
2.2.1 Overview of Brain Activity Measurement Methods ... 12
2.2.2 Invasive BMI Methods ... 12
2.3 Electroencephalography ... 13
2.3.1 Recording EEG ... 14
2.3.1.1 Brain Rhythms ... 16
2.3.1.2 EEG Signal Quality ... 18
2.3.2 Electrophysiological Signals Suitable for BMI ... 19
2.3.3 Sensorimotor Rhythms ... 20
2.3.4 Conclusion ... 21
3 Brain Machine Interface ... 23
3.1 BMI Diagram ... 23
3.2 Definitions ... 25
3.3 BMI Applications ... 26
3.3.1 Communication and Control ... 26
3.3.2 Gaming, Entertainment and Virtual Reality ... 28
3.3.3 Motor Recovery ... 29
3.3.4 Motor Substitution ... 29
3.3.4.1 Grasping ... 29
3.3.4.2 Assistive Mobility ... 30
4 Developed BMI System ... 33
4.1 EEG Signal Acquisition ... 33
4.2 Offline EEG Recording Sessions ... 35
4.3 Signal Processing ... 36
4.3.1 Signal Pre–processing ... 37
4.3.2 Spatial Filtering ... 39
4.3.2.1 Common Spatial Patterns ... 40
4.3.2.2 Spec–CSP Algorithm ... 41
4.3.3 Feature Extraction ... 44
4.3.4 Implementation, Feature Selection and Dimensionality Reduction ... 45
4.4 Classification ... 46
4.4.1 Linear Discriminant Analysis ... 47
4.4.2 Regularized and Multi–Class LDA ... 49
4.5 Online Predictive Module ... 50
5 Robotic Wheelchair and Navigation Modules ... 53
5.1 Robotic Wheelchair ... 53
5.1.1 Laser Range Finder Sensor ... 54
5.2 Navigation Assistive Modules ... 56
5.2.1 Direct Control Module ... 56
5.2.2 Collision Detection Module ... 56
5.2.3 Autonomous Navigation Module ... 60
5.3 Adaptive Navigation Platform ... 62
5.3.1 Control Mode Transitions and Finite State Machine ... 65
5.4 Environment and Experimental Setup ... 68
6 Results ... 71
6.1 Offline BMI Results ... 71
6.1.1 Preprocessing ... 72
6.1.2 Filtering Model ... 74
6.2 Online BMI results ... 77
6.3 Robot Navigation Results ... 78
6.3.1 Collision Detection and Avoidance Performance ... 78
6.3.2 Autonomous Navigation Performance ... 79
6.3.3 Adaptive Robotic Navigation Results ... 80
7 Conclusions ... 85
Appendices ... 87
A Brain Activity Measurement Techniques ... 88
B Other Electrophysiological Signals Used in BMI ... 89
B.1 Slow Cortical Potentials ... 89
B.2 Common Evoked Potentials Used in BMI Systems ... 89
B.2.1 Visual Evoked Potentials ... 89
B.2.2 Event Related Potentials ... 90
C BMI Classifiers ... 92
C.1 Classifiers Used in BMI ... 92
C.2 Classifier Combination ... 93
D Offline BMI Method Evaluation ... 96
D.1 Datasets ... 96
D.1.1 BCI Competition iii & iv Datasets ... 96
D.1.2 BCILAB Datasets... 97
D.1.3 Intelligent Robotics Laboratory Datasets ... 97
D.2 Results of LTI Filtering ... 98
D.3 Classification Results ... 99
Bibliography ... 103
List of Figures
Figure 2-1 Brain sagittal section (adopted from Wikimedia) ··· 8
Figure 2-2 Brain cognitive functions location map (adopted from AlianaHealth) ··· 10
Figure 2-3 Primary motor cortex function mapping (adopted from StudyBlue) ··· 11
Figure 2-4 Structure of a neuron (adopted from (Sanei and Chambers 2007)) ··· 14
Figure 2-5 Multi–electrode EEG recordings (adopted from Wikipedia) ··· 14
Figure 2-6 International 10–20 electrode placement system ··· 17
Figure 2-7 Brain rhythms (adopted from Wikipedia) ··· 17
Figure 2-8 Event Related De–synchronization and Event Related Synchronization (ERD/ERS) (adopted from (Lemm, Müller, and Curio 2009)) ··· 21
Figure 3-1 Generic diagram of a BMI system ··· 24
Figure 3-2 The text entry system ‘Hex–O–spell’ interface (adopted from (Blankertz, Dornhege, Krauledat, Schroder, et al. 2006)) ··· 27
Figure 3-3 BMI navigation in a virtual street (adopted from (Leeb, Friedman, Slater, et al. 2007)) ··· 28
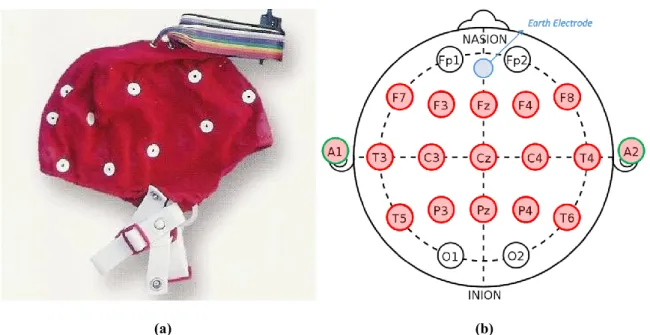
Figure 4-1 (a) the electrode cap, and (b) the electrode placements positions ··· 34
Figure 4-2 Electrode box (adopted from Mitsar Co., Ltd website) ··· 34
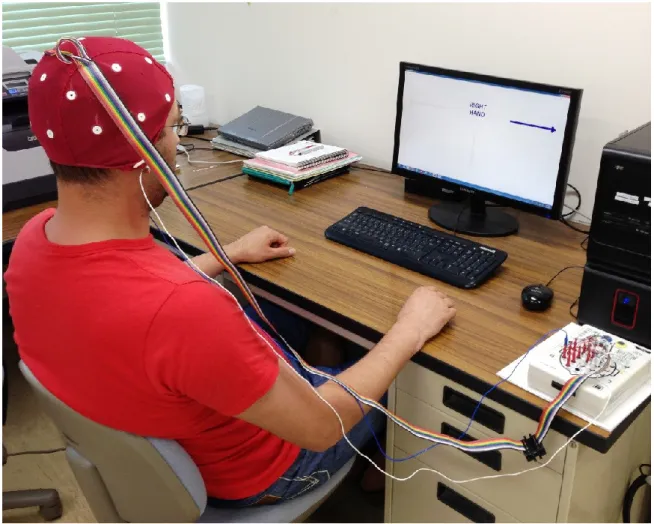
Figure 4-3 BMI subject during offline data recording session ··· 35
Figure 4-4 Trial structure ··· 36
Figure 4-5 Offline training cues: (a) Left hand (b) Right hand (c) Foot (d) Relax and (e) Start ··· 36
Figure 4-6 Epoch extraction interval ··· 37
Figure 4-7 Best class projection ··· 48
Figure 4-8 Online Predictive Module flow chart ··· 51
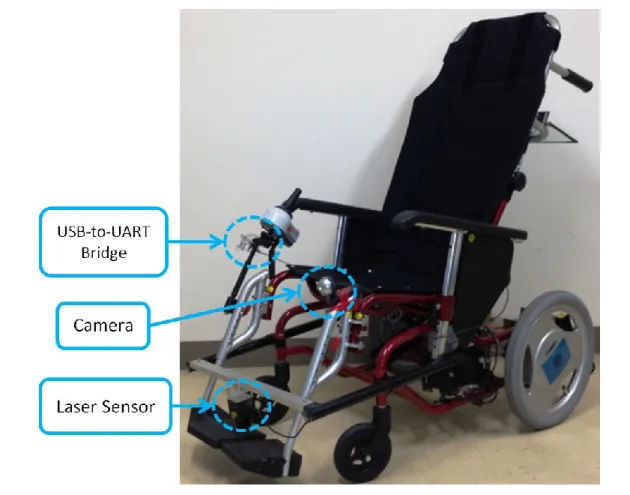
Figure 5-1 Robotic Wheelchair··· 54
Figure 5-2 Servo motor wheel system components (adopted from Yamaha Motor website) ··· 54
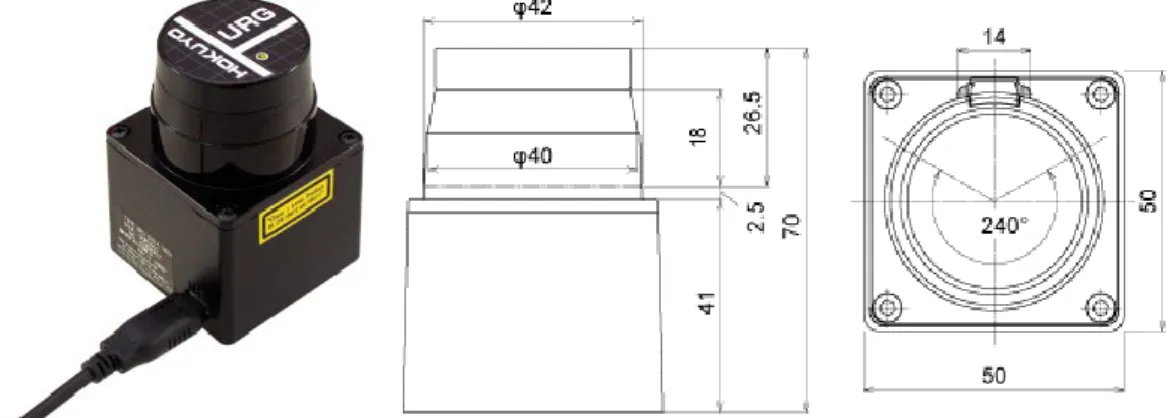
Figure 5-3 The “URG-04LX-UG01” model LRF sensor; all the values in the drawings are in mm (adopted from Hokuyo Automatic website) ··· 55
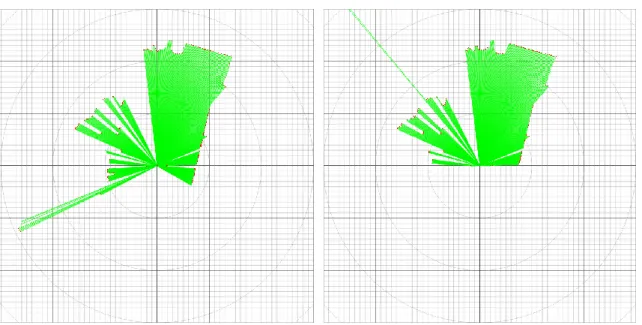
Figure 5-4 Sensor reading snapshots (a) before and (b) after area restriction to ··· 58
Figure 5-5 Sensor measuring subareas: left ( ), forward ( ) and right ( ) subarea ··· 58
Figure 5-6 Web camera used on our system··· 60
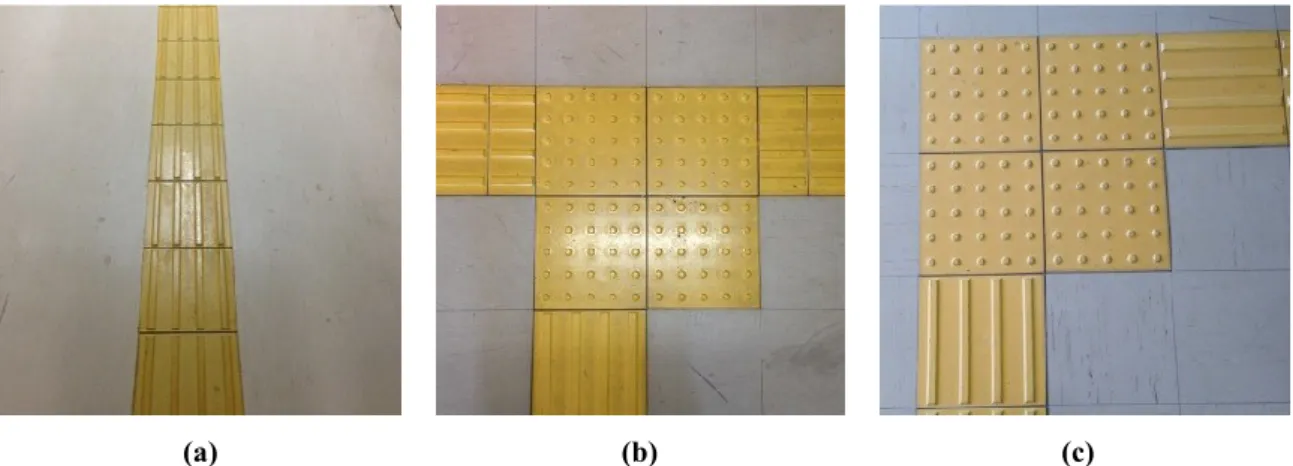
Figure 5-7 Assistive information: (a) line (b) decision point with 3 lines (c) decision point with 2 lines ··· 60
Figure 5-8 Processed image frame representation ··· 61
Figure 5-9 Block diagram of the BMI-based robotic wheelchair control system using ANP ··· 63
Figure 5-10 (a) Activate ANM popup GUI, (b) Change Navigation Mode popup GUI, and (c) Main GUI of the system ··· 65
Figure 5-11 FSM diagram ··· 67
Figure 5-12 FSM diagram during unassisted control mode ··· 68
Figure 5-13 Experimental environment ··· 69
Figure 6-1 Raw 15 channel EEG signal recordings during an offline trial ··· 71
Figure 6-2 Single trial power spectrum ··· 72
Figure 6-3 Mean log power spectrum of a continuous 15 channel EEG dataset: (a) without LTI filtering, and (b) with LTI filtering ··· 73
Figure 6-4 The C3 and C4 Electrode (channel) signal averaged over trials, after preprocessing in the time interval [0.5, 1.5] seconds after the cue during: (a) Left Hand tasks and (b) Right Hand tasks ··· 74
Figure 6-5 Scalp topographic maps of the spatial patterns for the three biggest & smallest eigenvalues of the MI pair: (a) Left Hand v. Right Hand, (b) Left Hand v. Foot and (c) Right Hand v. Foot ··· 75
Figure 6-6 Frequency filters corresponding to the three biggest & smallest eigenvalues of the MI pair: (a) Left Hand v. Right Hand, (b) Left Hand v. Foot and (c) Right Hand v. Foot ··· 76
Figure 6-7 BMI classification accuracy distribution over experimental sessions ··· 77
Figure 6-8 Collision detection results over experimental sessions ··· 79
Figure 6-9 Collision avoidance results over experimental sessions ··· 79
Figure 6-10 Assistive information extraction from the real-time image processing algorithm of a line (captured image in (a) and its result in (b)) and a decision point (captured image in (c) and its result in (d)) ··· 80
Figure 6-11 Mental task results over experimental sessions ··· 81
Figure 6-12 Trial time results over experimental sessions ··· 81
Figure 6-13 Robot navigation metric improvement during assisted navigation ··· 82
Figure 6-14 A navigation trial conducted in (a) assisted mode (b) unassisted mode ··· 83
Figure A-1 ERP component’s approximate positions relative to the event or stimulus ··· 91
Figure A-2 An EEG waveform showing typical ERP components (adopted from Wikipedia) ··· 91
Figure A-3 Electrode placement labels/positions ··· 98
Figure A-4 Single channel mean activity log power spectrum of subset OFC4: a) left hand MI trials, and b) right hand MI trials ··· 99
List of Tables
Table 4-1 Mitsar-EEG 201 technical specifications (adopted from Mitsar Co., Ltd website) ... 34
Table 4-2 Filtering Model ... 46
Table 4-3 Statistical definitions ... 48
Table 4-4 Classification Model ... 50
Table 5-1 The “URG-04LX-UG01” model LRF sensor technical specifications (adopted from Hokuyo Automatic website) ... 55
Table 5-2 OPM output translations into real time robot direction change in assisted and unassisted control modes ... 64
Table 6-1 The mean and the standard deviation of the BMI misclassifications and the BMI accuracy during each experimental session ... 77
Table 6-2 CDM Performance ... 78
Table 6-3 Navigation Metrics ... 81
Table A-1 Brain Activity measuring methods and their main distinctive features... 88
Table A-2 ERP component properties ... 91
Table A-3 Properties of classifiers used in BMI research (adopted from (Lotte et al. 2007)) ... 94
Table A-4 Classification accuracies (mean and standard deviation) obtained for each dataset for the standard CSP and Spec–CSP, with and without filtering ... 100
Table A-5 Classification accuracies (mean and standard deviation) obtained for each dataset collected in the intelligent robotics lab, for the standard CSP and Spec–CSP, with and without filtering ... 101
Table A-6 Classification accuracies (mean, standard deviation and train loss) of the online feedback experiments ... 102
List of Abbreviations
ANM: Autonomous Navigation Module ... 4
ANN: Artificial Neural Networks ... 92
ANP: Adaptive Navigation Platform ... 4
BMI: Brain Machine Interface ... 1
CDM: Collision Detection Module ... 4
CSP: Common Spatial Patterns ... 38
DCM: Direct Control Module ... 3
ECoG: Electrocorticography ... 12
EEG: Electroencephalography ... 1
EP: Evoked Potential ... 19
ERD: Event Related De-synchronization ... 20
ERP: Event Related Potential ... 19
ERS: Event Related Synchronization ... 20
FES: Functional Electrical Stimulation ... 29
fMRI: Functional Magnetic Resonance Imaging ... 12
FSM: Finite State Machine ... 66
GUI: Graphical User Interface ... 64
LRF: Laser Range Finder... 4
LTI: Linear Time Invariant ... 3
MEG: Magnetoencephalography ... 12
MI: Motor Imagery ... 2
MLP: Multi–Layer Perceptron ... 92
NIRS: Near Infrared Spectroscopy ... 12
OPM: Online Predictive Module ... 3 PET: Positron Emission Topography... 12 RLDA: Regularized Linear Discriminant Analysis ... 3 SCP: Slow Cortical Potentials ... 20 SNR: Signal-to-Noise Ratio ... 36 Spec–CSP: Spectrally Weighted Common Spatial Patterns ... 38 SSVEP: Steady-State Visual Evoked Potentials ... 89 SVM: Support Vector Machine ... 46 TTD: Thought Translation Device... 27 UART: Universal Asynchronous Receiver/Transmitter ... 53 USB: Universal Serial Bus... 33 VEP: Visually Evoked Potentials ... 89
1. Introduction MARSEL MANO, 2013
1 Introduction
Brain Machine Interfaces (BMI) are often directed at assisting, augmenting, or repairing human cognitive or sensorimotor functions (Wolpaw et al. 2000). BMI systems enable humans to send commands to an external device (generally a computer or robot), by using only brain signals recorded while performing voluntary mental activity (Wolpaw et al. 2002; Birbaumer 2006). BMI is thought to be particularly useful in restoring com- munication to locked–in syndrome affected patients (Kübler et al. 2001) or restore mobility to paralyzed patients (Pfurtscheller et al. 2003).
Commonly, electroencephalography (EEG) is used to record the brain activity. The first experiments of recording EEG on humans date back in 1929 and they were carried out by researcher Hans Berger (Berger 1929).
EEG measures micro currents generated by brain activity on scalp. By decoding EEG signals, we can understand the brain activity to a certain degree. The first attempt to create an EEG based BMI dates back in 1973 (Vidal 1973).
Despite some early attempts (Farwell and Donchin 1988), it is only in the last two decades that BMI research has gained significant popularity, involving a lot of research which is at present being conducted in an increasing number of laboratories around the word. Together with the BMI applications, the methods and technologies used for meas- uring the brain activity have increased and become more sophisticated. BMI designs and applications have particularly shown promising results in the medical domain (Rebsamen et al. 2007; Shih, Krusienski, and Wolpaw 2012), but also in other areas (Nijholt, Bos, and Reuderink 2009; Blankertz et al. 2010). Unfortunately, most of the results acquired in research laboratories seem to have had small or no impact on commercial and real life applications yet.
1. Introduction MARSEL MANO, 2013
1.1 Thesis Objectives
The work presented in this thesis belongs to the research and development of BMI controlled robots. More precisely, it focuses on the study of BMI controlled robotic wheelchair applications for disable people. Despite some valuable and promising achievements already obtained in the literature, the field of brain controlled robotic wheelchair applications remains a relatively new research field and there is still a long way to go until the final goal of making these wheelchairs available to disable patients for everyday use is reached. Up to now, all the results and applications are limited to research laboratories experimenting in simulated and/or virtual environments and also some indoor experimental environments. Real life applications are still far in the horizon.
The research on intelligent robotics is focused on building assistive modules for shared navigation. The BMI community has emphasized the need for shared (collabora- tive) navigation and intelligent wheelchairs in order to compensate the BMI imperfections (Carlson and del R. Millan 2013; Millan et al. 2010; Carlson, Leeb, Chavarriaga, et al.
2012; Leeb and Millan 2013; Lopes, Pires, and Nunes 2013).
In this thesis, we propose a novel adaptive method for the task of navigating a robotic wheelchair by using brain signals collected and decoded through BMI system based on the motor imagery (MI) mental activity (Section 2.3.3) measured by EEG.
Among the numerous possible improvements, we are going to address the following topics:
1- Improve BMI classification by applying de–noise filtering to the EEG brain signals 2- Reduce the mental workload of the BMI subject by offering autonomous navigation 3- Improving robot navigation by introducing real time adaptive navigation assistance The above topics are widely discussed and addressed as being important and necessary research topics for the improvement of BMI technology in general and BMI based wheelchair navigation technology in particular (McFarland et al. 2006; Kübler 2006;
Wolpaw et al. 2002; Allison, Wolpaw, and Wolpaw 2007; Millan et al. 2010; Shih, Krusienski, and Wolpaw 2012; Green and Kalaska 2011; Cabrera, Farina, and Dremstrup 2010; Leeb and Millan 2013; Carlson and del R. Millan 2013).
In the next section we are going to introduce the main methods and the contribu- tions of this thesis with regard to the three topics shown above.
1. Introduction MARSEL MANO, 2013
1.2 Overview of Proposed Method and Contributions
In order to address the topics raised in the previous section, we conducted an in- depth review and investigation process of different BMI approaches; then, we decided to select the MI generated electrophysiological process for the EEG signal based BMI system in our experiments. The selected BMI system allows the subject to voluntarily control the mental activity (voluntary MI tasks) in order to achieve brain machine com- munication. Furthermore, previous research on MI based BMI has already shown to achieve sustainable communication capabilities (Mason et al. 2007).
In order to improve BMI communication, it is very important to have a high brain signal classification rate. EEG signals are very noisy, which makes the classification task challenging (Section 2.3.1.2). In order to remove noise from EEG signals, we propose a linear time invariant (LTI) filtering during the signal pre–processing step, and then we apply spatial and temporal filters (Section 4.3). These filters enable emphasize important discriminatory features of the pre–processed EEG signals, while reducing irrelevant ones.
Linear classifiers are very fast and robust for real time applications. In our imple- mentation, we propose a regularized linear discriminant analysis (RLDA) classifier (Section 4.4.2) which is trained with the data acquired during offline recording sessions.
The performance of the above filtering and classification methods are tested with offline datasets from 36 subjects and the results are shown in Appendix D.
Prior to the robot real time navigation sessions, we conducted an offline data recording session. Typical offline sessions involve the subject staring at the screen, and repeatedly perform MI tasks according to the cues presented on screen. In order to minimize the subject’s fatigue and mental workload, we reduce the duration of the offline session to approximately 15 minutes. Based on the offline recording we built a feature extraction model (Section 4.3.4) and a classification model (Section 4.4.2) and we inte- grated both in the online predictive model (OPM). The OPM (Section 4.5) was used to retrieve, pre–process, filter, classify and send the subject’s mental intentions to the robot in real time during navigation. The OPM is very fast and offers high classification accu- racy.
To reduce the subject’s mental workload and improve the real time robot naviga- tion, we have developed assistive modules for direct navigation, autonomous navigation and collision detection (Section 5.2). The direct control module (DCM) is capable to
1. Introduction MARSEL MANO, 2013
navigate the robot turn–by–turn. The collision detection module (CDM) uses laser range finder (LRF) sensor data to detect and avoid potential collisions. The autonomous naviga- tion module (ANM) uses a camera to capture assistive information on the floor and navigates the robot autonomously.
The above navigation modules are integrated with the OPM by using an adaptive navigation platform (ANP). The proposed ANP (Section 5.3) adaptively assists the subject during navigation by offering autonomous navigation or direct control navigation, based on the environment context.
In order to evaluate the impact of our method in the robot navigation performance, the experiments were conducted in a comparative manner. During each session, the experimental trials were conducted in assisted and unassisted navigation mode. In assisted mode, the ANP was able to offer collision detection (and avoidance) and autonomous navigation assistance to the subject. The subject was able to accept or reject it by using brain signals. In unassisted mode the ANP was only able to offer collision detection and avoidance assistance.
Experimental results show that when robot navigates in assisted mode using full assistance from ANP, the number of mental tasks per trial, the trial navigation time and the maximal number of collisions detected in a trial, are reduced significantly (Section 6.3). This indicates that the assistance from ANP improves the navigation capabilities of the wheelchair and facilitates the usage of BMI controlled wheelchairs.
The proposed adaptive method not only improves navigation, but also it improves the overall real time BMI classification. By allowing the subject to relax during autono- mous navigation, he is able to perform better mental tasks and with greater focus. This improves the BMI classification.
1.3 Thesis Structure
The rest of this thesis is organized into 6 chapters and four appendices. The content of each chapter and the appendices are shown below:
Chapter 2 contains a general background of the human brain anatomical construction and functionality. Then it offers a background of the methods that are used to measure the electromagnetic signals generated from brain activity. The major part of this chap-
1. Introduction MARSEL MANO, 2013
ter is used to explain the EEG signal measurement methods and the electro- psychological signals that are most suitable for BMI systems. This includes observa- tions about the EEG signal quality and the brain rhythms that are present in EEG signals. Special attention is paid to the sensorimotor rhythms of the brain, more pre- cisely to MI activity generated rhythms, since these are the rhythms that are used by the BMI system in our experiments.
Chapter 3 reviews the BMI applications. It starts with an introduction of the most important definitions of BMI systems. Then it continues with a review of the BMI application areas, their importance and it introduces some famous BMI applications.
A significant part of this chapter is used to introduce the development status of the BMI robotic wheelchair applications for disable people.
Chapter 4 describes in detail the theory and the algorithms that we have used to build our BMI system. It contains a detailed description of the data acquisition hardware and software. Furthermore, it details the offline recording procedure and the offline EEG signal processing including, offline session description, signal pre–processing, spatio–temporal filter construction, feature selection criteria, linear classifier training and it finishes with the OPM, which is used to generate the robot control commands during online robot navigation.
Chapter 5 describes in detail the hardware and the software components of the robot- ic wheelchair that we have built in our lab and used for the experiments. It contains a detailed description of the sensing and actuating equipment of the robot including the LRF sensor, the web camera, AC servomotors, etc. Furthermore, all software modules that we have developed for assisting robot navigation, the ANP that integrates these modules with the BMI system and the functionality of the BMI controlled robotic wheelchair system as a whole, are described in this chapter. The experimental envi- ronment and the experimental protocol for the real time navigation are shown in the last section.
Chapter 6 shows the results of our experiments. It is divided in three parts, the offline BMI, the online BMI and the robot navigation results. Section 6.1 shows the results of the offline EEG signals: the pre–processing, filtering and the OPM construction. The results of BMI classification during real time robot navigation sessions are shown in Section 6.2. Section 6.3 shows the performance of different assistive modules and the
1. Introduction MARSEL MANO, 2013
overall performance of the ANP during real time robotic wheelchair navigation exper- iments.
Chapter 7 concludes the thesis. It emphasizes the main contributions of this thesis by explaining the advantages of our method in comparison to previous works in the field of BMI controlled robotic wheelchairs.
The last part of the thesis contains four appendices. Appendix A summarizes the features and properties of most popular brain activity measurement techniques. Appendix B introduces the electrophysiological signals used to establish BMI communication. Ap- pendix C gives a review of the classification methods used in BMI systems. Last, appendix D shows the classification results obtained by applying our BMI system offline in datasets obtained in our lab and also datasets downloaded from public domains of the BMI community.
2. Background MARSEL MANO, 2013
2 Background
This chapter gives background information about the human brain anatomy, fol- lowed by an overview of some popular brain activity measurement methods. Emphasis will be put on electroencephalography (EEG) since this is the most widely used method for non–invasive BMI applications and it is the method used in the work presented in this thesis. Further, electrophysiological signals used in BMI will be described with a primary focus on the sensorimotor rhythms.
2.1 Human Brain Anatomy
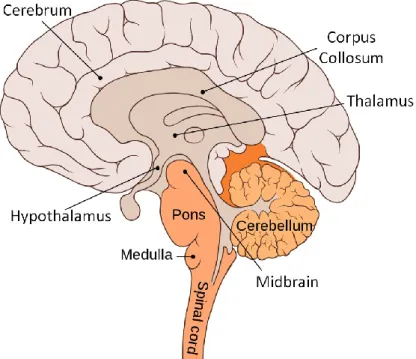
The human central nervous system is made of the brain and the spinal cord which is the continuation of the brain. The brain is the most complex organ of the human body. An adult brain is made of more than 1011 highly compressed and interconnected (through approximately 5x10¹⁴ synapses) neurons into a very complex compound of mass (Sanei and Chambers 2007). Although single neuron functions are fully understood, the vast amount of neurons, and the dynamic inter–neural connections make it quite impossible to fully understand the right workflow principles of the brain and how certain information is processed dynamically involving different brain parts.
For more than two centuries, neuroscientists have used the spatial approach, which maps the brain into functionally distinct parts. This is mainly based on the principle that neurons serving a similar function are likely to be interconnected with each other, thus be in the same region of the brain.
The brain has a symmetric, bilateral structure with three main regions, the fore brain, the mid brain and the hind brain; and it is connected to the spinal cord through the
2. Background MARSEL MANO, 2013
hind brain. Each brain region shown above has different parts (Figure 2-1) that are responsible for specific functions.
Spinal Cord – is partly responsible for controlling limb movement and the trunk. Fur- thermore, it processes sensory information from the skin, joints and their associated muscles.
Hind Brain consists of medulla oblongata, pons and cerebellum.
Medulla Oblongata – is an extension of the spinal cord into the brain. It contains tracts from and to higher portions of the brain, and also is responsible for vital functions like respiration and heart rate. The upper part of the medulla (reticular formation) is the regulatory system for sleep, waking, and alertness.
Pons (“bridge” in Latin) serves as a connection pathway between: a) the lower cerebellum and spinal cord and b) the higher parts of the brain like the cerebrum and mid brain. It is responsible for providing movement information originating from the cerebral hemispheres to the cerebellum.
Cerebellum ("little brain" in Latin), is shaped like a small brain, and it is primari- ly responsible for coordinating involuntary movement, walking balance, etc. It is also responsible for precision and fine control of the voluntary movements. It is believed that, when you learn complex motor tasks, the details are stored in the cerebellum.
Figure 2-1 Brain sagittal section (adopted from Wikimedia)
2. Background MARSEL MANO, 2013
Midbrain is the smallest part of the human brain and connects the hindbrain to the forebrain. It contains important pathways for hearing and vision; furthermore, it is in- volved in processing and controlling a variety of sensory and motor functions (e.g.
eye movements), and coordinates auditory and visual reflexes.
Fore Brain consists of the diencephalon (hypothalamus and thalamus) and cerebrum.
Thalamus is responsible for processing sensory and motor information and then relays it to the corresponding part of the cortex.
Hypothalamus is responsible for the taste and smell, it controls the heart rate, blood pressure, body temperature, etc. It also controls mood and emotions.
Cerebrum is the largest and the most developed part of the brain. It is made of two symmetrical cerebral hemispheres connected by the corpus callosum. The surface of the cerebrum is called the cortex and consists of layers of neuron cells.
It appears grey in color; hence it is usually called the “grey matter”. The inner part is called the medulla and it consists of trillions of neuron connection fibers. It is white in color; hence it is called the “white matter”. The cortex is highly convo- luted to increase its surface area. It is believed that higher convolutions lead to higher intelligence. Cerebrum is responsible for the intelligence, personality, thinking, memory, consciousness, will power, producing and understanding lan- guage, interpretation of sensory impulses, motor functions, planning etc.
Supposedly, all cognitive functions are processed through the electrical activity of the neuron cells located in the structures of the cortex layer of the brain. Specific cortex areas are responsible for sensory, motor or intellectual processing. Brain mapping is used to associate different brain functions with different areas. This mapping is done by associat- ing similar function classes in a large area and then specific sub–class of functions into smaller subareas. Theoretically, this mapping can go up till single neuron function level.
Practically, it is impossible to associate every specific neuron cell with a brain function;
instead, neural populations are mapped as responsible for specific brain activity.
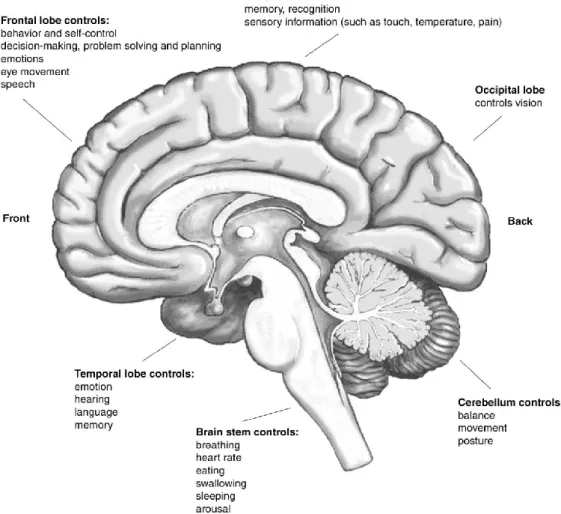
The cortex has sensory areas, association areas and motor areas. The sensory areas receive the messages from the sensing organs, the association areas associate this information with other sensory information and the motor areas are responsible of the control of the voluntary muscles. The cortex has four distinct lobes: frontal, parietal, temporal and occipital (Figure 2-2).
2. Background MARSEL MANO, 2013
Frontal Lobes are located at the front of each hemisphere, anterior to the neighboring parietal lobe and above the temporal lobe. Some of their most distinctive functions are associated with behavior, planning, motivation, long–term memory and attention.
Here are located the areas responsible for motor functions (Figure 2-3).
Parietal Lobes function is primarily associated with multimodal sensory information integration especially for navigation and object manipulation. The most distinctive function is to visually map in space and time a perceived object’s position, relative to the body. Specific parts of the parietal lobes are associated with language processing functions.
Temporal Lobes are located on both sides of the brain mainly associated with audito- ry processing, language processing and some visual processing. In this region of the cortex is also located the hippocampus which plays an essential role in converting short–term memory into long–term memory.
Figure 2-2 Brain cognitive functions location map (adopted from AlianaHealth)
2. Background MARSEL MANO, 2013
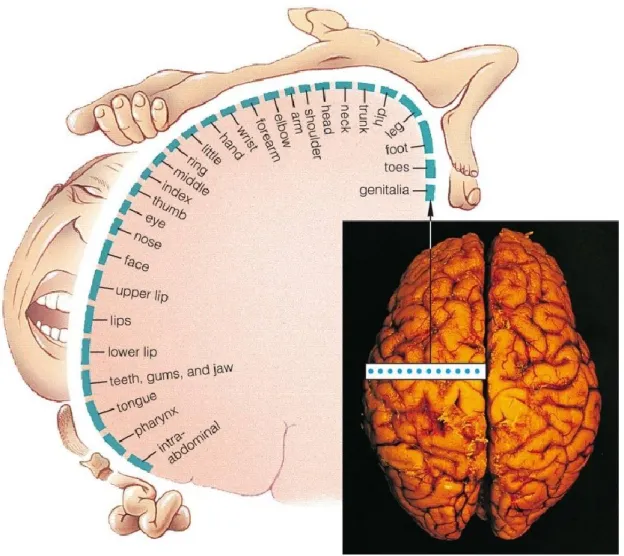
Figure 2-3 Primary motor cortex function mapping (adopted from StudyBlue)
Occipital Lobes are located at the back of the head. Their function is almost exclu- sively associated to visual processing; including sub–areas specialized for color or edge direction detection. The back of the lobes are arranged in such a way as to reflect the retinal field as a spatial map.
The motor cortex is subdivided into distinct areas associated with different body parts (Figure 2-3). In this thesis, we will mainly focus on the brain activity of the motor cortex and the signals generated from this area of the brain, more precisely to the signals corre- sponding to the control of limbs.
2.2 Measuring Neural Activity
BMIs operate based on the subject’s measured brain activity. In this section, we will describe different available methods for measuring brain activity. Then we will identify the brain signals that are commonly used to drive the BMI.
2. Background MARSEL MANO, 2013
2.2.1 Overview of Brain Activity Measurement Methods
Researchers have identified around a dozen different kinds of brain signals as suitable for a BMI (Wolpaw et al. 2002). Based on the signal and the targeted brain activity different measurement methods are used (Wolpaw et al. 2006). These methods are divided into three categories:
1- Non–invasive methods, which include methods that measure the magnetic field changes, the Magnetoencephalography (MEG) (Bianchi et al. 2010; Mellinger et al.
2007; Besserve et al. 2007; Pfurtscheller and Lopes da Silva 1999) or the electrical field changes, the EEG.
2- Other non–invasive methods that measure metabolic processes of the brain like Functional Magnetic Resonance Imaging (fMRI) (Weiskopf et al. 2004; Minati et al.
2012), Near Infrared Spectroscopy (NIRS) (S. M. Coyle, Ward, and Markham 2007;
Sagara, Kido, and Ozawa 2009), or Positron Emission Topography (PET) (Bernhard Graimann, Pfurtscheller, and Allison 2010).
3- Invasive methods like Electrocorticography (ECoG) or implanted electrodes placed inside the cortex (Leuthardt et al. 2011; Krusienski and Shih 2011; Chapin et al. 1999;
Velliste et al. 2008; Mano et al. 2013).
The most popular non–invasive measurement method used in BMI applications is EEG (Wolpaw et al. 2006). More details about other techniques used for brain activity meas- urement are shown in Appendix A.
Recently, EEG devices have become more affordable (although still expensive for personal use), more portable and provide a relatively good signal resolution. Furthermore, EEG based measurement methods are entirely non–invasive and easier to set up, com- pared to invasive and other complicated non–invasive methods. Consequently, most of current BMI systems are using EEG to measure brain activity. In this thesis, we have focused our work on EEG–based BMI.
2.2.2 Invasive BMI Methods
Invasive BMI is very promising and rapidly growing research field. Invasive BMI uses signals acquired from electrodes (sensors) implanted inside specific parts of the brain, to measure targeted neural populations’ activity (Lebedev and Nicolelis 2006;
2. Background MARSEL MANO, 2013
Friehs et al. 2004; Hochberg et al. 2006; Nicolelis 2001; Schwartz et al. 2006). Obvious- ly, it is by far less popular than EEG for the very difficulties and risks that the surgery for implanting the electrodes carries. Most of invasive BMI system applications are designed and evaluated in primates (Lebedev and Nicolelis 2006; Nicolelis 2001; Velliste et al.
2008) or rats (Chapin et al. 1999; Mano et al. 2013). However, examples of invasive BMI in humans exist and have shown some promising results (Yanagisawa et al. 2012;
Collinger et al. 2013).
When it comes to signal quality, invasive BMI offers the best spatial resolution and signal quality. The recording electrodes are implanted in the target neural area (e.g. motor cortex) and acquire better signal compared to the cluttered, multi–sourced and noisy EEG signal recorded on scalp. For instance, electrodes implanted into the motor cortex area, which is responsible for left hand movement, will record a much higher neural activity when a left hand movement occurs opposed to a right hand movement. The signal meas- ured with EEG electrodes on the scalp is very noisy, comes from multiple approximately same distance neural sources and it is attenuated from the scull.
Nevertheless, the signal quality in invasive BMI comes with a high price. The use of implanted electrodes might be dangerous for the health of the subjects. Implanting electrodes requires neurosurgical operation. Furthermore, electrodes have a limited lifetime, which requires regular surgery operations for electrode replacements. Moreover, the body may resist the electrodes, which makes the whole risky procedure go in vain.
2.3 Electroencephalography
An EEG signal is the measurement of currents that flow during synaptic excitations of the dendrites of many pyramidal neurons in the cerebral cortex. When brain cells (neurons) are activated, the synaptic currents are produced within the dendrites (Figure 2-4). This current generates a magnetic field measurable by electromyogram measuring devices and a secondary electrical field over the scalp measurable by EEG measuring devices (Sanei and Chambers 2007).
A typical multi–electrode EEG recording is shown on Figure 2-5. EEG measure- ments have been conducted on human subjects for almost a century since the first recordings in 1924 by Hans Berger. It is at that time that he named it “electroencephalo- gram”. Anyway, in the last 20 years there has been a rapid increase of EEG usage.
2. Background MARSEL MANO, 2013
Figure 2-4 Structure of a neuron (adopted from (Sanei and Chambers 2007))
Figure 2-5 Multi–electrode EEG recordings (adopted from Wikipedia)
2.3.1 Recording EEG
EEG signals are measured by using specific EEG electrodes placed on the scalp of a human subject. The number of recording electrodes varies from few to about 256. Usual- ly, these electrodes come pre–mounted on elastic caps.
To improve conductivity (i.e. reduce electrode impedance), which leads to the acquisition of better signal resolution, the contact between the electrodes and the skin is generally enhanced by using ethanol, conductive gel or paste (Sanei and Chambers 2007).
As a general rule, the best signal is acquired when impedance is below . In order to achieve good performance, each electrode’s impedance needs to be carefully checked and
2. Background MARSEL MANO, 2013
the gel needs to be applied thoroughly. This makes the electrode montage procedure generally tedious and lengthy. Furthermore, electrodes need to be placed as close to the scalp as possible which may lead to headache caused by pressure. Recently, dry elec- trodes have been introduced to the market (e.g. g.SAHARA1). However, the signal acquired with this electrodes results in lower BMI performance, compared to the perfor- mance of BMI based on signals acquired with gel electrodes.
EEG measures voltage differences, generally with an amplitude range of 100 microvolts (Sanei and Chambers 2007). It is thus necessary to amplify these signals before digitizing and processing them. Usually, EEG signals are amplified up to 100.000 times, which equals up to 100dB voltage gain. In order to obtain voltage differences, usually one electrode or a combination of electrodes are used as reference. The most popular referencing methods include:
Common Reference – Usually the reference electrode is placed in one or both ear lobes, or in the right/left mastoid. Then, each EEG signal channel is yielded from the difference of each recording electrode with the common reference electrode.
Common Average Reference – Here the reference is not just an electrode but is the average value of all recordings electrodes. Then, similar to common reference, each EEG signal channel is yielded from the difference of each recording electrode with the common average reference.
Bipolar Reference – This is very different from the above methods. In bipolar refer- ence, each EEG channel is the result of the difference between two electrodes. They are arranged as linked serial pairs since the reference electrode of the first channel is the active electrode of the next channel.
EEG electrode placement is very important since the signal recorded in one site is differ- ent from another. In order to standardize the placements and thus, make it easier to compare the recordings, the standard model “10–20 international system” is used (Klem et al. 1999).
The standard electrode placement (Figure 2-6) uses two fixed reference locations, the nasion and the inion, to define the size of the head. The distance from nasion to inion is divided into and intervals in the horizontal and vertical plane. Each elec-
1 A product of g.tec
2. Background MARSEL MANO, 2013
trode location has a unique label assigned in a systematic manner. Depending on the electrode location, the first character of each label can be one of the following letters: ‘O’
for occipital lobe, ‘T’ for temporal lobe, ‘P’ for parietal lobe or ‘F’ for frontal lobe. The second character can be the letter ‘z’, which denotes the midline, or a number. Labels ending with odd numbers are located on the left hemisphere while those ending with even numbers are located on the right hemisphere. Further, the distance of the location to the midline can be determined by its trailing number. The smaller the electrode number, the closer its location to the midline.
2.3.1.1 Brain Rhythms
The signals recorded with EEG consist of different oscillations named “rhythms”
(Sanei and Chambers 2007). These rhythms are very distinctive in terms of spatial and spectral localization. There are 6 classical brain rhythms (Figure 2-7):
1- Delta rhythm is usually observed in adults during sleep. It is a slow rhythm (1–4 Hz), with relatively large amplitude.
2- Theta rhythm is usually observed during drowsiness and in young children. It is faster than delta rhythm (4–7 Hz).
3- Alpha rhythm: These are oscillations, located in the 8–12 Hz frequency band, which appear mainly in the posterior regions of the head (occipital lobe) when the subject has closed eyes or is in a relaxation state.
4- Mu rhythm: These are oscillations in the 8–13 Hz frequency band, believed to be originated in the motor and sensorimotor cortex. The amplitude of this rhythm varies when the subject performs movements. Consequently, this rhythm is also known as the “sensorimotor rhythm” (Pfurtscheller and Neuper 2001).
5- Beta rhythm: This is a relatively fast rhythm, belonging approximately to the 13–30 Hz frequency band. It is a rhythm which is observed in awaken and conscious per- sons. This rhythm is also affected by the performance of movements, in the motor areas (Pfurtscheller and Neuper 2001).
6- Gamma rhythm: This rhythm concerns mainly frequencies above 30 Hz. This rhythm is sometimes defined with a maximal frequency around 80 Hz or 100 Hz and is associated with various cognitive and motor functions.
2. Background MARSEL MANO, 2013
Figure 2-6 International 10–20 electrode placement system
Figure 2-7 Brain rhythms (adopted from Wikipedia)
2. Background MARSEL MANO, 2013
2.3.1.2 EEG Signal Quality
A common problem with the signal measured with EEG is the high level of noises, which in the BMI community are commonly called artifacts. These artifacts are divided in two groups: 1) artifacts that do not originate from the subject, called subject independent, and 2) artifacts that originate from the subject (brain and/or muscle), called subject dependent.
The first group includes artifacts from the environment and the recording devices, including but not limited to: the power line, computers and computer screens, electrode amplifiers, cellphones, etc. An artifact source present in all EEG recordings is the noise induced by the EEG amplifier’s power supply. The EEG signals are very weak and they can be easily disturbed by strong environment signals.
The second group includes signals generated from brain activity not related to the specific task performed for BMI, and capable to mask and or affect the EEG signal. For instance, alpha rhythms occur in the same frequency as the P300 component (Appendix B.2.2). With strong alpha activity the P300 diminishes as it gets masked by the higher amplitudes of the alpha rhythm. In the second group are included also signals coming from muscular activity, these artifacts may originate from: a) increased muscle tension (Electromyographical artifacts), especially head or neck muscles may corrupt the EEG with heavy signal disturbances of high amplitudes; b) electrical activity of the heart muscle (cardiac artifacts); c) limb or other body movements (motion artifacts) may disturb recording electrodes; d) eye blinking and eye movements (Oculographic artifacts) are easily visible in EEG and have higher amplitude than most of BMI significant elec- trophysiological signals.
Commonly, before every BMI operation the subject’s scalp and the electrodes are cleaned, and gel is added to reduce impedance. Good grounding, reference and EEG signal electrode impedance leads to reduction of artifacts. Furthermore, the subjects, which in the research laboratories are usually healthy and able to move all their muscles, are advised to make as little movement as possible to reduce the artifacts. Reducing the amount of electronic equipment usually results in improved signal quality.
Besides artifacts, there are further limitations of EEG signals far more difficult to overcome. An EEG recording offers low spatial resolution; indeed, the signal recorded from an electrode is not just from one location. No matter where the electrode position is,
2. Background MARSEL MANO, 2013
electrical activity from close proximity sources is simultaneously recorded. The number of these sources is unknown and dynamically changes in time. Moreover, neural popula- tion’s electrical activity in the targeted brain area is impossible to measure on the scalp due to the attenuation ability of the scull. All dipole neurons of the area must be synchro- nized and must be oriented perpendicular towards the scalp with their dendrites aligned in parallel to maximize the amplitude of the electrical field in order to penetrate the scull (Niedermeyer and Silva 2005; Sanei and Chambers 2007).
2.3.2 Electrophysiological Signals Suitable for BMI
BMI communication is based on the identification of specific neural activity gener- ated signals. In the case of EEG based BMI, the communication is established by using electrical brain signals (or electrophysiological signals). Based on the assumption that similar neural activity generates similar electrophysiological signal patterns (or features), the BMI goal is to identify specific neural activities by decoding the brain signals and associating them with previously known signal patterns (or features).
Current BMI systems use various electrophysiological signals to establish BMI communication. Based on the subject’s role during the generation of these signals, there are two main categories (Curran and Stokes 2003; Wolpaw et al. 2002):
Evoked Signal or Evoked Potential (EP) are automatically generated in specific brain areas when an external stimulus (e.g. visual) is perceived by the subject. These signals, also referred to as event related potentials (ERPs),are typically generated in response to peripheral or external stimulations, and appear as somatosensory, visual, and audito- ry brain potentials, or as slowly evolving brain activity observed before voluntary movements or during anticipation of conditional stimulation (Sanei and Chambers 2007). The most commonly used signal class in this category is the Steady State Evoked Potentials (SSEP) and the P300. Since they are automatically generated, little or no subject training is required to operate the BMI system (Diez et al. 2013; Wolpaw et al. 2002). Nevertheless, an initial tuning based on offline recorded signals is still needed. The drawback of these signals is that they cannot be controlled by the subject, but only by the external stimulus device (e.g. monitor).
Spontaneous Signals are voluntarily generated by the subject following a voluntary cognitive process (i.e. mental activity). In this category, the most commonly used sig-
2. Background MARSEL MANO, 2013
nals are the motor and sensorimotor rhythms. Other spontaneous signals used for BMI include, Slow Cortical Potentials (SCP) (Hinterberger, Schmidt, et al. 2004;
Birbaumer 2006) and non–motor cognitive task generated signals like mental mathe- matical computations, mental rotation of geometric figures, visual counting, mental generation of words, music imagination, etc., (Cabrera, Farina, and Dremstrup 2010;
Chai et al. 2012).
A description of the most popular electrophysiological signals acquired with EEG and used for BMI is shown in Appendix B. In this thesis, we will focus on spontaneous signals generated by motor and sensorimotor rhythms, which will be addressed in the next section.
2.3.3 Sensorimotor Rhythms
These brain rhythms are believed to be originated in the motor and sensorimotor cortex during a motor movement (e.g. hand movement) or imagination, by the subject.
They are mainly generated in the and rhythm frequency bands, which are present in most healthy adults (Pfurtscheller and Berghold 1989). It is possible for a human to voluntarily control these rhythms. This feature makes these rhythms very attractive for BMI usage. In the following, we are going to explain two traditional approaches used to communicate through BMI by using sensorimotor rhythms:
Operant Conditioning – In this approach, the subject learns to voluntarily modify the amplitude of his sensorimotor rhythms through a (very) long training procedure using real time feedback (Wolpaw and McFarland 2004; Wolpaw et al. 1991;
Vaughan et al. 2006; Wolpaw 2007). After training the subject is able to generate eas- ily detectable sensorimotor rhythms.
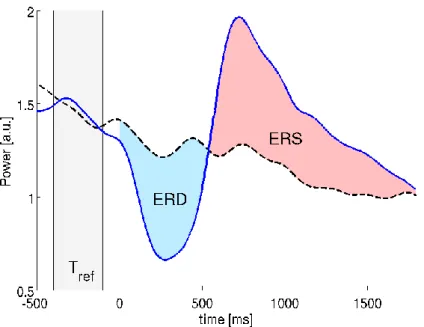
Motor Imagery – During an EEG recording session if the subject performs a motor movement (or imaginary motor movement), a power decrease in and rhythms can be noticed over the corresponding motor cortex part of the imagined limb. This pro- cess is called Event Related De–synchronization (ERD). After the MI task is finished there is a recovery in the power of and rhythms known as Event Related Syn- chronization (ERS) (Lemm, Müller, and Curio 2009; Pfurtscheller and Lopes da Silva 1999; Pfurtscheller et al. 1998). The dynamic of the above electrophysiological activi- ty is shown in Figure 2-8.
2. Background MARSEL MANO, 2013
Figure 2-8 Event Related De–synchronization and Event Related Synchronization (ERD/ERS) (adopted from (Lemm, Müller, and Curio 2009))
The ERD/ERS process starts around one second before the actual movement or the imaginary movement. This is commonly referred to as Readiness Potential or Pre–
Motor Potential. This potential is associated with pre–motor cortical activity that hap- pens in the planning area of motor cortex. The ERD/ERS generated from MI is broadly used for BMI communication. Usually up to three MI tasks are used in BMI, each associated with a command or a control action (Wolpaw et al. 1991; Blankertz, Dornhege, Krauledat, Müller, et al. 2006; Pfurtscheller et al. 1997).
2.3.4 Conclusion
There exist successful BMI implementations with all the signals presented in this section. Depending on a specific application every signal has its advantages and its disadvantages, this makes the selection of the signals closely related to the application.
EP can be operated without subject training, but they require continuous usage of external stimuli which can be tiring for the subjects. For instance, it has been reported that the P300 amplitude elicited by the mental task decreases over time due to mental and physi- cal fatigue (Ullsperger, Metz, and Gille 1988; Sanei and Chambers 2007).
In the case of robot control, spontaneous signals are more natural and comfortable to use since they do not rely on external stimuli, but they generally require a long training time. Commonly, before using a MI based BMI system online (i.e. to control a robot in
2. Background MARSEL MANO, 2013
real time), few training sessions are required to tune the BMI in order to become reliable (Pfurtscheller, Graimann, and Neuper 2006). In this direction, recent machine learning and signal processing methods have shown to significantly reduce the training time while still keeping good BMI communication quality (Blankertz, Dornhege, Krauledat, Müller, et al. 2006; Krauledat et al. 2008; Blankertz et al. 2007). Anyway, there remains the need for the subjects to be able to concentrate on the mental task, and with no doubt trained subjects perform better than untrained ones.
In this thesis, we will focus on the detection of MI brain activity generated electro- physiological signals, for the task of BMI based navigation of a robotic wheelchair in real time.
3. Brain Machine Interface MARSEL MANO, 2013
3 Brain Machine Interface
This chapter gives a general overview of BMI systems. It starts with the introduc- tion of the generic diagram of a BMI system (Section 3.1). Then, it continues with some important definitions of the BMI systems (Section 3.2). The last part of this chapter (Section 3.3) contains a literature review of the BMI system applications in different research fields including, communication and control, gamming and virtual environments, motor recovery, and motor substitution.
3.1 BMI Diagram
BMI is a relatively new, multidisciplinary research field that involves computer science, signal processing, intelligent robotics, neuroscience, etc. The BMI systems are usually used to control assistive robots (Perrin et al. 2010; Mano and Capi 2013), com- municate with computers (Birbaumer et al. 2000), play games (Lotte 2011; Nijholt, Bos, and Reuderink 2009), etc.
Since there are many ways to establish a BMI communication and the BMI applica- tions cover a wide area of different fields, there does not exist a unified standard diagram for BMI. Anyway, a conceptual generic diagram of a BMI system that controls a robotic wheelchair in real time is shown in Figure 3-1. A BMI system usually follows six steps during online operation: signal acquisition, signal processing, feature extraction, classifi- cation, robot control command and feedback (Mason and Birch 2003):
1- Signal Acquisition (brain activity measurement) is done by using different types of sensors that measure brain activity (Shih, Krusienski, and Wolpaw 2012). In this the- sis, we will focus on the electrophysiological brain signals measured by EEG.
3. Brain Machine Interface MARSEL MANO, 2013
Figure 3-1 Generic diagram of a BMI system
2- Signal Processing is used to remove signal noise, while preserving or even enhancing important information that is embedded within the recorded brain signals (Bashashati et al. 2007).
3- Feature Extraction (in some BMI application is also considered as part of the signal processing step) has the goal of extracting the values or features of the brain signals that best describe the targeted mental activity.
4- Classification assigns a “class” to the features extracted from the previous step (Lotte et al. 2007). In BMI, “class” refers to a specific mental state or mental activity which is used to establish BMI communication.
5- Robot Control Command. The output of the classifier is usually associated with a control command (i.e. turn left or turn right) that is used to actuate a robot (Wolpaw et al. 2006).
6- Feedback is used to notify the subject with the results of the classifier (mental state classification output). It is a common belief that subjects can, at some level, control and adapt their brain signals in order to achieve better BMI performance (Wolpaw et al. 2002). Feedback can be visual or auditory (Wolpaw et al. 2002; Hinterberger, Neumann, et al. 2004; Brumberg, Guenther, and Kennedy 2013).
As mentioned in Section 2.3.4, offline recording session(s) are used to calibrate the signal processing, classification and feature extraction algorithms of the BMI system. During offline session(s), the BMI subject is asked to repeat some predefined mental tasks for a certain amount of time while brain activity is monitored, recorded and stored in a com- puter.
The offline sessions are crucial to the BMI system performance. Since every sub- ject’s mental activity has unique characteristics, then the BMI must be calibrated with the specific subject brain activity recordings (Pfurtscheller and Neuper 2001).
3. Brain Machine Interface MARSEL MANO, 2013
3.2 Definitions
A brain computer/machine interface is a direct communication pathway between the brain and an external device (Wolpaw et al. 2000) that does not depend on the brain’s normal output channels of peripheral nerves and muscles (Wolpaw et al. 2002). This communication is based on the principle of decoding the brain activity produced while the BMI subject performs specific mental tasks. BMI systems are usually distinguished by three main features:
Dependence – A dependent BMI (Lalor et al. 2005; Allison, Graimann, and Gräser 2007) uses some level of motor control from the subject, whereas an independent BMI relies only in the online measured brain activity (Allison, Wolpaw, and Wolpaw 2007). By using motor functions, a dependent BMI system offers higher communica- tion and control capabilities compared to an independent BMI system. But, in the case of BMI applications targeted at disabled people, residual motor functions are not al- ways available, thus the independent BMI systems are the only solution.
Invasiveness – Depending on the placement of the signal acquisition electrodes (or sensors) that measure the brain activity, a BMI system can be classified as invasive, partially invasive or non–invasive. If the electrodes used for brain activity measure- ment are placed within the cortex, the BMI system is called invasive or fully invasive (Moritz, Perlmutter, and Fetz 2008; Mano et al. 2013). If the electrodes are placed in- side the skull but outside the cortex area, the BMI system is called partially invasive.
Last, if the measurement electrodes are placed outside the head (i.e. on the scalp) the BMI system is called non–invasive (Wolpaw et al. 2002; Shih, Krusienski, and Wolpaw 2012). With an invasive BMI it is possible to acquire better signal quality and thus improve overall communication performance, but invasive BMIs are very risky, expensive and require brain surgery.
Device Synchronization – Depending on the subject’s interaction with the system, there are two types of BMIs: synchronous (device–paced) and asynchronous (self–
paced). When using a synchronous BMI, the subject can interact with the robot or the BMI application only when notified by the system through a visual or auditory signal, called device stimuli. This interaction involves the subject performing a certain volun- tary mental task, or the BMI system detecting itself an involuntary mental activity, for a predefined amount of time. Before the stimulus and after the mental task time ex-