The oceanographical research in the
Northeastern Pacific II
著者
HENMI Tomio
journal or
publication title
鹿児島大学水産学部紀要=Memoirs of Faculty of
Fisheries Kagoshima University
volume
26
page range
227-248
別言語のタイトル
北東部太平洋に於ける海洋学的調査 II
Vol. 26 pp. 227-248 (1977)
The oceanographical research in the
Northeastern Pacific—IITomio Henmi*
Abstract
Oceanographical observation and biological research in the eastern boundary region of the North Pacific Ocean were carried out on the fisheries training and research ship "Keiten Maru" of Kagoshima University from June to July, 1976.
When the present results are compared with those obtained last winter (1975), some differ ences are found in the oceanic characteristics and the distribution of zooplankton, as summa
rized follows.
1) In the subsurface water layer, the thermocline can be well observed, and it becomes
gradually shallower in an easterly direction. The depth of the thermocline was shallower dur
ing this summer than during last winter, though the vertical gradient of the thermocline did not show a remarkable difference.
2) The appearance of a short-time-scale-upwelling around 136°W was suspected during the summer.
3) The remarkable transition zone of salinity was observed around 128°W.
4) Based on a study of each temperature-salinity diagram a discussion of the character istics of the water masses is given. The temperature-salinity diagrams of this region were divided into five groups this summer, and three groups last winter.
5) The main current axis in the meso-scale eddies of the western waters shifted to the east about 200 miles compared with that of last winter and the maximum-flow-speed was far less in the summer than that observed last winter. The main current axis in the region of the Cali fornia Current is almost in the same place but the maximum-flow-speed was somewhat slower this summer than that observed last winter.
6) Of the total number of zooplankton in this region Copepoda were in the majority followed by Ceratium. The gross number of occurence of zooplankton, especially Copepoda, was smaller in the summer than in the winter. On the other hand, it is pointed out that Ceratium and Appendicularia were more abundant in the summer than last winter throughout this region.
1. Introduction
It is well known that high marine productivity among such species as tuna, marlin, skipjack and sardine in the eastern North Pacific Ocean (especially off the coast of California) is caused by the up welling of water masses. The circulation and up-welling in this region have been studied by many oceanographers: Sverdrup and Fleming (1941)», Wooster and Reid (1963)2), Tibby (1941)3), Munk (1950)«, Roden (1971)5) and Yoshida (19556), 19677)).
As part of the university student training program, oceanographical observation
and biological research of the tuna fishing grounds were carried out on the training ship "Keiten Maru" of the Kagoshima University in the upwelling region of the
eastern North Pacific Ocean from Dec. 1974 to Feb. 1975. Those results were pre
sented in a previous paper8' (Henmi 1976).
The author of the present paper carried out oceanographical observation and bio logical research on the Keiten Maru from Jun. to July, 1976 in the same region of the eastern North Pacific Ocean.
The general features of the oceanic condition and the distribution of zooplankton
in this region are discussed by comparison with the previous paper. The present
paper is concerned with a report of the main results.
The author wish to express their sincere thanks to Prof. Yoshida of Tokyo Uni versity for many helpful discussion and suggestions concerning this work and to the crew of the Keiten Maru for their skillful handling of the ship during our research.
2. Materials and Methods
The oceanographical research was made on the Keiten Maru (G. T. 860 ton), the
HAWAII AN ISLANDS
O a O
o a
NOR!'- PACIFIC OCEAN
fisheries training and research ship, Faculty of Fisheries, Kagoshima University, in
the eastern boundary region of the North Pacific Ocean.
The first series of the observation were made in the northeast area of the Hawaiian
Islands (Lat. 27°N-29°N, Long. 138°W-147°W) from June, 1, to 11, 1976 and the second series, off the coast of California (Lat. 28°N-32°N, Long. 123°W-137°W) from
June, 30, to July, 3, 1976.
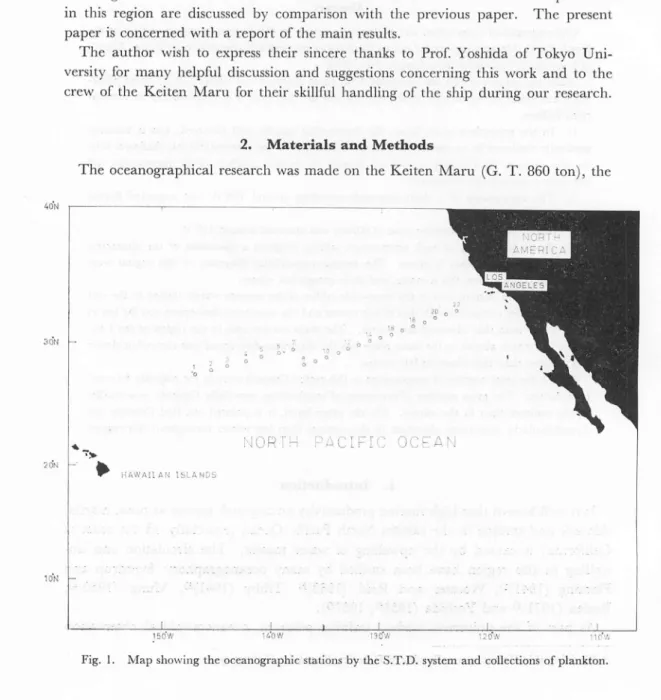
The observational stations are shown in Fig. 1. The first observation point will
hereafter be referred to as the western waters and the second series, as the eastern
waters. The oceanographical data were obtained with S. T. D. (Plessy Model
9040) and zooplankton were collected with Marutoku net (45 cm in mouth diameter,
100 cm in length, bolting silk net GG 54).
The methods of the oceanographical observation and the sampling of zooplankton
were quite similar to those reported in the previous paper. The representative traces
for water-temperature and for salinity in the western waters and in the eastern waters
are shown in Fig. 2, (a), (b), (c), (d), (e) and (f).
STATION 1 Fig. 2. (a) STATION 11 Fig.2.(b)
\ .
Fig. 2. (c)STATION IS STATION 21 • ' blAIION22
Fig. 2.(d) Fig. 2.(e) Fig. 2. (f)
The values of temperature and salinity at each station were summarized in Table 1 and the individual number of zooplankton in one cubic meter was tabulated in
Table 2.
3. Results and Discussions
(1) The vertical distribution of water temperature and salinity
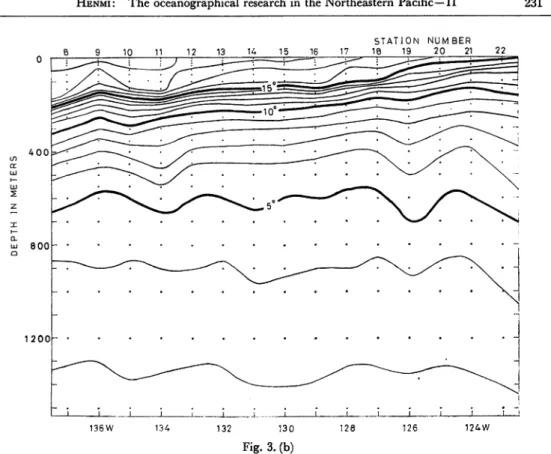
The vertical distribution of water temperature in the western waters and the east
ern waters are shown in Fig. 3, (a), (b).
It is indicated in Fig. 3, (a), (b) that the value of the water temperature of the sur
face water at 147°W and 123°W were 21.4°C, 15.1°C respectively. The water tem
perature of the surface water became lower as the continental coast is approached
from offshore. The depth of the thermocline was at the depth of 100m-200m be
tween from 138°W to 147°W and became shallower eastward from 136°W.
The vertical gradient of the thermocline is 6°C/100m around 146°W and 7°C/
100 m around 136°W. This may not seen to be a remarkable difference. A remark
able peak of the isotherms found at the depth of 100m around 136°W seems to be
indicative of the existence of an upwelling. During the observation period, an east erly wind was predominant. It was not clear that the upwelling phenomenon around
STATION NUMBER
4 5 6
146W H4 142
Fig. 3. (a)
400 800 1200-STATION NUMBER 18 19 20 21 132 130 128 126 124W Fig. 3. (b)
Fig. 3. Vertical distribution of temperature along the latitude of 27°N-29°N, between 138° W and 147°W, (a) and along the latitude of 28°N-32°N, between 123°W and 137°W, (b).
136°W was due to these winds; but the phenomenon may be supposed to be a short-time-scale upwelling similar to the phenomenon of the upwelling around 128°W in the research of last winter.
In general, the water temperature of the surface water was highest in the western
waters and lowest in the eastern waters but the horizontal inclination of the water
temperature was smaller in the summer of 1976 than that in the winter of 1975. It
seems that the depth of the thermocline was shallower in the summer of 1976 than that in the winter of 1975, though the vertical gradient of the thermocline did not
show any remarkable difference according to the seasons or years. The slope of iso
therms below the 600 m depth was more undulating in the summer of 1976 than that in the winter of 1975, which may suggest the aspect of the fluctuation of the North
Pacific subarctic intermediate water.
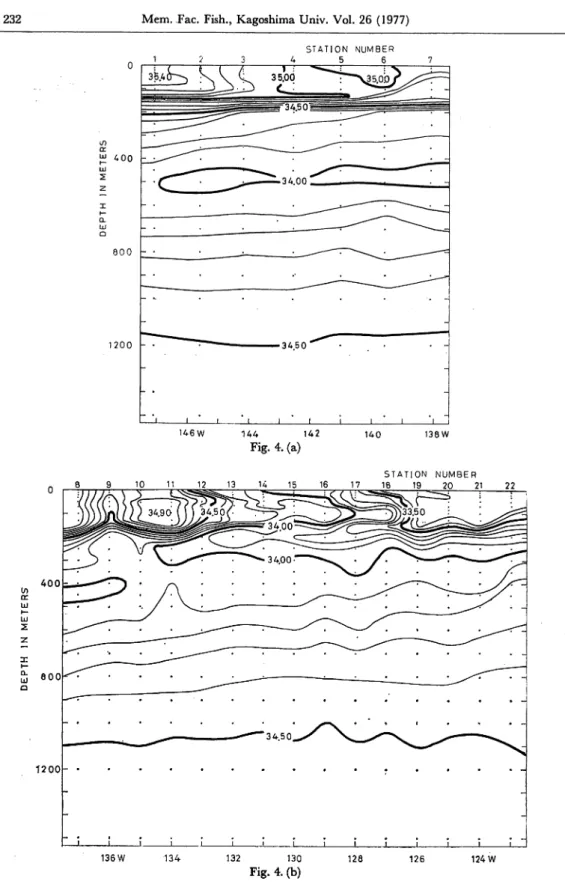
The vertical distribution of salinity in the western waters and the eastern waters
are shown in Fig. 4, (a), (b).
Regarding vertical distribution of salinity (Fig. 4, a, b), an area of the surface water with a salinity lower than 33.50%* extends from the east to around 128°W in the sur face layer and saline water with a salinity exceeding 35.00%o was found around 143°W.
400 800 1200 136W 146W 134 STATION NUMBER 4 5 6 7 144 142 Fig. 4. (a) 132 130 Fig. 4. (b)
Fig. 4. Vertical distribution of salinity along the latitude of 27°N-29°N, between 138°W and
147°W, (a) and along the latitude of 28°N-32°N, between 123°W and 137°W, (b).
140
128
138W
The surface water with a salinity of 34.90%* is found in the region 134°W-135°W, forming a remarkable transition zone of salinity to the higher salinity water around 129°W. - The transition zone corresponds almost exactly to the abovementioned up welling and it was found that the vertical mixing of the water masses is distinguished.
The numerical value of salinity gradually decreases toward the east and the saline water with salinity higher than 34.00%© is stretched out as far as 131°W-127°W.
The transition zone of salinity is formed of saline water and lower salinity water which
originates in the subarctic water in the region of the California Current. The remark
able peak of the isohalines at a depth of about 300 m around 127°W may suggest the
existence of an upwelling of the North Pacific intermediate water. At a depth of
about 300 m, it may be seen that the aspect of the slope of isotherms is almost simi lar to the slope of isohalines.
In the research of last winter, the remarkable transition zone was formed around 128°W but it was found to be somewhat to the east in this research. This zone was
also described at the same position in the vertical distribution of salinity in the report
by Roden (1969). It is considered that during the year, irrespective of the season,
the transition zone is formed from the saline water of the eastern North Pacific Cen
tral water which originates in the North Pacific Current and the low salinity water
originating in the California Current. It is obscure, however, what the cause of the
abovementioned phenomenon is.
(2) Temperature-salinity relation
The representative tempreature-salinity diagram in the region of the eastern North
Pacific Central water and the diagram of the water in the region of the California
Current are drawn making use of the NORPAC DATA (1955)9> and the DATA of
Sverdrup. The former is hereafter to be referred to as the Cn-water type and the
latter, as the Ca-water type, respectively.
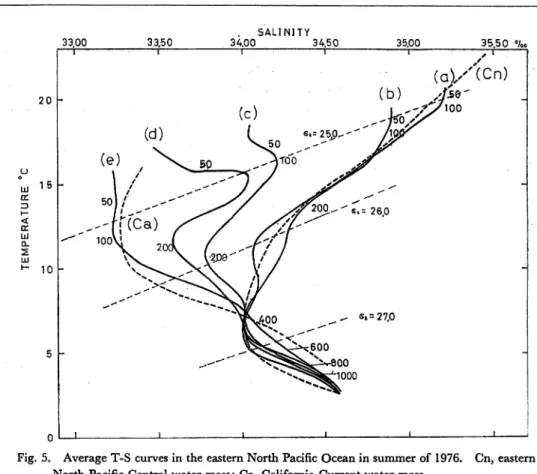
From data collected during the summer and last winter, temperature-salinity dia
grams were drawn. The characteristics of the water masses are discussed and com
pared with the abovementioned two water types. As a result of this study, the tem
perature-salinity diagram are divided into five groups for the summer period and
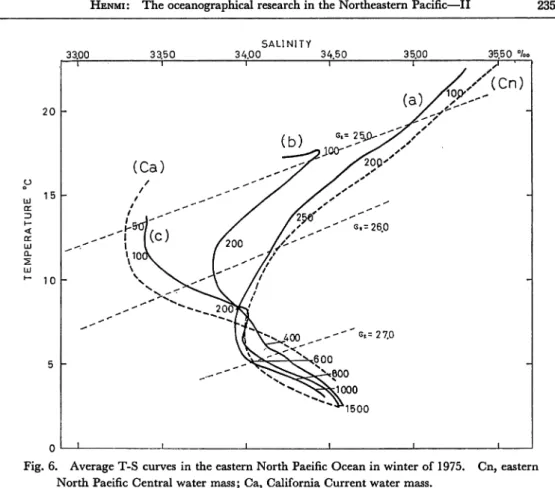
three groups for the winter period, shown in Fig. 5 and Fig. 6 respectively.
1. The first group (Fig. 5, a)
This group is found in the region of Lat. 27°N-29°N, Long. 142°W-147°W and
almost similar to the Cn-water type. It is seen that the aspect of high salinity is found
in the layer at the depth of about 300m. The intermediate water at a depth of
about 500 m may be recognized as the North Pacific subarctic intermediate water
having 6.5°C in temperature and 34.00%o in salinity.
2. The second group (Fig. 5, b)
This group is found in the region of Lat. 28°N-30°N, Long. 134°W-141°W. The
33.00 3.3.50 SALINITY 34.00 34.50 3.5.00 35.50 %o 20 -1 1 1 1 '
(ay (Cn)
(b)
,^se'
(c) 1 ^'/</'00 (d) ( «.= 2^---rsT
\ 5 0 ^ " Lr(e)
\
X. 50
^)™Q
4
\ / -* - l / *2r - I / 1 / - J / *ir ^ -1 / 501/ ^'* ^ j f ' j/r™^'''**= 26.0 ^""iooVA
20Cj
\ Use" 1/ / -^ c -^ " j>^^ s A \ i)/ -»* ^ ^ X ' / ^*-~* **«•» ^ v \ / y" TVLoo
sk=27.0 n \ \ . ^— "^ vfe^N^^ 1 1 i i i t 15 HI t r < tr m o. 2 10 5-Fig. 5. Average T-S curves in the eastern North Pacific Ocean in summer of 1976. North Pacific Central water mass; Ca, California Current water mass.
Cn, eastern
temperature and low salinity water is found in the layer from the surface to a depth of 150m. It is seen that the lower salinity water is found at a depth of about 200m and 450 m. The lower salinity in the layer at the depth of about 450 m corresponds almost exactly to the minimum salinity of the Cn-water.
3. The third group (Fig. 5, c)
This group is found in the region of Lat. 29°N-30°N, Long. 129°W-132°W and the numerical value of the temperature and salinity in the surface layer is lower than that of the Cn-water. The temperature-salinity diagram shows quite a difference to the second group; i. e. the numerical value of salinity in the surface layer is lower than that of the second group. Saline water with a salinity of 34.20%© is found in this layer at the depth of about 100m and lower salinity water is found in the layer at the depth of 200m and it is 0.25%© lower than that of the lower salinity in the second group. It may be considered that the type of this temperature-salinity diagram indicates on the plane of relation an equivalent rate of mixture of both the Cn-water and the Ca-water. It is not clear that a remarkable intermediate water layer exists at the depth of about 500m in the second group.
SALINITY 20 15 33.00 33.50 34.00 34 50 35.00 35.50 %o i i i i i j y y
yLy(Cn)
-y ?(b)
+\^jx/
zj^2\wr yX X (Ca) ** "* /^X xX2Wr / <-'"' X X X / - - X X X f i 1 ^Jl" --*•" y / * ^X
Ay*' ^-""
^ !(C)
X / / *' G*=26.0 ^.-."" /200 //** \iooV I »" 7* 1 ' "" /' N. ^ ""•C V /l v .--• ^*N^^ V / i ^ " " ^--^ookj'^^*>x / / *"*[ft \^s400 _^-""st=27.0
1 1v^c^vX^oo
Vx>^^oooo
^"^1500 I 1 1 1 10 -5 -0Fig. 6. Average T-S curves in the eastern North Paeific Ocean in winter of 1975. Cn, eastern North Paeific Central water mass; Ca, California Current water mass.
4. The fourth group (Fig. 5, d)
This group is found in the region of Lat. 31°N, Long. 127°W-128°W. The nu
merical value of salinity in the upper layer above the depth of 150 m is lower than that of the third group and it is 0.60%© lower at the surface, 0.20%© lower at the depth
of 100m and 200 m respectively. It may be considered that this diagram suggests
the existence of a transition zone of salinity, which is found around 127°W as stated above (chapter 2).
5. The fifth group (Fig. 5, e)
This group is found in the region of Lat. 31°N-32°N, Long. 123°W-126°W. The
type of temperature-salinity diagram corresponds almost exactly to that of Ca-water. As indicated in Fig. 6, (a) the first group of temperature-salinity diagram of last winter is found in the region of Lat. 26°N-28°N, Long. 140°W-150°W and corres
ponds almost exactly to the Cn-water type. The numerical value of salinity in the
upper layer above the depth of 300 m is somewhat lower than that of Cn-water. It
is found that North Pacific subarctic intermediate water exists at the depth of about
type of the first group. (Fig. 5, a)
The second group (Fig. 6, b) of temperature-salinity diagrams from last winter is
found in the region of Lat. 31°N, 128°W-129°W. The numerical value of the tem
perature and salinity in the surface layer is lower than that of Cn-water. It is seen
in this figure that a comparatively high salinity of 34.45%© is found at the depth of 100m and the lower salinitys exist at the depth of 250m and 500m respectively.
The lower salinity at the depth of 500 m seems to be indicative of the existence of
subarctic intermediate water.. This type of temperature-salinity diagram is equal to
the water type of the third group. (Fig. 5, c)
The third group of temperature-salinity diagrams from last winter (Fig. 6, c) is
found in the region of Lat. 31°N-32°N, Long. 123°W-127°W. It is recognized that
the aspect of low temperature and high salinity is seen in the upper layer above the
depth of 200 m, though the temperature-salinity diagram is about the same as the
Ca-water type. The type of this temperature-salinity diagram is almost similar to
the water type of the fifth group. (Fig. 5, e)
(3) Southward and northward flow
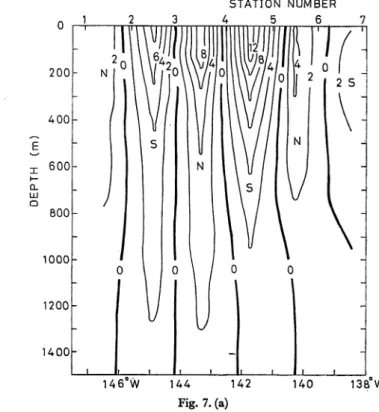
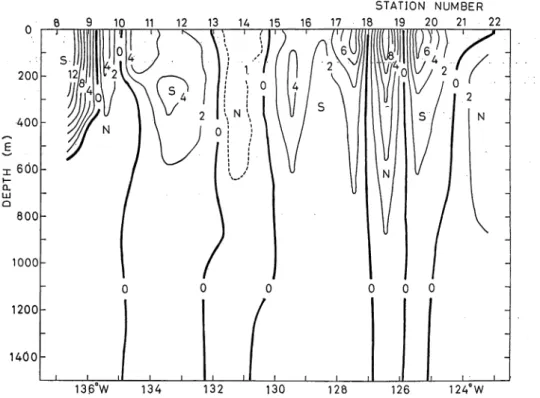
The distribution of south-north component of geostrophic current referred to
1,500 m depth in the western waters and the eastern waters of the eastern North Pa
cific Ocean are shown in Fig. 7, (a), (b) and their transport volumes are listed in Table 3. 200 400 600 Q. LU Q 800 1000-1200 1400 146 W STATION NUMBER 4 5 6 7 144 142 Fig. 7. (a) 140 138 W
200 400 i x 6d0 \— o. LU a 800 1000 1200 1400-STATION NUMBER 8 9 10 11 12 13 14 15 16 17 18 19 20 21 22 13.6 W 124°W
Fig. 7. The north-south component (cm/sec) of calculated relative current velocity referred to
1,500m; (a) along the latitude of 27°N-29°N, between 138°W and 147°W, (b) along the latitude of 28°-32°N, between 123°W and 137°W
Table 3. Values of the current velocity and the transport of component of
geostrophic current in the eastern North Pacific Ocean.
Position of South-North Current Transport
current axis component velocity
(Long. W) (cm/sec) (105m3/sec)
144°-50'W South 9 49.7 Western 143°-30'W North 10 53.1 Waters 141°-30'W South 14 67.0 140°-20'W North 5 34.3 135°-30'W North 6 26.8 134°-20,W South 6 63.8 Eastern 121°-20'W North 2 17.3 Waters 127°-30,W South 9 71.9 126°-30'W North 12 36.3 125°-30'W South 9 33.1
In the western waters, the component of the direction of the current shows the
alternate distribution of the south and north components. This is considered to be
indicative of the irregular meso-scale eddies. Such as stated in the previous paper,
wheth-er these eddies are caused by the wind-spun vortex accompanied with the subtropi
cal gyre in the eastern boundary region of the eastern North Pacific Ocean or those caused from the topographical effect of Hawaiian Islands or those due to baroclinic
instability. It seems that the scale and the situation vary very much, irrespective of
the season.
The main current axis is situated around 141 ^CW in the southward flow and
around 143°-30'W in the northward flow. The maximum speed of the southward
flow is higher than that of northward flow. The numerical value of the maximum speed of the southward flow and the northward flow are ca 14 cm/sec, 10 cm/sec and
the volume transport of the southward component and the northward component
are ca 67.0 X 10⁵ m3/sec, 53.1 X 10⁵ m3/sec respectively.
The current axis of the southward flow shifts to east about 200 miles compared with
that of last winter. The maximum speed observed this summer is far slower than
that observed last winter.
In the region of the meso-scale eddies around Lat. 24°N-29°N, Long. 140°W-146°W, a comparison was made of the amount of the total transport of the water masses for this summer, ca 20.4 X 10⁶ m3/sec; for last winter, ca 36.7 X 10⁶ m3/sec; and
of that reported by Sverdrup et al. (1937), ca 24.3X10⁶ m3/sec. It is shown that
the amount of the total transport of water masses for the last winter was comparative ly larger than for the other two.
In the eastern waters, the North Pacific Current is blocked by the west coast of the
North American Continent causing the southward flow of the California Current; however the northward flow that accompanies the California Current is a portion of the local eddies turning in a clockwise direction and seems to nearly correspond to
the phenomenon of the thermocline spread. (Fig. 3, b)
The current axis of the southward flow is situated around at 127°-30/W and
125°-30/W. The numerical value of the maximum speed of the southward flow is ca
9 cm/sec and the volume transport of the southward component is ca 71.9 X10⁵ m3/
sec and ca 33.1 X 10⁵ m3/sec respectively. The current axis of the northward flow is
situated around 126°-30'W and the numerical value of the maximum speed of the
northward flow is ca 12 cm/sec and the volume transport of the northward flow is ca 36.3X10⁵ m3/sec. The current axis of the southward flow and northward flow
are almost similar to those observed last winter but the maximum speed of the current is somewhat slower than those investigated last winter.
In the region of the California Current around Lat. 30°N-33°N, Long. 124°W-130°W, a comparison was made of the amount of the total transport of the water
masses for this summer, ca 14.1 X10⁶ m3/sec; for last winter, ca 26.4 X 10⁶ m3/sec;
and of that reported by Sverdrup et al. (1937), ca 22.1 x 10⁶ m5/sec.
Similar to the total transport in the region of the meso-scale eddies, this comparison
shows that the total transport of last winter has a tendency to be larger than that of the others.
east-2000-1 STATION 1 si
-M_M_ii_
ID HI
WOO-i 1500-! I *°°1 STATION' i TT Ln TATI0N 7 STATION 10 STATION 5 STATION 8 _M_ STATDN 11n
STATION 3 n STATION 5Ull]
STATION 9 STATION 12Fig. 8. Occurrence of the estimated number of zooplankton organisms per cubic
00 § c a. NUMBER OF INDIVIDUALS
Dl
s? 3 i: o o S NUMBER OF INDIVIDUALS in o m O ? ? ?°1
NUMBER OF INDIVIDUALS 8 8 88 _J l l I1
NUMBER OF INDIVIDUALS -1 ° T?1
K* •8CA K 3 p di
ern North Pacific Ocean is comparatively somewhat better in winter than in summer. It is not clear whether the difference of the total transport is caused by the method
of taking the motionless surface in the Dynamic calculation, by the geographical difference of the observation point, or due to the data used in this paper, which may exhibit certain seasonal and annual variations.
(4) Distribution of zooplankton
The distribution of zooplankton in the eastern North Pacific Ocean is shown in
Fig. 8.
The zooplankton communities in this region are representative of Copepoda, Cera
tium, Appendicularia, Radiolaria, Foraminifera. Copepoda occupies the greater part, next
one is Ceratium and the rate of the number of occurence are about 70%, 20% in total
individual number in this region. Chaetognatha, Polychaeta, Ostracoda, Thaliacea have a
wide range but the number of individuals is very few. The total number of zooplank
ton varied from about 460 to 1,500 individuals per cubic meter.
The eastern North Pacific Ocean may be divided into three major salinity zones:
the water mass (137°W-147°W) of high salinity with higher than 35.00%0 in salinity;
the water mass (129°W-136°W) of 34.00%o-34.90%0 in salinity; the water mass of low
salinity with less than 33.50%* in salinity. The average number of occurence in each
water mass is 843 individuals in the first group, 974 individuals in the second one and
1139 individuals in the third one respectively. It seems to be the tendency for the
number to increase in the lower salinity water in this region.
When a comparison of the total number of zooplankton per cubic meter found
this summer and that found last winter is made, it is found that the total number of
zooplankton is not remarkably different in the water mass with high temperature and high salinity water at Lat. 27°N-29°N, Long. 141°W-147°W but the number decreases sharply in the water mass with low temperature and low salinity water at Lat.
31°N-32°N, Long. 123°W-127°W. This area is especially characterized by a very low
individual number of Copepoda. Copepoda were greater in total number last winter
than this summer and the individual number of Ceratium, Appendicularia were very few but it is pointed out that Ceratium, Appendicularia were more abundant this summer than was observed last winter throughout in this region.
It is obscure whether these phenomena are caused by an abundance of
nutrient-salts in the cold water flowing from a relatively high latitude to the South, or by
up-wellings occurring in many places or by a deficient supply of nutrient-salts from below
because the surface water had become stable vertically.
4. Summary
The oceanographical research in the eastern North Pacific Ocean was carried out,
in the winter season from Dec, 1974 to Feb., 1975 and in the summer season from
June to July, 1976 again. The results obtained are summarized as follows:
242 Mem. Fac. Fish., Kagoshima Univ. Vol. 26 (1977)
gradually shallower in an easterly direction. The depth of the thermocline
was shallower in the summer than in the winter, though the vertical gradient
of the thermocline did not show any remarkable difference.
(2)
The appearance of a short-time-scale upwelling around 136°W was suspected
in the summer, though it was found around 128°W last winter.
(3) The remarkable transition zone of salinity was observed around 128°W.
(4)
The temperature-salinity diagrams in this region are divided into five groups
in the summer, and three major groups last winter; i. e. they can be classified
as the California Current zone, the eastern North Pacific Central water zone and the mixing zone of both water as stated above.
(5) The main current axis was situated around 141°-30'W in the western waters
and around 127°-30'W in the eastern waters and the maximum-flow-speeds
were 14 cm/sec and 9 cm/sec, respectively. The main current axis shifted tothe east about 200 miles in the western waters but was at almost same place in
the eastern waters. The maximum-flow-speed is far less in the western waters and somewhat less in the eastern waters compared with that observed last winter.
(6) Copepoda exists in greater numbers, next is Ceratium. The rate of the number of
occurence was about 70%, and 20% in total individual number in this region.
Radiolaria, Foraminifera, Ostracoda and Thaliacea occurred very widely, though
the number of individual was very small. The gross number of zooplankton is not remarkably different in the western waters but it decreases very greatly in the eastern waters, especially the individual number of Copepoda is very
small. Ceratium, Appendicularia were more abundant in the summer than in
the winter throughout this region.
References
1) Sverdrup, H. U. and Fleming, R. H. (1941): The waters off the coast of Southern California, March to July, 1937. Bull. Scripps Inst. Oceanogr., 4. (10). 261-378.
2) Hill, M. N. ed. (1963): The sea Vol.2. Interscience. New York. 253-280. Wooster, W. S.
and Reid, J. L. Eastern boundary current.
3) Tibby, R. B. (1941): The water masses of the west coast of North America. /. Mar. Res., 4, 112-121.
4) Munk, W. H. (1950): On the wind-driven ocean circulation. J. MeteoroL, 7. (2). 79-93. 5) Roden, G. I. (1971): Aspects of the Transition Zone in the Northeastern Pacific. /. Geophys.
Res., 76. (15). 3462-3475.
6) Yoshida, K. (1955): Coastal upwelling off the California coast. Rec. Oceanogr. Works Jap. 2. (2) 8-20.
7) Yoshida, K. (1967): Circulation in the Eastern Tropical Oceans with special References to up welling and undercurrents. JAPIVESEJOURNAL OF GEOPHYSIC. 4. (2). 1-75.
8) Henmi, T. (1976): The oceanographical research in the Northeastern Pacific I. Mem. Fac. Fish. Kagoshima Univ. 25. (1). 161-180.
9) NORPAC (1955): Oceanic observation of the Pacific. The NORPAC data. Univ. Cal. Press. Berkly and Los Angeles. Univ. Tokyo Press, Tokyo, 1960.
3 O §• u bo o a a z (xl X O Q h CO z£ CO CM go1 \3 CN v'<0
3l
Ik CO i) o ££ m "*• >> v-v' tO .•y r-r-» ^r CO CNrh COG* or ^m (N CN"^ 'H a —• co bb d^. § 3§ so °.^ . CO r-—* CN O Co' o1 '£CN ^ rt — si* •CO co . 2P• d^ o§ cs SO OO i0 50 50 0C Ni Oe Ot Nl ^i f) ^0 5C nO Cn tD a5 Cn <D CO Ol D C mi 0^ Ne -< )O O0 OO (N NN 0( OC «O OO OO •H ^^ -. ^^ Ot Dm oo t^ co r^ T^ to rh oo ^r ^c o^ oo co r^ eO CO MC OC MO M^ «-CO CO OC f) rN CO ^M NO r^ CN CO lO in mi ni ni oc Ni o-Tt 'i ri co -' Mi o-'c ot fi co Nc oi Nc o r) mi O^ Ne ^t OO ^O tN CN CO iO CO O^ -C Tt 't t^ t' ^' "^ ^. ^^COCN^COThCNCOCNOO^OOCX) CN lOCN 00COCNtq ^^^^^^Oc6^Thcsi^c>c6r^c£>ir)T^^(^ScococN (N CN CN CN tN CN CN — '- "- ---h z£ CDCNCO^ O Oi CJ>CO "43CNCO eg -« ^ bb 15§ g 3* CO SO CJ o 00 >* o2 a^ co# 00 do1 OCO '£ CM 00 •g •oU § o c« So oc OOO \3CN CO 03 ^^ 2 .-co co^:s$ 5P • d^ §§SO ^c NC Ni oi Dc om tf l^ oo co in ^^ oc O' tc ot ^r ^e oM co iq iq o^ Ne HN o| oq ^q q^ hN o) oq oo oo CO CO CO CO CO CO CO CO CO CO CO CO CO CO CO CO CO CO CO CO CO CO CO ioin iqio ^ oqq inoq inco r^in >•cq ^ ^ cqcn a>(o cn«5 cicria)C75C7)cdcdt^iocM^c^odt^^(ouSTj*^coco co;£coo^^~i^OThcococococ»cT>Oi»-«cNC>^cNr>» q q q q O)q q q (n n ^ ^ q q q q q w eon ^ icin ^ •* rh ^ ^ eoco rh rh ^ ^' ^ ^ in ^ ^'Th in in in in "^'^' oc oc oc oc oc oc oc oc .c co co co co co co co co co co co co co oc o c^coqqq(DNC7)^oqNcoininin-oqcoocotDcNN cioio^c^oicdcdt^incsi^aJoo'i^^^Th^^cocococN CD oo cn co rN rN cn tN OO '-'r NT hi o^ ow oi co ^c NO tDin io o^ Nc ^( oq qq -| ^' iN cv co jq ^o ^G ^q ic ff rh r^*r^' Thrh tJ^*rh in rh t^ ^ Tht^ TjJ^' t}Jrh rjJrh ^ Th^ Th co co co co co co co co co co co co co co co co co co co co co co co cqcqcqr>»cocqcoo} —; w w cq co ^ ^ i^#w coco q cq cor»4CnrOOC0C0slCDCn.4^4^C003N3IsDt— •— h-OO OO OO OO Cn OC nO Cn OC nC OO sJ Cn CO hO H-OO OO OO OO OO OO OO OO OO OO OO O N3W W W ^ ^ OnC^ O^^ CO p h-CO ^ W W siiosjcoKob^^losicnc^^c7>cn4^is3cosj^K^ ^tH^ O fl> ._ -r-1 p p CO© 5 CO OS CA CA MO SC dU lC OU OO UO SU UO OU Cd UO SU OS CO 4^ 4^ i4 ^4 ^4 ^4 xi 4x 4^ o0 O3 4^ 4^ 4^ 4^ 4^ 4^ 4^ 4^ 4^ 4^ -4 ^» 4^ 4: k' bi w ^ ^ w ka ^ b b lo b b b ^ ^ lb co b lo 'vj a co a QMC^^W^WO0COCOWNlCOvlhOhOCOCOOaCT>K)N3O3 OS 4^ o N3CO W ^ ^ j^Oi Oivl N COCO ^-Oi 00CO COCO p COCO COCO n w b b "^ b l^ b "^ b l^ b 1^ b ^ w w b io lo lo b n ^H .QB *T3 aq * CO •— ^ co ro ^-CO VI5 OOOO CO2 co^PlH ^"sIOl1-^"^ rJ>* cn ." ." ^< OO i t1 U03COCOCOCOCOC00903COUICOCOCOCOCOCOCOCOCOCOU) l^ w 1^ ^ w m ^-m m b b b b w b b b lo b ^j ^j sisi sJ C0 00 CO Ti ^C ^O N0 0M 3h )N O0 05 Oi CD OW 0) N0 sj 03 NW Nb wb bb lo -b bb bN sb ws jb ib bs jv j OaUOSCOCOCOCOCOUCOCOCOCOCACOCOCACOCOODCOCOCO ^ jjx^ ^ f ^ ^ _^U W W ^ W W ^ 4^^ 4^ ^ ^ ^ f ^ Inln^^ooio^ococoloococo^c^lnlnailnVNONs NNJOiMOisJCDOCOslCOMOOCOCO^COOislH-'-K) aq t~*. _ ft-3COO i o P 4*^°
si
1
OO OO OO OO OO OO OO OO OO OO OO O [OCO CO ^ ^ 4^ ^ c^ Q ^ a CO O |C C^sj Nj CO CO CO CO CO CO sjlo a b b l^b sjl^ ^ lol^ vjfo b sjco fo^ b lolo w COC0 03COUCOCOCOCOCOCOCOCOCOC4COC003COCOCOCOCO In In ^ w lo lo b b b b b I-b b b sj M b sj b b b b OC >- OO OC lC OO )C is WO nO MC CO OO OO OO CO ai N3 sl O JO CO OD CO 4^ 4^Oi CDsj CO CO © NO Cn COCO CO00 CO CO CO CO CO sjcosjloKoa^Ka^oo^ln^^cncricoco^si^j^jco bf os jb Ko ln bb Ko bi ol ol ji ai bb ^l oN ib ^^ lo W0 5C OW WW WC OW WW 03 WW WW WW WW OD WW ^ ^ ^ ^ ^ 4^ 4^ ^ CO CO ^ ^ 4^ CO ^ ^ ^ ^ 4^ In ln ^^ WM ^b bb bb bb bl nl n^ ^l nl nl nb CO CO Cn CO ft OC »- N3 Cn nO -C O» OO -C Oi ih ^O iO MO sj NJ o O SB So p s ? r CO •— CONDC" h-COcoo ftbb ^2 o n SI £Lo p d • r <* CO _-£3" OONO J? -COsJCOO 0• o o h rCog^CO K* CD. " . " co>— £2 o n> SB B-2 £ crq CO — p COND C". COO) coo ^2 p cr o o cr. p c t p IS .p" s: 3 p a p oOi hO OC OC Os 4C nO iA ^C OC Ol sO lv 3h -i -N -OO OO OO OO Cn OC nO Cn OC nC OO si Cn CO ND ^ OO OO OO OO OO OO OO OO OO OO OO O NDOOOO^^^CnCn^CDslCOCO^^CTJCDCDs^ sj bs jb fo bb ln bl ^w b^ fo bK ob bb lo bl ol o co oo co oo oo co co co co co co oo co co co co co co oo co co co co ^4 x4 x4 x4 x4 x4 x4 x4 x4 x0 00 00 00 00 04 ^4 ^4 ^ 4^ 00004^ 4^ In In4* *4>CO CONO ^-O O COCO 00CD CO^-*•— *•— O CO00 O O sJCOCO^CONDK3N3slK)COOOsJCOCOsJCDOCO^COCON3 N0COCO4^4^4^4^CnCnCDCDsic»pND4^CnCna>si^^ s^ w w b lo l^ b ^ sj lo b b b '*•b bo ^j sj lo 'h-'^ b vi COCOCOCOCOCOCOCOCOCOOOCOCOCOCOCOCOCOCOCOCOCOCO 4^ 4^ 4^ 4^ 4^ 4^ 4^ 4^ 4x 4^ 03 00 00 00 09 00 00 00 00 00000000 lnln4^4*loNO^^OOCOcbcbsibilxcocT>a>cDc^ sl Ms IO Ds lC OO O-CT lO sl CO O^ sJ ^O CO sl CC CO O' -N3od cow 4^4^ 4^c^ c^p p sjp p ^ 4^Cn Cnp p p p p sjb sjb iob b Inb fob b b sjb 4^'oo b h-*sj b *co b O0O0O0O3O3O9O0O0O3COCOO0O9O0O0O9O0O0O0O0O0O0CO 4x 4x 4x 4x 4x 4x 4x 4x 4x 4x 4x 00 4* 00 00 00 4^ 00 00 00 00 00 00 lnln4^4^loloN0^-—b b b b b In b b sJb b 4»-lo lo N) vO OI -C ^h sj CO CO CO Oi OO OC >' -4 ^^ )4 OK OC lC Ws sJ >d o fo 03 £-2 S. aq co 1-p NDCO £• ' CD. %. N O Cn 03£-§ & qq """? * co _ S" NDOD~-h-COO° t/>-"0 OP cogS^ CjOCO CD. " . " ^1 Cn VS5 -He, o o _ _ 03&§ ^3 00 rr £B. ^ P Ll°!°° 22 tn NO OC OC Ov JC ^C n* '4 i> CO CO ND Is 3^ '-- si OO nO OC Cn nO OC Cn OO OO OO OO cn CO NO H-OO OO OO OO OO OO OO OO OO OO OO O NO CO CO 4x 4x 4x Oi CnCD CD si CO CO ^— CnCD CD si 00 sj CO 00 CO sj bs jb wb bb bb Nb bb bb bs jb bl nl nb COO0O0O0O0O0O0O0O0O0O0O3COCOO0O9O3O3COO3O0O3O0 4x 4x 4x 4x 4^ 4x 4x 4x 4x 4x 00 4^ 00 00 4^ 4^ 4^ 4^ 4^ 4^ 4^ 4^ 4^ MCOCO4^4^4^C^C^CTipMC0C0^-W41-ppPfSjsjpp b 4^ b N34^ b fo b ^ sj lo b sj b w b 4^ In b b sj b 4^ O0O0O0O0O9O3O0COCOO9O0OSO0O0O0COO0COO0O0O0COO0 4X4x 4x ^x 4x ^x 4x 4x 4x ^x 00 4^ poCO 4^ 4^ 4* 4* #4=» 4* 4* j^ j^ b In *• 4^w loki *h-b b b b b b b no'no oo oo oo W4^COC7^COhONOOCT>COOOOCOCON004^COsjCjiNOOO NO pW ^^ ^^ pp ps jp CO OW ^p pv ls jp pp CO 4^ CO'^-OO CD CO sj NO si In CO In si In CO OO CD CO CO*•--CO OO COCOO0O0ODODO0O0COCOO0O0O0O0COCOO0COCOCOCOO3CO 4x4x4x4x4x4x4x4x4x4x00004^0000004^4^ 4^ 4^000003 b In 4^4^ lolo '^-b b b b b b b b b ^-b ^-b b b bsj Nj sj Gl CO sj n^ ^C NJ CO jC -s Ot OC OC OC CO JW Js lK ff 0a OB ~g £ qq* ? CO !— P O0ND~- _-NONO CO2 ?v cd. v. x 00 < £2 03 ~g S. OOCO jr NOOOg o o P §cog£ o CD _. _ _ S3 ~g £ Cjq ^"P ' CO *_ P oo00 £• 0° NO0 o o 3 TT 1—1 ^ •— CO v3 5^ <r r CO P-: ^NOCO^ 00 CO O o 0 c. p 2 H tr p eg o »i $-I *•* p
CnNDOC0C0sJCDCn4*-4*C003NDN0>— •-**-. OO OO OO OO Cn OC nO Cn OC nC OO sl Cn CO NO ^— OO OO OO OO OO OO OO OO OO OO OO O W W ^ f 4^ UiC^ OiC^ ffi si v) OOCO O ^ m M 4^ ^ C^Cfl Oi b In b lo b b 4>> b lo b 'h-b ^-b In '»-b b w b 'h-b b CnCn4^4^4^COCO^-NONO^-OCOCOCDCnCONO>— NONONONO ic ^s 04 OC 00 si c0 si OO DO OC CD nO JC 's »- CD nc nC ns i i^ ^r 03 V dq CO Jv3OO
&' NOg COCO
O O O0 UOOON3 coond*^ -sj . * . *
•IS
CO ^P CnNOOCOCOsICDCn4^4i-COCONONO^— — — OO OO OO OO Cn OC nO Cn OC nc oO si cn co NO ^-oo oo oo oo oo oo oo oo oo oo oo o NOCOW^^C^ppppsjvjp^p^W^^pCTiCTiC^ sj w b ^-b b 4^b b vi jo b 4^b b b b fo b b b b b O0O0O0O0O9O3O0O9O0O0O3O0O0O9O0COCOO3O3O0O0O0CO 4x4x4x4x4x4x4x^^4x4x4x0000000000000000030000 klkifc^^w^^^^obbbwwfobwKolololo C0N0C04^^-CDCDC04^^-sIO0N0O0Cn^-CDO --— — — CD CD CD CO • NO CO OO sj to vj 4^4^4^CncyiCnOiCDsjC0C0^^C04x4xoiCnCDCD b iob '^-b b b b b w —'— b b b b vj b b '•-)COO3O0O3O3O3O0O0O0O0O0O0O0O3O3O0O3O3O3CO .4X4X4X4X4X4X4X4X000303030303030303030303 b3WNO"^^OOCOCOsl4xlofo03Nofoiot-*^-^IOsl4xOsI^-.COCDCONOOCON04^COCnNONO It N0COCOCO4^4^CnCnCnCDCDsi^cO#COp^N0CO4^CnCnCn sjb M b nob •-N ^j b b b b b b b b b b b b sjb COO3O3O3O0O3O3O3O3O3O3O3O3O3O3O3O3O3O3O3O3O3O3 4x4x4x4x4x4x4x4x4x4x4x030303030303030303030303 b b 4^4^ *4>w noio h-b b b b b 4^h. b b b b b h-m sIhOCOCnOCOsI030C7^NOCOCnNONOCOCD^-CDCDCnO>--03 ~§ S qq* *~"? £ NOCO? <^~g oioS NO4^ ^ £2 CO-^S-'CD S3.~§ [ . .p _-1 5."CD-J -< O -He, o fD , S3 CO so St -5' dnJO cdO b 2 2 S. p r* qq CO — 2" OOK CONO O^NOg H p cr O o 3 5" c CD re 3 •n p n IS ST 3 p C B. < < 0Table 2. Occurrence of:zooplankton at each collecting station. Date Station No. Latitude Longitude Jun. 27°. 147°-, 1147°-, 1976 1 -26'.ON -07 '.2W Jun. 2, 1976 2 27°-47'.5N 145°-37'.4W Jun. 3, 1976 3 28°-22'.2N 144°-ir.2W Jun. 4, 1976 4 28°-40'.0N 142°-31/.8W Jun. 5, 1976 5 28°-48'.8N 141°-0r.8W Radiolaria 19 17 78 31 60 Ceratium 56 59 119 75 156 Chaetognatha Polychaeta Ostracoda 2 1 1 1 1 4 3 1 1 1 1 2 4 1 Copepoda Appendicularia Thaliacea 895 74 5 481 66 2 832 111 1 393 34 2 764 68 4 Unidentified Organisms Foraminifera 53 1 30 26 11 17 Total 1106 662 1172 548 1076 Date Station No. Latitude Longitude Jun 29° 139° . 6, 1976 6 -22'.6N -34'.2W Jun. 11, 1976 7 29°-23,.9N 138°-05'.0W Jul. 3, 1976 8 28°-ir.lN 137°-0r.3W Jul. 3, 1976 9 28°-25'.7N 136°-02/.7W Jul. 3, 1976 10 28°-46'.lN 134°-59,.8W Radiolaria 50 17 16 31 25 Ceratium 96 138 122 312 224 Chaetognatha Polychaeta Ostracoda 1 1 1 1 1 1 6 1 2 4 3 2 4 4 Copepoda Appendicularia Thaliacea 692 79 2 352 34 2 455 68 5 667 106 6 715 96 5 Unidentified Organisms Foraminifera 1 17 4 16 19 1 20 Total 939 550 690 1150 1096 Date Station No. Latitude Longitude Jul. 3, 1976 11 29°-05'.0N 133°-57'.0W Jul. 2, 1976 Jul. 2, 1976 12 13 29°-24'.0N 29°-44,.0N 133°-00'.0W 132°-00/.0W Jul. 2, 1976 14 30°-03'.5N 130°-58'.5W Jul. 2, 1976 15 30°-18'.8N 130°-02'.3W Radiolaria 29 28 20 20 34 Ceratium 133 155 227 104 318 Chaetognatha Polychaeta Ostracoda 2 2 14 1 2 7 1 1 4 4 1 3 4 1 5 Copepoda Appendicularia Thaliacea 649 92 8 661 39 5 759 47 2 299 27 1 731 83 1 Unidentified Organisms Foraminifera 2 4 1 12 14 1 8 29 Total 935 911 1075 468 1206
Mem. Fac. Fish., Kagoshima Univ. Vol. 26 (1977)
Table 2. (Continued)
Date Jul. 2, 1976 Jul. 1, 1976 Jul. 1, 1976 Jul. 1, 1976 Jul. 1, 1976
Station No. 16 17 18 19 20
Latitude 30°-37,.0N 30°-58'.7N 31°-16'.0N 31o-34'.0N 31°-56'.on
Longitude 129°-05'.5W 128°-00,.5W 127°-00'.0W 126°-02'.0W 125°-01 '.0W Radiolaria 25 Ceratium 173 Chaetognatha 4 Polychaeta 2 Ostracoda 11 Copepoda 683 " Appendicularia 49 Thaliacea 2 Unidentified Organisms Foraminifera 8 Total 957 24 234 3 5 2 553 25 7 853 26 584 2 1 8 356 28 1 11 1017
Date Jun. 30, 1976 Jun. 30, 1976
Station No. 21 22 Latitude 32°-14'.2N 32°-32,.0N Longitude 124°-0r.4W 123°-00'.0W Radiolaria 29 28 Ceratium 119 32 Chaetognatha 10 11 Polychaeta 9 7 Ostracoda 3 4 Copepoda 1268 732 Appendicularia 39 121 Thaliacea 13 14 Unidentified Organisms Foraminifera 6 16 Total 1496 965 20 418 5 10 9 921 60 4 15 1462 10 182 2 4 812 1 25 1039