The Use of Translucent Skin Mutants of the Silkworm "o06" Strain as a Model of Hyperuricemia Based on Analysis of Uric Acid Metabolism
12
0
0
全文
(2) Tanaka et al., The Use and Metabolism of the "o06" Strain-Silkworm as a Model of Hyperuricemia, AATEX 25(1), 1-12, 2020. and mice [mice excrete allantoin in the urine because they have a uricase (UA oxidase)], the high cost of maintaining experimental mice, and ethical issues involving the use of mice and rats (which has been regulated by law in the European Union since March 2013). Therefore, a new hyperuricemia model is needed for medical studies. Silkworms normally produce UA during nucleic acid metabolism and store it in epidermal cells for use after the pupal stage. Mutant “Aburako” silkworms have a decreased ability to store UA in the epidermis. It then builds up in the hemolymph and causes the skin of the mutants to become translucent (Komoto and Tamura, 2011). Here, we discuss the o06 strain as a possible substitute for the mouse hyperuricemia model in medical studies. We also hope to develop a UA assay that allows the use of microliter volumes of hemolymph.. chromatography (HPLC) system consisted of a PU-2080 plus pump (JASCO), CO-U620 column oven (JASCO), UV-2075 plus and UV-4075 detectors (JASCO), and a model C-R-8A integrator (Shimadzu, Kyoto, Japan). A photodiode array (PDA) was used to detect when an impurity was present in the peak analysis of the HPLC; this was facilitated with an MD-2010 detector (JASCO) with ChromNAV software (JASCO). HPLC analysis of UA and related compounds We used reverse-phase HPLC to quantify purine-pyrimidine metabolites and AP in plasma samples. The wavelength used by the HPLC-UV detector was determined from the spectra (200–300 nm, in H2O, at 25°C) of AP, UA, Hyp, Xan, and Alla (λmax 252, 284, 248, 269, and 200 nm, respectively). All standard aqueous solutions of UA and related compounds were prepared using reagent-grade chemicals in a vacuum drier at room temperature (for at least 48 h) and a standard UA solution (10 mg/dL) as needed. For HPLC and the stability test (temporal course) of the aqueous UA solution, we used a mixed test solution (AP, Hyp, Xan, and UA at 0.7, 0.8, 1.6, 0.6, and 1.7 mg/dL, respectively). Each peak of interest was quantified based on its area; under the acidic conditions of the mobile phase (ca. pH 2.0), the effect of column conditions (temperature, etc.) on peak area and height was negligible (Committee on Biochemical Constituents and Their Analytical Reagents, 1993; Japan Society of Clinical Chemistry, 2012). We determined that optimal separation (theoretical plates and durability performance) would be achieved using a COSMOSIL C18 AR-II column (Nacalai Tesque) and elution with an aqueous phosphoric acid solution (30 mmol/L, pH 1.8).. Materials and Methods Silkworm strains Bombyx mori L. (Lepidoptera: Bombycidae) were raised at 23 ± 3°C with 40–70% humidity and fed fresh mulberries until they were used in our experiment. The silkworms used in our experiment were all from the 3rd to 6th day of the fifth instar. The UA content was measured in the o06 strain (translucent skin larvae; from the National BioResource Project, Silkworm-center; Kyushu University) and Gunma200 strain (normal larvae; from the Gunma Sericultural Technology Center). Chemicals and instruments Allantoin (Alla), allopurinol (AP), hypoxanthine (Hyp), OX, xanthine (Xan), and UA were obtained from Wako Pure Chemical Industries (Osaka, Japan). A standard UA solution (10 mg/dL, Uric Acid-TEST WAKO) was calibrated using National Institute of Standards and Technology SRM913a. The hyperuricemia medications Feburic® and Uriadec® were prescription drugs. Xanthine oxidase (XO; extracted from buttermilk) was purchased from Calbiochem (EMD Biosciences, Darmstadt, Germany). Uricase from yeast was obtained from Oriental Yeast (Tokyo, Japan). Enzymatic reactions were conducted in a Water Bath Incubator BT-100 (Yamato, Tokyo, Japan). The ultraviolet and visible absorption (UV-VIS) spectra of oxypurines and plasma samples were measured using a spectrometer (V-730; JASCO, Tokyo, Japan). The high-performance liquid. Preparation of the calibration curve of UA and Xan Standard UA (0, 1.25, 2.5, and 5.0 mg/dL) solutions were prepared using reagent-grade chemicals at the time of use. Each (3 µL) solution was subjected to HPLC under the aforementioned conditions. The automatic peak area counts (C-R-8A) for each peak of interest were plotted against concentration (mg/dL) to generate a calibration curve. The areas of the peaks in the chromatogram were compared with the amount of UA or Xan injected. Each dose was determined using four or five independent samples, and each result is shown as a. 2.
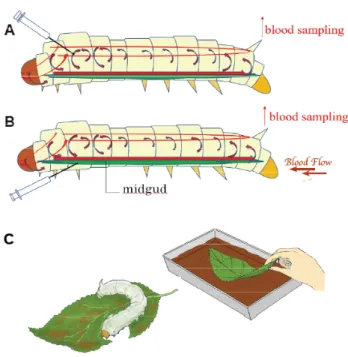
(3) Tanaka et al., The Use and Metabolism of the "o06" Strain-Silkworm as a Model of Hyperuricemia, AATEX 25(1), 1-12, 2020. from the tail edge 2 h after the treatment. Treated hemolymph was prepared immediately and stored at −40°C until further analysis. (A) The subcutaneous administration in the silkworm experiment is a so-called pseudo-intravenous administration (Hamamoto et al. 2014). In this study, 40 μL of sample was subcutaneously (in hemolymph with no XO present) administered with a 29-gauge syringe along the bloodstream from both sides of the third segment of the thorax (Figure 1-A). (B) Intra-intestinal administration (pseudo-oral administration, Hamamoto et al. 2014), the test sample was administered from the third segment of the thorax into the midgut where the XO was located (Figure 1-B). (C) Silkworms (o06-5th instar, 4 days~) were given fresh mulberry leaves (Morus alba) previously soaked in the sample to imitate non-invasive oral administration (Figure 1-C).. scatterplot. The determination coefficients for UA and Xan were 0.999 and 0.996. HPLC analysis of Alla using hydrophilic interaction chromatography (HILIC) We used HILIC-HPLC to quantify the Alla metabolites in hemolymph and fecal samples. The wavelengths (210 and 280 nm) used by the HPLC-UV detector (UV-4075; JASCO) were determined from the spectrum of Alla. Three standard aqueous solutions of Alla (1.25, 2.5, and 5.0 mg/dL) were prepared using reagent-grade chemicals in a vacuum drier at room temperature (for at least 48 h) as needed. Each peak of interest was quantified based on its area; the effects of column conditions (temperature, etc.) on peak area and height were negligible (Committee on Biochemical Constituents and Their Analytical Reagents, 1993; Japan Society of Clinical Chemistry, 2012). We determined that optimal separation (theoretical plates and durability performance) was achieved using a 4.6 × 250 mm HILIC column (Nacalai Tesque) and elution with an aqueous CH3COONH4 (50 mmol/L) and CH3CN solution (15:85, v/v, pH 7.9). The Alla in hemolymph samples was detected by HPLC at 210 nm. The standard conditions were as follows: injection volume, 3 µL; column oven temperature, 35°C; flow rate, 2.5 mL/min; range, 0.02, and tR 1.7. Preparing the allantoin calibration curve Standard Alla (0, 1.25, 2.5, and 5 mg/dL) solutions were prepared using reagent-grade chemicals at the time of use. Each (3 µL) solution was subjected to HPLC under the aforementioned conditions. As mentioned above, the areas of the peaks (tR 2.5 min) in the chromatogram were compared with the amount of Alla injected. The determination coefficient (r value) for Alla was 0.996. Silkworm model of hyperuricemia and various administration methods Alla and UA were measured in o06 strain hemolymph samples (3- to 6-day-old 5th instars). All silkworms were treated and kept in a room maintained at 23°C ± 3°C with 40–70% humidity. The silkworms were fed common mulberries ad libitum. The positive controls were treated with pseudo-intravenously (subcutaneous administration) administered 50 mg/kg AP (7.5 × 10⁻² mg/silkworm) and 10 μL of silkworm hemolymph (blood) was collected. Figure 1 Various administration methods of silkworm model of hyperuricemia (A) The subcutaneous administration in the silkworm experiment is a so-called pseudo-intravenous administration (Hamamoto et al. 2014). (B) Intra-intestinal administration (pseudo-oral administration, Hamamoto et al. 2014). (C) Silkworms (o06-5th instar, 4 days) were given fresh mulberry leaves (Morus alba) to imitate non-invasive oral administration.. 3.
(4) Tanaka et al., The Use and Metabolism of the "o06" Strain-Silkworm as a Model of Hyperuricemia, AATEX 25(1), 1-12, 2020. Hemolymph preparation We performed deproteinization using the chloroform–methanol method. First, 10 μL of fresh silkworm hemolymph was placed in the sample reservoir of a Cosmospin Filter G spin filter (pore size of 0.2 µm, Nacalai Tesque) with 100 μL of methanol, 100 μL of chloroform, and 90 μL of H2O and the solution was then sonicated. The filters were centrifuged at 10,000 rpm for 20 min (for mouse plasma, this takes 60 min) to collect the aggregated protein. The filtrate was lyophilized (MicroVac MV-100; TOMY Seiko, Tokyo, Japan) for 90 min. Dried residue was dissolved in 15 μL H2O. The solution (3 µL) was injected into the HPLC instrument and analyzed immediately in triplicate.. Analysis for gross weight of UA excreted in feces For 24 hours, fresh feces were collected from 10 normally reared, fasted silkworms in each group. Pretreatment and extraction of feces followed the method of Eguchi (1961). Larval urine was collected from silkworms (n = 10) reared in a breeding box lined with filter paper, the urine content of which was subsequently analyzed. The urine absorbed on the filter paper was extracted with water (150 mL) at 40°C for 10 minutes, and the residue obtained after filtration under reduced pressure was analyzed. Three replicates were performed. Alla and UA levels in hemolymph samples from 5th instar o06 strain silkworms Alla and UA were measured in hemolymph samples from 5th instar o06 strain silkworms (3–6 days old) given leave treated with Milli-Q or Feburic®. The UA content was analyzed using HPLC-UV (C18 AR-II) or HILIC, and the amount of Alla was determined using HILIC.. Identification of UA in the silkworm hemolymph UA and Xan were identified in the silkworm hemolymph using conventional methods (Hiroshige et.al, 1992 and 1994). Briefly, XO (0.084 U, 10 μL), uricase (UC, 0.075 U, 5 μL), or water was added to pooled hemolymph samples obtained from untreated silkworms (10 µL per head) and incubated for 60 min at 38°C. These samples were filtered (as described below) before HPLC-UV analysis. To provide a method for analyzing the impurity of the pooled hemolymph samples, we used a PDA when detecting an impurity and applied this to the HPLC analysis (199–331 nm) under the same column and the same conditions.. Comparison of hemolymph UA levels between treatment groups Silkworm were provided with leaves soaked in Chamomilla phenylpropanol glucoside (CPPG) solution (evaluation), Feburic® suspension (treatment), or Milli-Q water (control). HPLC assays were performed in triplicate and average values were calculated. Calibration curves for CPPG and Febuxostat CPPG is a novel phenylpropanoid obtained from Matricaria chamomilla L that exhibits XO inhibitory activity and hypouricemic effects (Tanaka et al., 2019). CPPG was applied to both sides of pre-weighed fresh mulberry leaves, which were then rinsed with ethanol and dried under reduced pressure. The residue was then collected (sample weight). For Febuxostat, the sample weight was multiplied by the ratio between the active component and total solution (10.00 mg: 1.32 × 10² mg), and the value was plotted. The determination coefficient (r-value) was 0.939 for CPPG [y(Amount of CPPG; mg) = 0.1851 x(Weight of fresh mulberry leaves; g)] and 0.995 for Febuxostat [y(Amount of Febuxostat; mg)= 4.843 x(Weight of fresh mulberry leaves; g)]]. Fresh mulberry leaves were randomly selected for the analysis.. UA levels in hemolymph samples from 5th instar mutants treated with allopurinol, Feburic® and Uriadec® The hemolymph samples (n=10 or 9 untreated, 15 treated) were analyzed by HPLC at 280 nm under the same conditions (three times per sample), with standard HPLC settings. The drugs (Allopurinol, Feburic® and Uriadec®) were each dissolved in normal saline and the insects were given the lowest dose (mg/kg) in human treatment. 0.5 mL of Feburic® solution (10 mg → 10 mL) was added to 99.5 mL of water (W) and saline solution (S; 0.85% (w/v) NaCl/water), and a 40 μL sample volume was administered. Uriadec® solution (20 mg → 10 mL) was added to 99.5 mL of W and S, and 40 μL was administered.. 4.
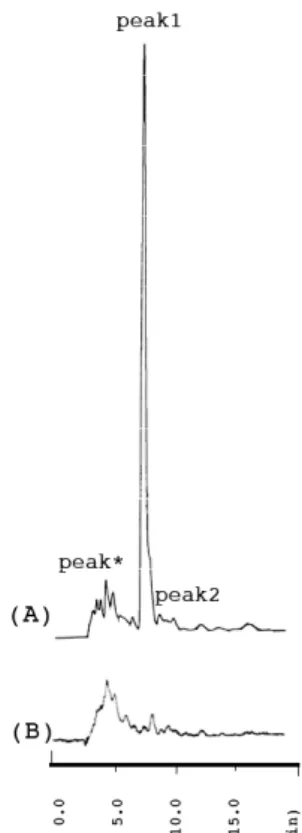
(5) Tanaka et al., The Use and Metabolism of the "o06" Strain-Silkworm as a Model of Hyperuricemia, AATEX 25(1), 1-12, 2020. Results Identification of the peak of UA in the chromatogram To identify the UA peak by HPLC, samples were subjected to an enzymatic treatment (Figure 2). A uricase treatment diminished the UA peak, whereas XO treatment did not, confirming that the peak can be attributed to UA. No unknown peaks were seen in the region from which the UA peak was absent, confirming that the latter does not overlap any other compounds and that the peak area represents the quantity of UA. Using the same conditions, it is possible to determine UA, Xan, AP, and oxypurine (OP) levels simultaneously, but not Hyp, in silkworm hemolymph samples.. Determination of the CPPG and Febuxostat doses Four silkworms were given 30.00 g of fresh mulberry leaves soaked with CPPG or Febuxostat, and the amount of leaves ingested in 24 hours was calculated. The weight of leaves ingested by one silkworm was calculated using equations (1) and (2): (1) DOSE CPPG = 0.1851 Wleaf 4Wsilkworm (CPPG group) (2) DOSE Febuxostat = 4.843 Wleaf 4Wsilkworm (Febuxostat group). (CPPG group). /. (Febuxostat group). /. Where DOSE (mg/kg) is the weight of fresh mulberry leaves ingested by a given silkworm, Wleaf (mg) is the weight of leaves ingested by all silkworms in a given treatment group within 24 hours, Wsilkworm (kg) is the average silkworm weight ( CPPG group, 1.12 × 10⁻³ kg; Febuxostat group, 1.11 × 10⁻³ kg). Wleaf was calculated using equation (3): (3) Wleaf (g) = W’leaf (30.00 / 21.35) Where W’leaf (g) is the weight of dry mulberry leaves ingested by all silkworms in a given treatment group within 24 hours. The weight after residual solution and feces adhering to the remaining dry mulberry leaves had been washed away with water (21.35 − W’leaf) was 5.35 g in the CPPG group and 2.33 g in the Febuxostat group; the respective DOSE values were 311 mg/kg/day and 3.57 × 10³ mg/kg/day. Statistical analysis The HPLC assays were performed in triplicate and average values were calculated. All animal experiments used 8–17 silkworms or 4–10 mice, and the data are presented as means ± standard deviation (SD) (Uemoto, 2010; Miller, 1991). Differences in means between the control and treatment groups were analyzed using one-way analysis of variance and Student’s t-test with Bonferroni’s correction. A P-value of < 0.05 was deemed to indicate statistical significance. The statistical analyses were done with OriginPro9.1J (OriginLab, Northampton, MA, USA) and IBM SPSS Statistics 20 (IBM, Armonk, NY, USA).. Figure 2 dentification of uric acid in silkworm hemolymph samples by HPLC The following hemolymph samples were examined by HPLC at 280 nm under the same conditions (n = 2 per group). (A) Pooled hemolymph from control (non-treated) silkworms (5th instar, Gunma200). (B) Pooled hemolymph samples treated with Xan and UA oxidase. Peak*, hypoxanthine and unknown compounds overlapped; Peak1, uric acid (tR 7.3 min); Peak 2, xanthine (tR 9.1 min). Common conditions: COSMOSIL 5C18-AR-II 4.6 × 250-mm column, injection volume 3 µL, temperature 30°C, mobile phase 30 mmol/L aqueous phosphoric acid solution, range 0.02, attenuation 1.. 5.
(6) Tanaka et al., The Use and Metabolism of the "o06" Strain-Silkworm as a Model of Hyperuricemia, AATEX 25(1), 1-12, 2020. Therefore, our findings indicate that the high-sensitivity HPLC-UV method provided adequate quantification with little variation. The best HPLC conditions for OP involved a combination of a polymeric high-carbonized ODS column and aqueous phosphoric acid solution. The durability of the column was confirmed by our findings, indicating the effectiveness of chloroform-methyl alcohol for the deproteinization of silkworm hemolymph. Avoidance of the use of acid during pre-processing resulted in no decline in precision due to column destabilization by remnant acid. This improved method can be adapted to the general screening of silkworm hemolymph UA levels. As the Xan level in the hemolymph of the mutants increased, the disappearance of UA was shown by uricase treatments on the peak of the chromatogram. The purity of the UA peak (tR 7.8) in the. chromatogram was confirmed with this procedure. That of the hemolymph of the mutants produced a simpler chromatogram than that of the mouse, as shown in Figure 3, and the peak purities of UA and Xan were confirmed with a PDA-HPLC analysis of the mutant hemolymph and the mouse plasma. Spiking experiments The recovery rates of UA added to a 10μL pooled plasma sample from normal mice were 102.9% ± 13.2% and 97.8% ± 16.6% (addition of 2 and 1.4 mg/dL UA, n = 4 and 6, respectively) (data shown in Tanaka et al., 2013). By contrast, the recovery of UA added to 10 μL pooled silkworm hemolymph samples from untreated silkworms was 103.1% ± 3.4% (adding 2.29 mg/dL, n = 4, Figure 4). This is consistent with the method of Hiroshige et.al, (1992, 1994) and confirms that the quantity,. Figure 3 PDA-HPLC analysis of UA in silkworm hemolymph (A) and mouse plasma (B) samples The following samples were examined by PDA to analyze impurities in the pooled hemolymph samples using a PDA (JASCO MD-2010 Plus) in HPLC analysis (199–331nm) under the same conditions and ChromNAV. (A) Pooled hemolymph (deproteinization) from non-treated silkworm (o06 strain, 5th instar, 4 days). (B) Pooled plasma obtained from the mouse model of hyperuricemia, 8-week-old male ICR mice were intraperitoneally (i.p.) administered potassium oxonate. The elution of HPLC was evaluated using the absorbances at 280 nm and 250 nm.. Figure 4 UA recovery rate* of pooled hemolymph samples The following pooled hemolymph samples were examined by HPLC at 280 nm under the same treatment and conditions (n = 3, per group). A: Pooled hemolymph (deproteinization) from non-treated translucent larval skin mutants “o06, 5th-instar, 6 days” (10 µL) and H2O (10 µL). B: The pooled hemolymph (10 µL) and standard UA water solution (2.286 mg/dL, 10 µL). * UA recovery rate (%): (B – A) / 2.286. 6.
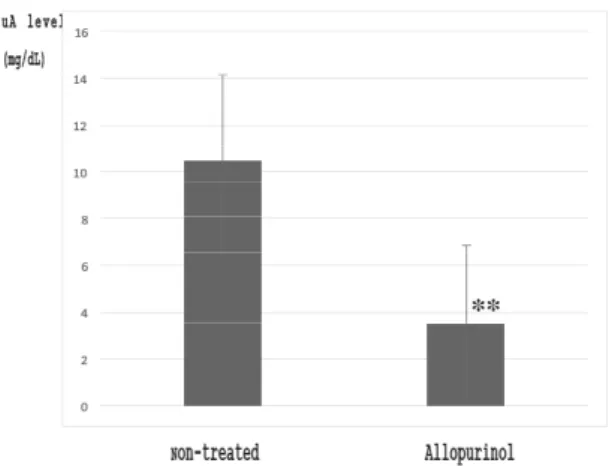
(7) Tanaka et al., The Use and Metabolism of the "o06" Strain-Silkworm as a Model of Hyperuricemia, AATEX 25(1), 1-12, 2020. reproducibility, and stability of UA remain unchanged in the silkworm hemolymph. The ratio of the amount of UA recovered (with results presented as means ± SD) from the pooled hemolymph samples was better than that recovered from the pooled mouse plasma. The high level of utility of the UA-level model animals is reflected in the results from the silkworm mutants. The growth and development of the silkworm are influenced by rearing condition such as temperature, humidity and. nutirition so on. However, the hemolymph UA level of the mutant o06 was ca, five higher that of the normal silkworm Gunma 200 (Figure 5). This result shows that the mutant o06 is good model for this study. Allopurinol (subcutaneous injection) caused the hemolymph UA level to decrease significantly in the mutants (5th instar, Figure 6). The hemolymph UA level of the 5th instar mutants tended to increase with days elapsed (Figure 7) and body weight (data not. Figure 5 Comparison of hemolymph UA levels in 5th instar silkworms of different strains A: Normal (Gunma 200) strain (n = 12), B: Mutant (o06) strain (n = 10) Strain o06 was evaluated during four different rearing seasons (No. 1–No. 4). The hemolymph samples were analyzed by HPLC at 280 nm under the same conditions (three times per sample). No. 1, 2014. 5- o06 strain, 4 days; No. 2, 2014. 12-o06 strain, 4 days; No. 3, 2015. 10-o06 strain, 4 days; and No. 4, 2015. 11-o06 strain, 6 days.. Figure 7 UA levels of hemolymph samples from non-treated 5th instar (o06) mutants of different days of age. The hemolymph samples (2 days, n = 12; 3 days, n = 34; and 7 days, n = 19) were analyzed by HPLC at 280 nm under the same treatment and conditions (three times per sample). Common conditions: COSMOSIL 5C18-AR-II 4.6 × 250-mm column, injection volume 3 µL, temperature 30°C, mobile phase 30 mmol/L aqueous phosphoric acid solution, range 0.02, attenuation 1, uric acid (tR 7.3 min), xanthine (tR 9.1 min). (** p < 0.001, Student’s t-test with Bonferroni’s correction). Figure 6 UA level of hemolymph samples from 5th instar (6-day) mutants treated with allopurinol (subcutaneously administered). The hemolymph samples (non-treated, n = 9; treated, n = 15) were analyzed by HPLC at 280 nm under the same treatment and conditions (three times per sample). (** p < 0.001 Student’s t-test with Bonferroni’s correction). 7.
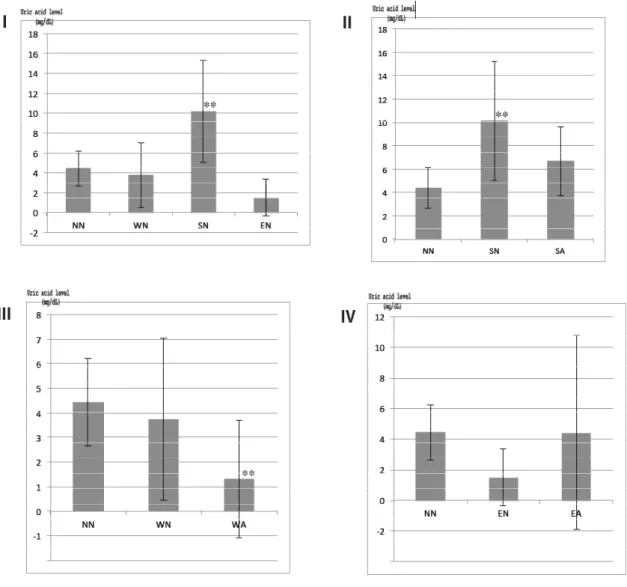
(8) Tanaka et al., The Use and Metabolism of the "o06" Strain-Silkworm as a Model of Hyperuricemia, AATEX 25(1), 1-12, 2020. shown). Both weight and UA levels in the hemolymph decreased again after larval urine excretion in the ripened 5th instar larvae. The insects were injected with a normal saline and a physiological Ephrussi–Beadle salt solution (NaCl 0.75 g/dL, KCl 0.035 g/dL, CaCl2 0.021g/dL). The UA level rose with the normal saline injections but decreased significantly with. the Ephrussi– Beadle solution. Therefore, saline was a suitable solvent for sample preparation for the insects (Figure 8). The hemolymph UA level of the mutants decreased significantly with the injections of Feburic® and Uriadec® dissolved in normal saline at the minimum dosage for humans (Figure 9).. Figure 8-I~IV Effects of solvents used in the preparation of allopurinol on UA Levels of 5th instar mutant (o06). Four graphs (I-IV) show the results of comparing the effects of different solvents on the uric acid levels of model silkworms in different experimental groups. The hemolymph samples (n = 10) were analyzed by HPLC at 280 nm under the same treatment and conditions (three times per sample). W: water, S: 0.85% (w/v) NaCl/Water, E: Ephrussi-Beadle solution (NaCl 0.75 g, KCl 0.035 g, CaCl2 0.021 g →100 mL). The positive control was allopurinol (: A), and 40 μL of allopurinol solution (2.5 mg/dL) was injected (subcutaneously administered). NN, non-treated hemolymph sample. WN, SN, and EN were the solvents only. *0.85% (w/v) NaCl/Water is a saline solution and Ephrussi-Beadle solution is a so-called saline solution for insects. (** p < 0.01, Student’s t-test with Bonferroni’s correction). 8.
(9) Tanaka et al., The Use and Metabolism of the "o06" Strain-Silkworm as a Model of Hyperuricemia, AATEX 25(1), 1-12, 2020. Figure 9 Optimal solvents for the preparation of hyperuricemia medicine (A: Feburic® or B: Uriadec®) that adequately reduce UA levels in 5th instar mutants The hemolymph samples (n = 10) were analyzed by HPLC at 280 nm under the same treatment and conditions (three times per sample). The hemolymph UA level of the mutants decreased significantly with treatment with the hyperuricemia medicine dissolved in normal saline solution, at the minimum dosage for humans. W: water, S: 0.85% (w/v) NaCl/Water, E: Ephrussi–Beadle solution. *0.5 mL of Feburic® solution (10 mg → 10 mL) was added to 99.5 mL of W, S, or E, and 40 μL of the sample volume was administered. 0.5 mL of Uriadec® solution (20 mg → 10 mL) was added to 99.5 mL of W, S, or E, and a 40 μL sample volume was subcutaneously administered. (** p < 0.001, Student’s t-test with Bonferroni’s correction). Figure 10-A and B HPLC (HILIC) chromatograms of standard oxypurine mixture (Alla, UA, and related compd., A; 210nm, B; 280nm, inj; 3µL). Figure 10-C and D HILIC chromatograms of larval urine (C) with added standard Alla and Xan (D) Co-chromatogram of larval urine with added standard Alla; 50mg/dL and Xan; 2.6mg/dL, 210 nm, inj; 5µL.. Fig. 10-E and F Comparision with Alla (E) and UA levels (F) of hemolymph for 5th instar o06 by HILIC column. (per 1 group: 5 individuals, Normal; normal breeding group, Fasting; fasting group). 9.
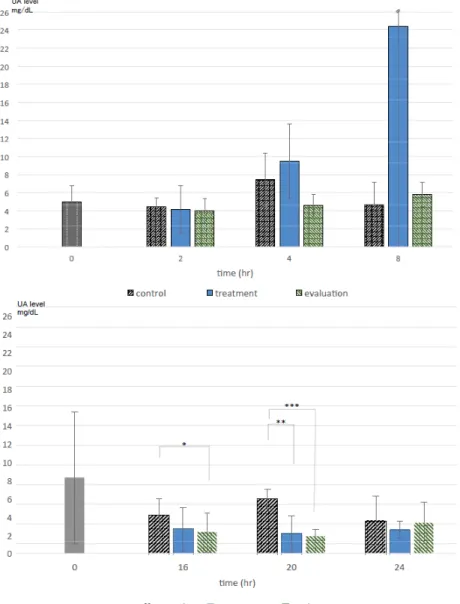
(10) Tanaka et al., The Use and Metabolism of the "o06" Strain-Silkworm as a Model of Hyperuricemia, AATEX 25(1), 1-12, 2020. detected in larval urine (Figure 10C, D). This indicates that the activity of uricase was suppressed so that Alla in hemolymph was maintained at a specific level, and UA was not metabolized but accumulated in hemolymph at 3 to 6day-old mutants. Our results indicate that strain o06 could serve as an alternative to the mouse hyperuricemia model. When the silkworms were given either a single subcutaneous or intestinal dose of hyperuricemic medication (Feburic®, AP, etc.), the medication effectively reduce the UA levels. Furthermore, a significant difference in the UA level after 20 hours was observed between the Feburic® and control groups (Figure 11).. On the basis that the o06 strain could serve as an alternative to the mouse hyperuricemia model in medical studies, we examined the UA (and Alla) content in the feces, larval urine, and meconium of this silkworm. There was no difference in the total amount of UA excreted (mg/individual) between a “normal breeding group” and a “fasting group” (data not shown). The hemolymph UA level was lower in the fasting group than in the normal breeding group (Figure 10E, F). The gross weight of UA excreted in the feces was unrelated to the quantity of meal (Morus alba) consumed. The UA level in hemolymph of the mutant was affected by diet, but the level of Alla was not. UA was excreted as feces, but Alla was not. Figure 11 Comparison of the duration of non-invasive oral administration and the effect of reducing hemolymph UA levels in the treatment (Feburic®) and evaluation (CPPG) groups Upper: hemolymph UA levels at 0 (n = 12), 2 (n = 4), 4 (control; n = 3; treatment groups, n = 4), and 8 (n = 4) hours. Lower: hemolymph UA levels at 0 (n = 15), 16 (n = 5), 20 (n = 6) (Feburic®**p = 0.003, CPPG: **p = 0.0015), 24 (control and Feburic®, n = 7; CPPG, n = 9) hours. All these samples were analyzed by HPLC under the same conditions (three times per sample). ** p < 0.005, Student’s t-test with Bonferroni’s correction.. 10.
(11) Tanaka et al., The Use and Metabolism of the "o06" Strain-Silkworm as a Model of Hyperuricemia, AATEX 25(1), 1-12, 2020. the o06 strain is a potential substitute for the mouse hyperuricemia model in medical research.. Discussion UA and other oxypurines were assayed by HPLC-UV using a polymeric-ODS with a high carbon content (ca. 17%) column. Our HPLC method (Tanaka et al., 2013) requires less plasma (hemolymph), which means that a diagnosis can be made less invasively. As the Xan levels in the hemolymph of the mutants increase, the UA disappeared with uricase treatment, as seen on the chromatogram, which also confirmed the purity of the UA (Rt 7.8). The hemolymph UA level of the mutants was higher than in normal silkworms. Zhang et al. (2011) studied this in vitro using a homogenate (hemolymph that included 10% fat body) from a normal silkworm (2–8-day-old 5th instars, Dazao strain) to evaluate gout medication. We investigated this using a live whole-body silkworm, and subcutaneous injection of AP medication significantly decreased the hemolymph UA level in the mutants. Both the weight and hemolymph UA level of the 5th instar mutants tended to increase with time. The chromatogram of the hemolymph of the mutants was simpler than that of the mice (Figure 3), and the peak purity of UA and Xan was confirmed by PDA-HPLC analysis of the mutant hemolymph and mouse plasma. A ratio was calculated to compare the authentic UA sample with the plasma; UA recovery was better from the pooled hemolymph sample compared with the pooled plasma, as shown in Figure 4. The mutant experiment showed its utility as a high UA-level model animal. The hemolymph UA level of the mutants increased with saline injection, and decreased significantly with Ephrussi–Beadle solution or water injections, as shown in Figure 8. We showed that a salt solution was suitable for sample preparation for the insects. The hemolymph UA level of the mutants decreased significantly with injection of AP (Figure 6), a hyperuricemia medicine dissolved in normal saline that was applied at the minimum dosage for humans (Figure 9). Because the mid-5th instar translucent larvae contain a specific level (ca. 5 mg/dL) Alla, as shown in Figure 10E, they do not express uricase (UA oxidase), an enzyme that degrades UA to Alla, as Hayashi (1960) showed in vitro. Silkworms and humans metabolize purine similarly, and the end product is UA for both. Moreover, AP and other hyperuricemia treatments effectively reduced the UA levels in the silkworm mutants. Our results indicate that. Conclusion We compared a mouse hyperuricemia model (Tanaka et.al, 2019) with our novel silkworm model. Mice were administered OX and the plasma UA level was measured; they were also administered 1.0 mg/g AP orally, or CPPG. The plasma UA levels of both the AP- and CPPG-treated groups were reduced. The results indicated that our strain o06 silkworm model could serve as an alternative to the mouse hyperuricemia model for studying reagents capable of reducing blood UA levels. Acknowledgments The authors thank Prof. Toshifumi Akizawa and Prof. Masato Otsuka of Setsunan University for their advice regarding the PDA chromatograms and duration of drug administration. Thanks are also due to Ms. Reika Daito, Mr. Yuudai Yamamoto, Mr. Manato Sakamoto, and Mr. Takakazu Hamada for their technical assistance. This work was supported by JSPS KAKENHI Grant no. JP17K08156. Disclosure statement No potential conflict of interest was reported by the authors. References Committee on Biochemical Constituents and Their Analytical Reagents (1993), Japan Society of Clinical Chemistry, Recommended method for determination of uric acid in serum by HPLC. Clinical Chemistry 22, 300-307. Eguchi M. (1961) Relation between uric acid content and xanthine dehydrogenase activity in several translucent and normal silkworms, Japanese J. Appl. Entomol. Zool., 5, 163-166. Hamamoto H. and Sekimizu K. (2014) Silkworm as a model animal for drug development, SEIKAGAKU, 86 , 578-582. Hayashi Y. (1960) Xanthine dehydrogenase in the silkworm, Bombyx mori L.. Nature, 186, 10531054. Hiroshige K., Kunifuji Y., Takasugi M., and Kuroiwa A. (1992) Studies on purinepyrimidine metabolism (1) Quantitation of purine-pyrimidine metabolites and allopurinoloxipurinol in biological fluids, J UOEH. 14, 211-218.. 11.
(12) Tanaka et al., The Use and Metabolism of the "o06" Strain-Silkworm as a Model of Hyperuricemia, AATEX 25(1), 1-12, 2020. Hiroshige K., Takasugi M., Yuu K., and Kuroiwa A. (1994) Studies on purine-pyrimidine metabolism (2) Effects of sample preparation and diet on the concentrations of oxypurines in blood and urine, J UOEH. 16, 167-178. Japan Society of Clinical Chemistry (2012) The Compilation of Recommended Method 2012 Edition, Japan Society of Clinical Chemistry, Tokyo, 374-382. Japanese Society of Gout and Nucleic Acid Metabolism. (2018) Guideline for the management of hyperuricemia and gout, Medical Review, 3nd edition: pp.92-94. Komoto N. and Tamura T. (2011) Translucent larval skin mutants of the silkworm and purine metabolism, Sanshi-Konchu Biotec 80, 75-80. Miller J.C., and Miller J.N. (1991) Statistics for analytical chemistry (Munemori S, How to take and Summarize Data; a Japanese translation of Statistics for Analysis Chemistry), Kyoritu Shuppan, Tokyo. Tanaka R., Miyata Y., and Sakazaki F. (2013) An improved, highly sensitive HPLC-based method for determining uric acid levels in microliter plasma volumes, Gout and Nucleic Acid Metabolism, 37, 117-125. Tanaka R., Miyata Y., Minakuchi N., Murakami A., and Sakazaki F. (2015) The xanthine oxidase inhibitory activity and hypouricemic effects of crude drugs obtained from the silkworm in mice, Yakugaku Zasshi 135, 1169-1176. Tanaka R., Sakazaki F., and Banno Y. (2016) The use of translucent larval skin mutants of the silkworm “o06” as animal models of hyperuricemia, XXV ICE 2016 proceedings. Tanaka R., Mori R., Murata S., Shoji Yamaguchi, and Sakazaki F. (2019) The xanthine oxidase inhibitory activity and hypouricemic effects of new phenylpropanoid obtained from aerial parts of Matricaria chamomilla L., J. JSMUFF 2, 77-90. Uemoto M. (2010) Fundamental knowledge for reliable analysis—concepts and definitions of the limit of detection and the limit of quantitation, Bunseki, 5, 216-221. Zhang X., Xue R., Cao G., Pan Z., Zheng X., and Gong C. (2011) Silkworms can be used as an animal model to screen and evaluate gouty therapeutic drugs, J. Insect Sci.12, 1-9.. Corresponding author: Dr. Ryuichiro Tanaka Faculty of Pharmaceutical Sciences, Setsunan University 45-1, Nagaotoge-cho, Hirakata, Osaka, 573-0101, Japan TEL & FAX: +81-72-866-3139 Email: tanaka-r@pharm.setsunan.ac.jp. (Received: May 1, 2020/ Accepted: November 10, 2020). 12.
(13)
図

+4

関連したドキュメント
An easy-to-use procedure is presented for improving the ε-constraint method for computing the efficient frontier of the portfolio selection problem endowed with additional cardinality
Let X be a smooth projective variety defined over an algebraically closed field k of positive characteristic.. By our assumption the image of f contains
It is suggested by our method that most of the quadratic algebras for all St¨ ackel equivalence classes of 3D second order quantum superintegrable systems on conformally flat
We show that a discrete fixed point theorem of Eilenberg is equivalent to the restriction of the contraction principle to the class of non-Archimedean bounded metric spaces.. We
In particular, we consider a reverse Lee decomposition for the deformation gra- dient and we choose an appropriate state space in which one of the variables, characterizing the
It turns out that the symbol which is defined in a probabilistic way coincides with the analytic (in the sense of pseudo-differential operators) symbol for the class of Feller
Then it follows immediately from a suitable version of “Hensel’s Lemma” [cf., e.g., the argument of [4], Lemma 2.1] that S may be obtained, as the notation suggests, as the m A
We study the classical invariant theory of the B´ ezoutiant R(A, B) of a pair of binary forms A, B.. We also describe a ‘generic reduc- tion formula’ which recovers B from R(A, B)
