I.Introduction
Perhaps the most challenging aspect of second language acquisition for learners is oral production. As Swain (1995) put it, there is no ‘faking it’ with speaking. It is often in real-time communication where cognitive resources must be intensely focused as un-automatized declarative knowledge needs to be summoned and expressed with reasonable syntax. What is more, the aforementioned challenges of oral output place Abstract: Task Complexity and Oral Output: Re-thinking Presentation Process examined learner oral output levels between groups during Q & A sessions by controlling task complexity for presenters and maximizing comprehensible input for listeners. Results suggest that the null hypothesis for RQ 1 be rejected: controlling task complexity dimensions (Robinson, 2001, 2003a) and maximizing comprehensible input, did not result in an equalization of oral output levels between groups. Results suggest that the null hypotheses for RQ 2 and RQ 3 be accepted: oral output levels rose over time and individual participant oral output levels correlated with overall course grade. This study provides useful information to future research endeavors that address specific components of oral output, task complexity, comprehensible input and motivation.
Task Complexity and Oral Output:
Re-thinking Presentation Process
Paul Del Rosario
1, Todd Leroux
11Faculty of Education, Hakuoh University
e-mail:[email protected]
Paul Del Rosario is the first author, Todd Leroux is the corresponding author.
enormous stress on the affective states of even the most eager second language learner. These realities have been recognized and the reasons for hypothesized by researchers and practitioners in the field. From extensive study to this end, it has become clear that teaching decisions play a major role in the facilitation of oral output. Furthermore, teaching professionals must create the appropriate conditions within the classroom and within classroom activities for learners to be able to muster the resources needed to speak in a second language. The teacher must be true to the profession by scaffolding knowledge and supporting the learner’s confidence to the degree that they are willing to engage in various communication events. This is a challenging but vital mandate for any second language educator worth his or her salt. This study is the first step in a series of studies that will investigate output. Using the knowledge gained from this study, future studies will investigate the limitations inherent in this paper’s research design with a keen eye on the impact of focus on form(s), feedback and error correction, motivation constructs, the relationship between comprehensible input and oral output, and the manipulation of task complexity components (Robinson, 2003a) as viewed from the cognitive paradigm.
Ⅱ.Literature Review
In decades past, the Krashen craze of “i + 1” comprehensible input that sifted through the learner’s so-called affective filter held the stage as one of the prevailing theories of language acquisition. Output, however, was not considered to be a major factor for learner language development though it was acknowledged as a potential facilitator (Krashen, 1981, 1985). Swain, based on her work with and research of Canadian French Immersion language learners, countered that comprehensible input alone was insufficient for language development. Complementing Krashen’s Input
Hypothesis, Swain offered the Comprehensible Output Hypothesis (1985, 1995), which, as described by Ellis (2010), proposed that, “Production requires learners to process syntactically; they have to pay some attention to form.” (p. 261). Oral output, according to Swain (1995), would transition learners away from top-down meaning-based communication only and push them to analyze the syntactical structures (bottom up processing) involved in constructing and ultimately expressing intended meaning. Further, output facilitates a learner to become aware of or notice his or her interlanguage gaps. This will lead to a redirection of cognitive resources toward filling those gaps (Schmidt and Froda, 1986). These interlanguage patches are then tested in future output events to determine language use and language usage suitability. In other words, output can trigger attention to form and with modified utterances applied in future interactions, which receive further feedback, and when repeated with sufficient frequency result in a transformation of declarative knowledge to procedural knowledge (Anderson, 1982, 1987, 1996; Corbett and Anderson, 1994; Schmitt, 2002). Even if the previous hypotheses and the latent constructs of output facilitation as regards noticing and attention to form are challenged outright, or challenged on their incremental value to language acquisition, “extended opportunities to produce output and receive relevant input were found to be crucial in improving the use of the target structure (Izumi, et al., 1999; Izumi and Bigelow, 2000). Long (1983) proposed the Interaction Hypothesis. This hypothesis, which is in step with Vygotsky’s (1986) zone of proximal development and socio-cultural theory, posits that interaction with others of higher ability can facilitate language acquisition because it connects and/or strengthens semantic (input) and syntactic (output), especially when there is a negotiation of meaning (John-Steiner and Mahn, 1996). Even though current prevailing
research-derived knowledge presumes input alone is not enough to spur language acquisition, logic would imply that the more input a learner has received the more output potentiality.
With the exception of early Krashen, perhaps, the root processes from which the researchers discussed above operate are primarily from the cognitive framework. However, social interactions and socio-educational factors cannot be excluded from cognitive explanations for SLA. Cognitive resources (attention) to input, output, form, noticing gaps in current status of interlanguage, intra-personal hypothesis-building conversations, hypothesis testing, interaction, feedback and more are inherent in the factors of this framework. The aforementioned involve time, or more specifically, time on task. Given that no resource, cognitive or otherwise, is boundless, time on task is an important consideration in measuring and comparing the efficacies of tasks and treatments; in measuring learner increases, decreases or gains in constructs ranging from the abstract to more concrete.
Though the value of output in language acquisition differs between hypotheses and theorists, it is impossible to remove output from communication – in any language. Hence, output, or more specifically, oral output or oral production, is an essential component of language though it might present the biggest hurdle, emotional or otherwise, to language learners. The difficulties associated with oral production in a second language are numerous. “One of the major obstacles learners have to overcome in learning to speak is the anxiety generated over the risks of blurting things that are wrong, stupid or incomprehensible” (Brown, 2001, p. 269). These affective language ego issues can be mitigated at a macro-level through fostering a supportive, lively and risk-taking environment; and can also be richly attended at a micro- or mechanical-level through
delineation and expectations for course requirements (assessment, participation, task) and classroom management (i.e. thoughtful, educated supportive and/or corrective feedback, anxiety strategy or coping tactics). According to a literature review of EFL learners’ anxiety types, causes, characteristics and effects, by Andrade and Williams (2009), conclusions of many of the established researchers in the field were that, “success and perseverance in foreign language learning to a large extent depends both on the teacher’s ability to minimize the debilitating effects of classroom anxiety and the learners’ ability to cope with the anxiety that cannot be prevented or avoided.” (p. 4). Thus, consideration of the nature of classroom tasks vis-à-vis learner level is a necessity if learner anxiety is to be properly addressed. Tasks that are created to be within learner ability, yet are still cognitively challenging, are highly desirable (Robinson, 2001, 2003a). Task difficulty assessment, from a cognitive framework, includes planning time as a key component among other factors such as memory and lexical retrieval/topic familiarity to name a few (Robinson, 2001; Skehan, 1996; Taguchi, 2007). Hence, for example, requiring learners to deliver an oral presentation as a culminating or end-of-unit task has empirical support in terms of the benefits of output performance (Foster and Skehan, 1999), anxiety reduction (Morena, 2016), and proper sequencing of complexity-appropriate tasks (Robinson, 2001, 2003a; Skehan, 1996) with the latter facilitating output and mitigating anxiety.
Anxiety is one side of the affective coin, while motivation and the willingness of learners to communicate (WTC) is the other. Motivation and WTC, from a social and socio-cultural/educational perspective, have been researched and reported to the degree that it is de-motivating to have to struggle through yet another literature review. Re-telling decades-old data supplemented by new and improved re-packaged versions will not
be done here other than by expressing that with post-positivist certainty there are numerous types of movers to action whether intrinsic: sincere curiosity; integrative: the desire to be identified as part of another culture via language proficiency; instrumental: for some form of personal benefit – positively or negatively construed – rewards notwithstanding; or the despised, yet ever prevalent motivation stemming from extrinsic reward systems: Do it or fail! (Dornyei, 1990; Dornyei and Ushioda, 2009; Gardner and Lambert, 1959; Macintyre, et al, 1998; Ushioda, 2003).
Work by Pintrich and associates in the late 1980’s, culminating in the development of the widely used and highly reliable Motivation Strategies Learning Questionnaire (MSLQ), has exposed the dynamic (temporal and situational) nature of motivation along with the associated use of various learning strategies with a particular focus on the aspect of regulation of one’s actions relative to external/environmental conditions (Duncan, et al, 2005; Pintrich, et al, 1993; Pintrich & De Groot, 1990). Further, Dornyei and Otto (2001, 1998) have proposed a process model of L2 motivation, which also posits that motivation has a temporal dimension: motivation is in flux and learners of a target L2 will move through stages. As individual learner differences cannot be denied, within this framework, for learners there is no one-size fits all motivational plan. However, the process model proposed above presupposes the long-term nature of L2 acquisition, which is not an appropriate supposition in many learning contexts and indeed for many learners, particularly in the context of this current study. Hence, an external reward component of motivation will be more applicable for those that just want to pass the English class and be done with English by their 3rd year of study, while for others, intrinsic factors will initiate their
involvement with the target L2 regardless of extrinsic reward.
sourced, building from Skinner and his operant conditioning paradigm, Brown (2001) states that, “Human beings are universally driven to act, or “behave,” by the anticipation of some sort of reward - tangible or intangible, short term or long term - that will ensue as a result of the behavior.” (p. 58). At the same time, Brown urges caution as learner dependence on short-term coaxing may impede the development of intrinsic motivation, which has proven to be much more powerful an agent for action and all that it encompasses as found by Deci, et al. (1999), in a meta-study of 128 research papers:
[E]ngagement-contingent, completion-contingent, and performance-contingent rewards significantly undermined free-choice intrinsic motivation …, as did all rewards, all tangible rewards, and all expected rewards. Engagement-contingent and completion-contingent rewards also significantly undermined self-reported interest …, as did all tangible rewards and all expected rewards. Positive feedback enhanced both free-choice behavior … and self-reported interest … (p. 627). In closing, the overwhelming majority of research has highlighted the ills of externally-sourced, short-term rewards; however, the external reward contingency in certain circumstances may indirectly increase intrinsic motivation (Covington, 2000a, 2000b; Eisenberger & Shanock, 2003). In fact, for many EFL professionals, extrinsic motivation may be all they have in working with some learners, initially. The theory is that if an instructor can get a learner started and successes realized by the learner, then these successes, albeit small, may lead to more involvement and perseverance, as well as develop internally-sourced motivators (Bandura, 1986, 1977). Therefore, in consideration of the individual differences of a mixed-level study sample, which includes participants with short-term goals
(i.e. successful course completion with as minimal effort as possible) as opposed to long-term second language acquisition, inclusion of an extrinsic reward to initiate output could play a role in increasing the oral output of some participants though with limited impact on the group or groups.
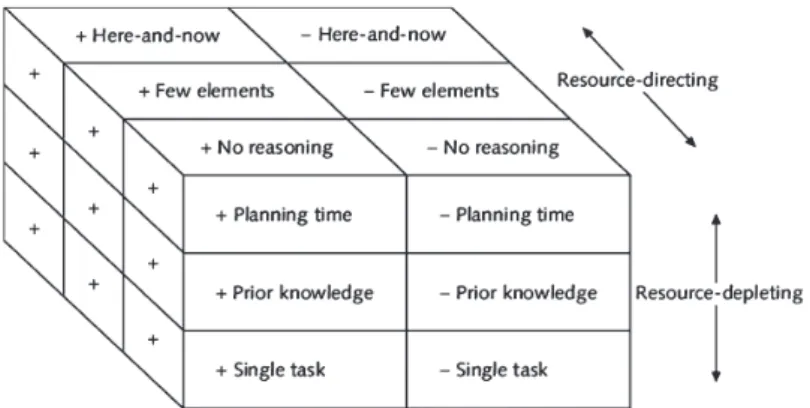
Returning to complexity-appropriate tasks, the literature is far from consensus even with basic definitions. This is also the case for task sequencing, where, for example, the naturalist approach posits that each learner has an internal, and by extension, unique syllabus (Krashen, 1981, 1985), while Robinson posits cognitive readiness (2003b, 2007). There is, however, significant consistency in the research that activities must progress from simple to complex, but as mentioned above, what is problematic is what defines simple to complex as well as the components and graduations along this continuum. Robinson (2001) acknowledges the works of Long, Skehan, and Widdowson as those from which he built the foundation for his model of task complexity (Long, 1985; Skehan, 1996; Widdowson, 1990). Robinson (2003a), in a must-read for budding cognitivists, builds on his complexity factor map to specifically target task output as a function of task complexity vis a vis attentional resource ‘directers’ and ‘depleters’ (Figure 1). Task design and resultant learner output expectations are directly linked. Robinson speaks of the empirical research supporting the attentional model as distinct dimensions.
Tasks where planning time and prior knowledge are available, and which involve only a single activity, are simpler and less attention demanding than dual tasks requiring simultaneous activities, and where no prior knowledge or planning time is available. Increasing complexity along these dimensions alone has the effect of depleting the attentional resources available to perform the task, and dispersing it over many, non-specific linguistic aspects of production and comprehension (p. 647).
Figure 1: Resource-directing and resource-depleting dimensions of task complexity
dimensions. From Robinson (2003a). Attention and memory during SLA.
The handbook of second language acquisition, p. 648.
From the cognitive linguistic framework, and Robinson’s (2001, 2003a) models of output as a function of task complexity vis a vis attentional resource ‘depleters’ and ‘directers’ a quasi-unique presentation and post-presentation Q & A session process was developed for specific use within an EFL context. To explore participant output using this process, the following a priori hypotheses were posed:
1. Repeated oral production tasks (presentations) of equal and simple task complexity will result in a fixed factor effect (i.e. equal levels of oral output (questions) from audience members) across groups.
2. Under the conditions stated in RQ 1, participant number of questions / minute will increase over time across groups as anxiety is reduced.
3. Q & A session output will produce a significantly significant correlation with final course scores across groups (i.e. extrinsic
reward-based system of participation scoring would have minimal impact on the participants’ output levels).
Ⅲ.Methodology (1)Participants
Sixty-five female participants in 1 intact 1st-year class (n=30), and
1 intact 2nd-year class (n=35) in a women’s university in western Tokyo
were assessed for oral output participation levels immediately following a series of presentation sessions. As regards proficiency, these participants were rated by a department-specific scale from 1 – 8; and were rated as the highest ability cohort relative to their peers. This categorization was based on a TOEIC Sample Test, and a TOEIC Listening and Reading Test score from the previous year-end. Based on the instructor/researcher’s department and TOEIC test experience, the 1st-year participant scores are
presumed to range from 350 – 450 and 2nd-year participant scores from
400-550. As evidenced by attendance rates, the 1st-year participants were
highly motivated with an attendance rate of just under 98%. The 2nd-year
participants, on average, attended well but only had an attendance rate of approximately 95%. In short, both classes suggested varying levels of intrinsic motivation given their high classification (based on TOEIC scores) and their excellent attendance records.
(2)Procedure
This study was conducted during a regular 15-week semester for a listening and speaking class though the presentation process lasted only eight weeks. Due to other constraints, only seven Q & A sessions were possible. In the first class, participants were presented a copy of the course outline and informed of the class by class proceedings. Included in this
instruction was the highlight of key points of assessment: presentation and presentation Q & A participation. The presentation itself was listed at 10% of the course grade, while Q & A participation was allocated 15%. For 1st
-year students, they were required to produce and deliver a three to four-minute prepared speech on a topic provided at Week 4 of the semester, while the 2nd-year participants were required to make a four to five-minute
presentation on a topic also provided in Week 4. Presentation practice sessions were held as modeling and practice events using a script that included the introduction format, transition phrases and conclusion format and verbiage. Presentations began on the seventh week of classes. Related to this study, a department prescribed teaching focus was on developing learners’ note-taking skills. Note-taking activities were engaged for most lessons where the textbook was used as well as in the presentation process.
From class one, the instructor worked with purpose in creating an anxiety-reduced, risk-taking environment: a friendly, lively atmosphere that encouraged frequent interaction. From class two to seven, the class process remained consistent: after vocabulary quiz completion, an interactive warm-up activity was engaged. This 5-minute warm-up activity was a matrix of lesson-topic-related questions. Learners would mix and ask the name of their partner, ask a brief question, respond to a brief question, take each other’s leave, and then switch to another classmate to repeat the process. Following this, presentation practice began. This practice was the first direct act of controlling task complexity – within and between groups. With presentation scripts in hand, participants would engage in drill-like practice of a standard introduction, transition statements and conclusion. The instructor would model, and the participants would imitate – phrase by phrase, and over time, sentence by sentence (i.e. speech segments were increased incrementally). During modeling, participant attention
was explicitly drawn to mimic eye-contact level (i.e. amount of), voice (inflections and intonations) and hand gestures (for sequencing, use with adjectives). Next, with presentation scripts in hand again, the participants working in pairs would perform the previous drill-like activity though this time without instructor modeling. Specifically, one participant of the pair would hold both their and their partner’s script back-to-back and at eye level. The other participant of the pair could then practice the script with hands free in order to facilitate gesture use. Hence, while one participant of a pair group practices the presentation script orally and with gestures, the other participant could read along silently and also correct any errors made by her partner. After the script practice was complete for the one participant, the roles were reversed, and the process repeated. During this practice, the instructor would circulate, monitor and provide feedback to the participants focusing mostly on praise-worthy points of performance but with some corrective feedback. Thereafter, textbook content: listening and speaking activities, was engaged. The textbook itself was a communicative textbook but also focused on form with grammatical and other syntactical structures (i.e. word order, word parts and word forms). Presentation topic ideas were sourced from unit-end activities and modified for participant suitability in consideration of task complexity and resulting output.
From classes eight to fourteen, the presentation and Q & A process began. In an attempt to reduce cognitive load, as it relates to attentional demands and oral output: minimal task complexity; and, to mitigate learner anxiety, the oral presentation process for both groups was constructed in consideration of Robinson’s (2003) task complexity dimensions.
Table 1.
Oral presentation process as per attentional resource/task complexity dimensions.
Design Dimensions
1. Topics modified to participant personal circumstance or current interest or experience.
Here and now Prior knowledge 2. Topics from textbook (modified)
to build on previously met vocabulary, syntactic and language structures (scaffolding).
Individual differences for ‘Here and now’
Prior knowledge 3. Presentation structure was
provided but main body content was learner developed.
Simple design/few elements/prior knowledge
4. Extensive planning time provided to increase fluency, complexity, accuracy and reduce presenter anxiety.
Planning time (extensive reasoning without time or performance pressure) 5. Presentation content submitted
for instructor review and feedback regarding:
a.Paragraph development b. Accuracy (lexical, some
syntax)
c.Content check for duration d. Content check to maximize
comprehensible input for audience/listeners.
Planning time (extensive reasoning without time or performance pressure)
6. Presentation to small groups given
3 times Anxiety reduction/prior knowledge
7.Concurrent presentations Anxiety reduction
8. Q & A session positioned
post-presentation Single task /element separation
9. Pa r t i c i p a t i o n e v a l u a t e d b y question frequency (not evaluated for complexity, fluency, accuracy)
Anxiety reduction
Note. Actual presentation score was determined based on four equally-weighted factors: eye-contact, voice/fluency, gestures, preparation/duration.
The oral presentation process (oral presentation and Q & A) loosely follows the well-known fluency development technique of 4-3-2. This fluency technique demands a speaker to present a 4-minute prepared
speech. Then, they repeat the same prepared speech, but with a 3-minute time constraint, and then again in just a 2-minute time allotment. Repetition of prepared speeches with increasing time constraints has shown to be an effective fluency development technique (Nation, 1989). The difference between this presentation structure from the 4-3-2 fluency development technique is that there is no requirement to perform the presentation with increased speed.
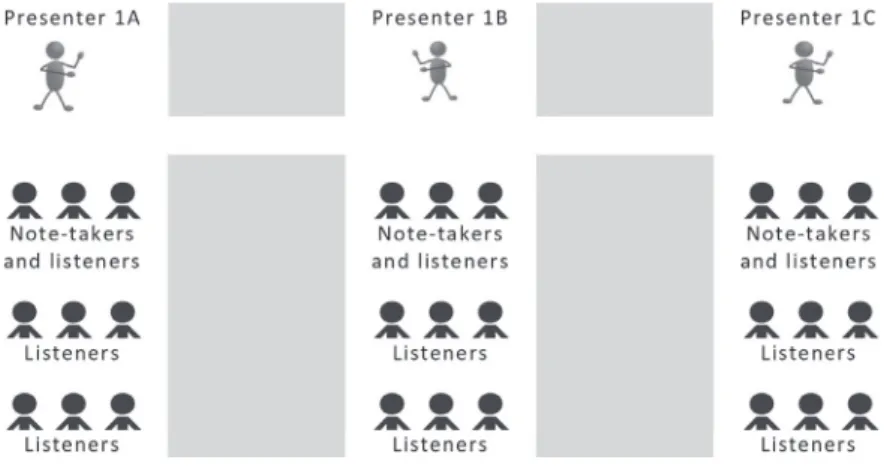
Another important structural component of this presentation process is that there are three presentations running concurrently though with staggered start times. Once all three presenters have completed a presentation, they rotate positions and prepare to speak again, and then a final time.
The presentation process with three concurrent presenters each presenting three times naturally prescribes a division of audience members into three groups. These audience groupings are further divided into three sub-groups. In each of the three audience groupings, the members sitting in the front row of seats (i.e. most proximal to the presenter) were required to both listen and take notes (Figure 2).
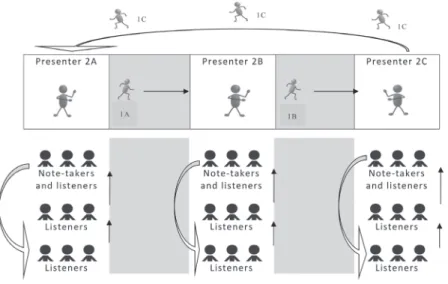
When the first presentation session finishes, the three presenters rotate positions as do the audience members. The presenters move in a counter-clockwise direction (i.e. to a new audience), while the audience members exchange seating locations by moving up in rows and front/ first row to the back. Hence, listeners that sat in the second row for the first presentation, become the first row of listeners and note-takers for the second presentation. This process repeats one last time for the third and final presentation (Figure 3). The presentations themselves were graded by the instructor three times on four factors: eye-contact, voice/fluency, gestures and preparation/duration criteria. A scoring rubric was developed and distributed to each participant and at the conclusion of the process each participant received their score out of ten (marked on the scoring rubric) along with brief feedback comments.
Question and answers sessions follow the presentation process and also follow the previous rotational process. In other words, the question and answer sessions commence after all three presenters have made three presentations. At the end of the third presentation sequence, the presenter begins to answer questions from their respective audience. Specifically, for efficiency reasons, after the third presentation sequence is complete, the presenters do not rotate. Instead, for the first Q & A session, they remain and receive questions from their immediate audience members. After the first Q & A session is complete, the presenters rotate to receive questions from another audience, and then again.
The Q & A session process is similar to the presentation process. Recall that there were three audience groups and within each group there were three subgroups. Some audience members took notes for the first presentation, after presentation completion, others moved to the front seats and took notes for the second presenter and so on. This process was engaged through each presentation session (i.e. three times). Further, the Q & A session was three to five minutes in duration but split into two parts to give note-takers the exclusive opportunity to open the question process for 60 - 90 seconds, while other audience members (non-note-takers) listened to the questions and responses and/or prepared questions of their own when it is their time. All audience members ask questions after the initial note-taker’s privilege time has ended. Thus, for two to four minutes, all audience members are free to ask questions. For each question asked a participant receives a good question ticket from the presenter to whom they asked their question. At the end of the session, every participant counts their ‘Good Question’ tickets and reports the total to the instructor. At the end of the semester, all questions asked by each participant are totaled and receive a score out of 15. There was no consideration for
syntactical complexity or accuracy for scoring; score values were relative and instructor determined.
In summary, three presenters make back-to-back-to-back presentations and engage in back-to-back-to-back question and answer sessions. The audience listens to three presentations and each audience member takes detailed notes of one presentation.
Ⅳ.Results
Regarding RQ 1, the results indicate a high interaction frequency between audience members and presenters in both groups. First-year participants with presumed lower TOEIC scores (class average) outperformed 2nd-year students in terms of total questions and questions
asked per presenter, per listener and per minute of Q & A time. Of course, as can be seen, 1st-year participants had almost 15% more time on task
but fewer participants in the group (n=30), yet even with equalizations of time, Group 2 still outperformed Group 1 (2nd-year participants) (Table 2).
Table 2.
Raw output from post-presentation Q & A sessions.
Group 1
(2nd-year) (1Group 2 st-year)
Total Q’s Asked 1307 1985 Time on Task 99 min. 113 min. Average Question / Participant 37.34 66.17 Questions / minute 13.20 17.50 Questions / minute / presenter 4.4 5.8
Range – High 58 98
Range –Low 9 15
Descriptive statistics suggest a random distribution of scores as indicated by SD (standard deviation), skewness and kurtosis values (Table 3). Results also indicate the likelihood of significant differences of group means as there was no overlap of lower and upper bound mean confidence intervals presented in box plot format. Statistically significant group differences were confirmed via a one-way ANOVA, F(1, 63) = 62.93, p = .000 (Figure 4). Hence, the null hypotheses for RQ 1 is rejected.
Table 3.
Descriptive statistics for Total Questions Asked in Seven Q & A sessions.
Group 1 Group 2 Mean 37.34 66.17 SE of the mean 2.01 3.15 95% CI Lower Bound 33.26 59.72 95% CI Upper Bound 41.42 72.61 SD 11.82 17.27 Skewness -.36 -.75 SE of Skewness -.15 .43 Kurtosis -.15 1.52 SE of Kurtosis .78 .83 Note: N = 65.
Regarding RQ 2, data indicate a rise in the number of questions asked per minute for both groups, which is an expected outcome as the Q & A process becomes more familiar with each participant as well as the assumed anxiety reduction as asking questions became the established norm. Further, early in the Q & A sessions, participants were encouraged and reminded of the participation marks associated with the process. Figure 5 also shows that Group 2 (1st-year participants) continued to increase
in the number of questions they posed up until presentation session five, which then declined for two consecutive weeks: six and seven. However, Group 1 (2nd-year participants) only exhibited consecutive gains until
presentation session three, and then presented volatility thereafter. Given the general gains in number of questions asked, the null hypothesis was accepted.
Figure 5. Number of questions asked per minute for each Q & A session with,
typically, three presenters fielding questions, concurrently.
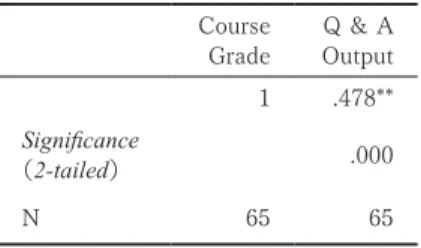
Regarding RQ 3, results indicate a statistically significant correlation r = .473, N = 65, p = .001 between two variables: Q & A session output and final course grade (Table 4). Thus, the null hypothesis is accepted.
0 5 10 15 20 25 30 1 2 3 4 5 6 7 Group 1 Group 2
Table 4.
Pearson Correlation
Course
Grade OutputQ & A 1 .478** Significance (2-tailed) .000 N 65 65 p = .001 V.Discussion
(1)RQ 1: Data suggested significant differences between groups. Thus, controlling task complexity and creating anxiety-reduced learning contexts did not have a fixed linear effect on oral output; hence, individual differences and other factors must be considered to account for undetermined variance. Profitable is the examination of oral output in this presentation process perhaps under the lens of alternative theories such as The Cognition Hypothesis, which:
… allows a much greater role for individual differences in task-based learning than do proponents of other approaches … who have so far been largely concerned with the effects of design features of tasks or task condition, alone on L2 performance (Robinson, 2003b, p. 67). There were significant differences between groups. Group 2, the 1st
-year participants with, on average, lower TOEIC scores, asked more question in the Q & A sessions than Group 1, the 2nd-year students. Though
there is no definitive explanation in the literature for this unexpected result, one reason for this disparity could be the classroom dynamics: the 1st-year
participants were highly energetic. Perhaps, the excitement of their opening year in university led to their active participation. Further, 2nd-year students
in the institution have additional responsibilities other than academics; hence, physical robustness may have been less, relatively speaking. In addition, the class for 2nd-year participants (Group 1) was Period 2,
which may have precipitated lower attendance and motivation facets. In summary, though the differences between groups exist, the roots of this output manifestation remain in the exploration mode. The willingness to communicate (WTC) would also be a construct worthy of pre-test measure as there were tremendous ranges in the amount of questions asked within each group. Future research applying this presentation process could assess learner WTC and correlate those findings with frequency of output. This might shed more light on latent factors that were not accounted for with this study’s research design.
Though not a research question, participant performance in oral presentations, and the sheer number of questions posed/brief interactions that ensued far exceeded the expectations of researchers. In nearly every Q & A session, participants would have asked more questions if there was time to do so. Thus, even though RQ 1 was rejected, it was clear to the researchers that the presentation process developed was successful in creating the conditions necessary for extensive oral output production. Another possible reason for the large number of questions asked during the presentation process was question repetition. Perhaps because of the participation scoring component, it was observed that some participants would ask the same question to each of the presenters. Further, these short strings of information were automatized chunks (Ellis, 1996, 2003, 2009, 2012; Xu, 2016) meaning that they could be retrieved and produced instantly. In addition to the participation points awarded for number of questions asked to a presenter, facilitation of the desire to participate was the structure of the Q & A session: time constraints and the opportunity
to have exclusive rights during the questioning segment. Audience members that were note-takers during a particular presentation had the first opportunity to ask questions. These note-takers represented one-third of every presenter’s listening audience (i.e. three audience members). Taking advantage of this opportunity to ask questions exclusively, note-takers would throw as many questions as possible at the presenter before the competition for presenter attention became intense (i.e. the number of participants tripled from three to nine, or more). Q & A sessions almost always ended with hands in the air. In other words, the atmosphere was more than lively throughout the Q & A process.
As to the nature of the questions, many were “Yes/No” type and simple Wh-questions and required simple answers. For example, if a presentation was about a famous musical group, a common question was, “Who do you like member?” Then, of course, a name is quickly uttered, a ‘Good Question’ ticket is issued by the presenter, and the next question addressed. For this study, there was no reward distinction for question complexity, nor for syntactical accuracy. Each question received a ‘Good Question’ ticket regardless of form or accuracy. Throughout the presentation though there was a range of question complexity such as “If” forms. One possible reason for the fewer number of questions asked by Group 1 (2nd
-year participants) could have been due to the syntactical complexity of the questions asked given their relative ability to the 1st-year participants.
The 2nd-year participants were likely to have had higher TOEIC scores on
average. In addition to being syllabically more substantial, the question syntax is also likely to have not been automatized; hence, retrieval takes time (Scmid and Fagersten, 2010, Yoshimura and MacWhinney, 2007). As well, specifically, word order seemed to pose the greatest issue with numerous false starts, gestures indicating word order issues and the
occasional use of L1 as a last resort all of which increased the time required to pose a question. Furthermore, grammatically complex question forms would often result in comprehension problems for the presenter/ question receiver, to which four interaction patterns were observed:
1. Request for clarity (often through head gesturing signaling non-comprehension)
2.Repetition of the question using simplified syntax/reformulation 3.Resort to L1
4.Mix of some or all of the above
This ‘interactionally-modified’ input or negotiation of meaning resulted in interlocutor comprehension though of course this in no way suggests acquisition (Gass and Varonis, 1994; Ellis and Fotos, 1999). However, Robinson suggests in “The Cognition Hypothesis” that complexity and/or modified input can lead to greater uptake (2003b, 2007).
In addition to the above, observations indicated that much of the presentation output was received as comprehensible input by the listeners. There was little off-task behavior, mobile phones were nowhere to be seen and participation was high. Questions rarely induced redundancy (i.e. questions seeking factual information previously disclosed in the presentation). Questions were typically directed toward receiving additional information about the presentation topic or about the presenter, personally.
As mentioned above, on occasion participants would operate completely in L1. Occurrences of this nature were often near the end of the presentation time and always when the instructor moved to observe and monitor another presentation grouping. Though from one perspective disappointing and reminders to operate in the L2 were provided, it was also occasionally ‘blind-eyed’ by the researcher/instructor. This was done
because from another perspective, it was evidence that the presentation task design was interesting to both the presenter and audience members. There was sincere curiosity with interactions and laughter and outbursts of surprise to responses and follow up questions. No question tickets were given for Japanese questions suggesting that sincere curiosity (intrinsic motivation) overcame extrinsic motivation for rewards of participation points, which is compatible with extensive extant literature on the subject (Dornyei, 1990; Dornyei and Ushioda, 2009; Gardner and Lambert, 1959; Macintyre, et al, 1998; Ushioda, 2003). Obviously, the intrinsic motivation was not related to use of the L2; rather, it was a sincere curiosity about the presenter and her experiences. Albeit from an optimistic perspective, the benefits of a simple task design, reducing task-anxiety and classroom anxiety and maximizing comprehensible input suggests they are positive influences on subsequent oral output tasks.
(2)RQ 2, interaction/oral output results show gains by session though there were fluctuations that need to be accounted for. The initial increases in the number of questions asked in the Q & A session can be associated, in part, to process familiarity and anxiety reduction. In general terms, participants fully grasped the process by Q & A session three. In other words, the entire process ran more smoothly each session, and there was very little supplementary prompting required to, for example, have participants rotate positions. The up-tempo atmosphere of Q & A sessions was sustained through seamless transitions and as a result, more readily carried over between Q & A session process stages.
Directly comparing the growth rates of the number of questions asked by group, there are obvious differences. Results indicate that Group 1 had a reduced number of questions asked in Q & A session four though it is noteworthy that in that particular session there were only two presenters
and one of the presentations was relatively weak. Thus, the response from the audience was also diminished. In addition, Group 1, which was scheduled during in the morning (i.e. Period 2), had reduced attendance in Q & A session six due to a major train delay: only 23 of 35 participants were in attendance. In short, the class mood was diminished. A final plausible account for a drop in the number of questions asked in the final Q & A session was fatigue. Group 1 was comprised of 2nd-year participants
who have, beyond academics, more responsibilities than did the 1st
-year participants. Hence, the combination of end of semester fatigue, increased academic responsibilities and a department-wide TOEIC test two days earlier, are suspected factors. This was further compounded by the natural reaction of looking forward to a holiday break, which was quickly approaching: O-shogatsu (New Year in Japan).
Group 2 showed regular increase in the number of questions asked up until Q & A session five. Thereafter, however, there was a steady decline though there was no instance where presenters were idle from a lack of questions. One factor for consideration that was consistent between groups was when there were only two presenters. The output by audience members was reduced even though more time is given for questions to be asked. This was the case in Q & A session seven. Another reason for a decline in the number of questions that is consistent between groups is general fatigue. Group 2 wrote the department-wide TOEIC test on the same day and time as Group 1 and they were approaching the end of the first semester of their first exposure to university life and all the changes in lifestyle therein.
Based on the data, and the impact of the proposed causes for declines in questions asked near the end of the study, the null hypothesis that questions asked over time would increase is accepted.
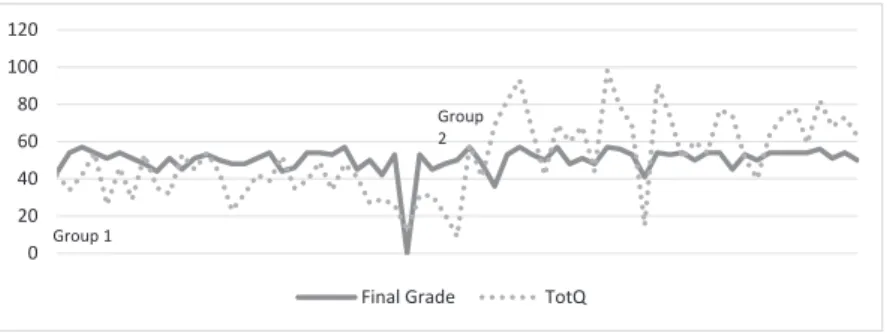
(3) Regarding RQ 3, the determination of a significant correlation between questions asked and overall course grade would indicate the minimal role that extrinsic rewards had on the entire sample of participants. In detail, the higher the number of questions asked is correlated with the remaining 85% allocated to quizzes of vocabulary, listening and grammar, presentation scores and a final exam, which also included vocabulary, listening and grammar elements – all based on the course textbook. Furthermore, though statistically significant results, the correlation is not weak, but nor is it overpowering. It is highly unlikely that all the participants were driven totally by extrinsic forces, and in fact, with a deeper, graphic inspection of individual participant oral output (i.e. Total Questions asked in Q & A sessions) in direct comparison to final course scores, some interesting observations stand out (Figure 6). Group 1 would indicate that the reward-based scoring system did not have an overt impact on the number of questions asked, while Group 2 would indicate the opposite. However, without rushing to judgement, for example, the reasons for many of the Group 2 participants asking questions at a level that out-did other aspects of course performance could be for reasons intrinsic in nature though perhaps the extrinsic reward system was the impetus for initial question posing and thereafter reducing the anxiety of initiating communication. Future research designs should thus include a qualitative facet for understanding participant actions and precursor motivations as well as pre- and post-test measures.
In addition, the minimal impact of the extrinsic reward supposition is also supported by the drop in the number of questions asked near the end of the study though external factors have to be added to the model. Once again, a deeper examination of attendance records would present data as to whether participants with relatively low levels of oral output (number
of questions asked) were able to use the opportunity of less competition to ask more questions and thereby boost their score. Though not definitive, it would provide indirect evidence of the efficacy of having an extrinsic reward-based participation plan as a means to increase participant participation at least initially.
Figure 6. Line graph of equalized Final Course Grade (converted to facilitate visual
comparison) and Total Questions asked.
In closing, though there are anomalies, there appears to be a reasonably consistent pattern between participants, their final course grade and the number of questions asked, which is confirmed by the statistically significant Pearson correlation. Hence, the extrinsic reward system is assumed to have had an impact on some participants though minimal. Ⅵ.Conclusion
The output facilitated by this presentation process is evident. Future studies that isolate aspects of motivation, comprehensible input, and task complexity, in particular, may provide further detail in explaining group and individual task participation behaviors in an EFL context.
0 20 40 60 80 100 120
Final Grade TotQ Group 1
Group 2
Ⅶ.References
Anderson, J. R. (1996). ACT: A simple theory of complex cognition. American Psychologist, 51 (4), 355.
Anderson, J. R. (1982). Acquisition of cognitive skill. Psychological review, 89 (4), 369.
Anderson, J. R. (1987). Skill acquisition: Compilation of weak-method problem situations. Psychological review, 94 (2), 192.
Andrade, M., & Williams, K. (2009). Foreign language learning anxiety in Japanese EFL university classes: Physical, emotional, expressive, and verbal reactions. Sophia Junior College Faculty Journal, 29 (1), 1-24. Bandura, A, (1977). Self-efficacy: toward a unifying theory of behavioral
change. Psychological review, 84 (2), 191-215.
Bandura, A. (1986). Social foundations of thought and actions: A social cognitive theory. Englewood Cliffs, NJ: Prentice Hall.
Brown, H.D. (2001). Teaching by principles: An interactive approach to language pedagogy (2nd ed.). Englewood Cliffs, NJ: Prentice Hall Regents.
Covington, M. V. (2000b). In Deci, E. L., Koestner, R., & Ryan, R. M. (Ed.). A meta-analytic review of experiments examining the effects of extrinsic rewards on intrinsic motivation (pp. 627-668). Psychological Bulletin 125 (6).
Crookes, G. (1989). Planning and interlanguage variation. Studies in second language acquisition, 11 (4), 367-383.
Deci, E. L., Koestner, R., & Ryan, R. M. (1999). A meta-analytic review of experiments examining the effects of extrinsic rewards on intrinsic motivation. Psychological Bulletin (125) 6, 627-668.
Dörnyei, Z. (1990). Conceptualizing motivation in foreign ‐ language learning. Language learning, 40 (1), 45-78.
Dornyei, Z., & Ottó, I. (1998). In: Working Papers in Applied Linguistics. Motivation in action: A process model of L2 motivation (pp. 43-69). Thames Valley University, 4.
Dörnyei, Z. (2001). New themes and approaches in second language motivation research. Annual review of applied linguistics, 21, 43-59. Dörnyei, Z., & Ushioda, E. (Eds.). (2009). Motivation, language identity and
the L2 self, 36. Multilingual Matters, 350-356.
Duncan, T. G., & McKeachie, W. J. (2005). The making of the motivated strategies for learning questionnaire. Educational psychologist, 40 (2), 117-128.
Eisenberger, R., & Shanock, L. (2003). In Deci, E. L., Koestner, R., & Ryan, R. M. (Ed.). A meta-analytic review of experiments examining the effects of extrinsic rewards on intrinsic motivation (pp. 627-668). Psychological Bulletin 125 (6).
Ellis, N. C. (1996). Sequencing in SLA. Studies in second language acquisition, 18 (1), 91-126.
Ellis, R., & Fotos, S. (1999). Learning a second language through interaction, (17), John Benjamins Publishing.
Ellis, N. C. (2003). Constructions, chunking, and connectionism: The emergence of second language structure. The handbook of second language acquisition, 63-103.
Ellis, N. C. (2009). Optimizing the input: Frequency and sampling in usage-based and form-focused learning. The handbook of language teaching, 139.
Ellis, R. (2010). The Study of Second Language Acquisition (2nd ed.). Oxford: Oxford University Press.
Ellis, N. (2012). Frequency-based accounts of second language acquisition. The Routledge handbook of second language acquisition, 193-210.
Foster, P., & Skehan, P. (1999). The influence of source of planning and focus of planning on task-based performance. Language Teaching Research, 3 (3), 215-247.
Gass, S.M., & Varonis, E.M. (1994). Input, interaction, and second language production. Studies in second language acquisition, 16 (3), 283-302.
Izumi, S., Bigelow, M., Fujiwara, M., & Fearnow, S. (1999). Testing the output hypothesis: Effects of output on noticing and second language acquisition. Studies in Second Language Acquisition, 21 (3), 421-452. Izumi, S., & Bigelow, M. (2000). Does output promote noticing and second
language acquisition? Tesol Quarterly, 34 (2), 239-278.
John-Steiner, V. & Mahn, H. (1996). Sociocultural approaches to learning and development: A Vygotskian framework. Educational psychologist, 31 (3-4), 191-206.
Krashen, S. D. (1981). The “fundamental pedagogical principle” in second language teaching. Studia Linguistica, 35 (1 ‐ 2), 50-70.
Krashen, S. D. (1985). The input hypothesis: Issues and implications. Addison-Wesley Longman Ltd.
Lightbown, P. M. (2003). SLA research in the classroom/SLA research for the classroom. Language Learning Journal, 28 (1), 4-13.
Long, M. H. (1983). Native speaker/non-native speaker conversation and the negotiation of comprehensible input1. Applied linguistics, 4 (2), 126-141.
Long, M. H. (1985). A role for instruction in second language acquisition: Task-based language teaching. Modelling and assessing second language acquisition, 18, 77-99.
Morena, K. (2016). Foreign Language Anxiety in Out-of-Class Performance. Identifying Language-Anxiety Sources, Its Effects, and
Coping Strategies. neofilolog: 29.
Nation, P. (1989). Improving speaking fluency. System, 17 (3), 377-384. Pintrich, P. R., & De Groot, E. V. (1990). Motivational and self-regulated
learning components of classroom academic performance. Journal of educational psychology, 82 (1), 33-40.
Pintrich, P. R., Smith, D. A., Garcia, T., & McKeachie, W. J. (1993). Reliability and predictive validity of the Motivated Strategies for Learning Questionnaire (MSLQ). Educational and psychological measurement, 53 (3), 801-813.
Robinson, P. (2001). Task complexity, task difficulty, and task production: Exploring interactions in a componential framework. Applied linguistics, 22 (1), 27-57.
Robinson, P. (2003a). Attention and memory during SLA. The handbook of second language acquisition, 631-678.
Robinson, P. (2003b). The Cognition Hypothesis, Task Design, and Adult Task-based Language Learning. Second Language Studies, 21(2), Spring 2003, 45-105.
Robinson, P., & Gilabert, R. (2007). Task complexity, the Cognition Hypothesis and second language learning and performance. IRAL-International Review of Applied Linguistics in Language Teaching, 45 (3), 161-176.
Schmidt, R., & Frota, S. (1986). In R. Day (Ed.), Talking to learn: Conversation in second language acquisition (pp. 237-326). Rowley, MA: Newbury House.
Schmid, M. S., & Fägersten, K. B. (2010). Disfluency markers in L1 attrition. Language learning, 60 (4), 753-791.
Schmitt, N. (2002). An Introduction to Applied Linguistics. New York: Oxford University Press.
Skehan, P. (1996). A framework for the implementation of task-based instruction. Applied linguistics, 17 (1), 38-62.
Swain, M. (1985). Communicative competence: Some roles of comprehensible input and comprehensible output in its development. Input in second language acquisition, 15, 165-179.
Swain, M., & Lapkin, S. (1995). Problems in output and the cognitive processes they generate: A step towards second language learning. Applied linguistics, 16 (3), 371-391.
Taguchi, N. (2007). Task difficulty in oral speech act production. Applied linguistics, 28 (1), 113-135.
Vygotsky, L.S. (1986). Thought and language. (A. Kuzolin Ed.). Cambridge, MA: MIT Press.
Widdowson, H. G. (1990). Aspects of language teaching. Oxford University Press.
Xu, F. (2016). Short-term working memory and chunking in SLA. Theory and Practice in Language Studies, 6 (1), 119-126.
Yoshimura, Y., & MacWhinney, B. (2007). The effect of oral repetition on L2 speech fluency: An experimental tool and language tutor. In Workshop on Speech and Language Technology in Education, 25-28.