Adaptive radiation of invasive asexual Daphnia
pulex in Japan: ecological implications of
clonal variations in phenotypic traits and
plasticity
著者
Tian Xiao Fei
学位授与機関
Tohoku University
学位授与番号
11301甲第19375号
Doctoral Thesis
Adaptive radiation of invasive asexual Daphnia pulex
in Japan: ecological implications of clonal variations in
phenotypic traits and plasticity
:
Tian Xiaofei
Graduate School of Life Sciences
Tohoku University
Content
Chapter I. General introduction ... 1
General Introduction ... 2
Chapter II. Evolution of asexual Daphnia pulex in Japan: variations and covariations of the digestive, morphological and life history traits ... 5
Introduction ... 6
Methods ... 7
Results ... 12
Discussion ... 14
Conclusions ... 18
Chapter III. Understanding the divergence of asexual Daphnia pulex: the implications of competition under limited food condition ... 34
Introduction ... 35
Methods ... 35
Results ... 41
Discussion ... 42
Chapter IV. Understanding the invasion and evolution of asexual Daphnia pulex: the rapid divergence in both trait means and plasticity promote the adaption to new environments .... 60
Introduction ... 61 Methods ... 62 Results ... 68 Discussion ... 72 Conclusions ... 75 References ... 105 Acknowledgement ... 117
2 General Introduction
Daphnia pulex is a species complex and common zooplankton in small lakes and ponds in
temperate regions (Hebert et al. 1989, Colbourne et al. 1998, Mergeay et al. 2006, Crease et al. 2012,Duggan et al. 2012, So et al. 2015, Ma et al. 2019). It contained at least 12 named lineages (1 in the pulex group, 9 in the pulicaria group, and 2 in the tenebrosa group) (Colbourne et al. 1998) and could switch reproductive mode between parthenogenetic (asexual) and sexual reproductions in response to changes in environmental conditions (Smirnov 2017). By sexual reproduction, they produce diapause eggs that play not only ecological roles for surviving unfavorable environmental conditions and dispersing to new habitats but also evolutional role for producing new genotypes by recombination. However, in a distinct lineage of this species called panarctic D. pulex (Fig. 1), individuals produce asexually even diapause eggs and thus can maintain the populations without sexual reproduction (Crease et al. 1989, Hebert et al. 1989). Since these obligate parthenogenesis individuals have no cost in sex (Innes et al. 2000), although it is questionable if they can adapt new habitats without recombination. In fact, asexual panarctic D. pulex that is North American origin has expanded their distribution to other continents. To date, as invading species, it has been reported in Africa (Mergeay et al. 2006), New Zealand (Duggan et al. 2012), China (Ma et al. 2019) and Japan (So et al. 2015). Invasive species are increasingly recognized as a lead threat to biodiversity worldwide (Walker and Steffen 1997, Mooney & Hobbs 2000, Sakai et al. 2001). Thus, uncovering ecological traits of the panarctic D. pulex in newly habitats would provide a chance to deepen our understandings on ecological and evolutional mechanisms behind the colonization success of invasive species.
In general, populations of invasive species are founded by a few common ancestral individuals. If heritable traits diverged among isolated populations that shared these common ancestral individuals, then we can describe evolution of the invasive species in new habitats. In addition, variations and covariations among heritable traits provide clues for identifying selective forces and understanding the evolution of these ecological traits (Spitze 1993, Lynch & Walsh 1998, Josephs 2017). Examination of the phenotypic and genetic variations among these invasive populations is, therefore, useful for unveiling ecological and evolutional processes that take place during the adaption of invasive species to new habitats (Lee 2002, Davidson et al. 2011).
In Japan, four asexual genetic lineages of panarctic D pulex (Colbourne et al. 1998), named JPN1-4 respectively, have distributed (So et al. 2015). All these lineages were thought to have started the invasion as a single genotype but at different times: JPN1 and JPN2 at several hundred to thousand years ago, while JPN3 and JPN4 at more recent time points (So et al. 2015). Several genotypes (clones) were found within JPN1 and JPN2 lineages but not yet in JPN3 and JPN4 lineages. The fact indicates that at least JPN1 and 2 have genetically evolved without genetic recombination after the invasion.
To clarify ecological and evolutionary mechanisms that allow asexual D. pulex to expand their distribution in Japan, in the 2nd chapter, I first examined heritability of life history, morphology and digestive traits using genotypes within JPN1 lineage that distributed most widely in Japan. Then, I examined variations and covariations among these traits to clarify clue of selective forces driving these variations. In addition, I examined how these variations were related with genetic distance among the genotypes. In the 3rd chapter, I examined strength of intra-specific competition among the genotypes of JPN1 lineage. I hypothesized that if they diverged to enlarge the niche, intra-specific competition should be weakened. To test this hypothesis, I performed competition experiments using several genotypes of the JPN1 lineage
by monitoring population dynamics of single and multiple genotypes for 60 days. In the 4th
chapter, to clarify rapidly evolved and genetically conservative traits, I compared magnitudes of variations in digestive, life history and morphological traits not only among genotypes within lineages but also between JPN1 and JPN2, that have the largest and second largest distribution ranges in Japan, respectively. I also examined if magnitude and direction of univariate and multivariate plasticity were the same among these different lineages. Based on these results I explored ecological and evolutionary mechanisms that allow for these asexual animals to rapidly adapt various habitats in Japan.
4
Chapter II. Evolution of asexual Daphnia pulex in Japan:
variations and covariations of the digestive, morphological and
6 Introduction
In nature, the abundance of Daphnia individuals is greatly influenced by a variety of environmental and biological factors, including interspecies interactions (McCauley & Murdoch 1990, Weetman & Atkinson 2002, Andras & Ebert 2013). Among these, predation is one of the important factors affecting Daphnia populations since it directly affects the survival rate (Brooks & Dodson 1965, Zaret 1980, Vanni 1987, Chang & Hanazato 2003) and indirectly affects reproduction when the survivors mature (Lynch 1977, Gliwicz & Boavida 1996). In addition, Daphnia populations frequently suffer from deficiencies in the quantity and quality of algal food (Lampert 1988, DeMott et al. 2001, Elser et al. 2001). Therefore, several studies have examined intraspecific or genotype-specific differences in morphological and life history traits of Daphnia species under different predation pressures (Spitze 1992, Boersma et al. 1998, Stoks et al. 2016) and food conditions (Lynch 1985, De Meester 1989, Tessier & Consolatti 1991, Spitze 1993, Prater et al. 2017). These studies showed that although the magnitude of variation caused by predators and food conditions differed among the phenotypic traits, the response of most traits was, to some extent, genotype specific. This suggests that at least some life history and morphological traits are heritable and that predation and food condition may have played crucial roles in selecting genotypes with different phenotypic traits, such as growth rate and maturation size.
To maximize their fitness under given food scarcity conditions with or without the presence of predators, animals must efficiently gain energy and nutrients from their food. Recent studies have suggested that in addition to a herbivore’s feeding rate and digestive capacity, digestive enzyme activity is important for the animal’s ability to cope with nutritionally suboptimal foods and maximize its fitness (Boersma et al. 2001, Urabe et al. 2018). Thus, under different food conditions, genotypes with different digestive capacities are likely selected. Previous studies have shown that digestive enzyme activities are highly associated with the expression of related genes (Koussoroplis et al. 2017, Schwarzenberger & Fink 2018). However, few studies have examined whether digestive enzyme activity differs among genotypes and is thus a heritable trait.
In obligate parthenogenetic organisms, such as asexual individuals of D. pulex, the variation and relationship among phenotypic traits have noticeable implications for their evolution (Holsinger & Ellstrand 1984). The substantial linkage of genes in asexual populations makes it impossible for a phenotypic trait to evolve independently of other traits (Hill & Robertson 1966, Lande 1984). Accordingly, genotypes that are successfully maintained
by given environmental conditions have likely both adaptive and non-adaptive traits (Barton & Turelli 1989, Spitze et al. 1991). If this is the case, then these traits are likely linked to each other across asexual genotypes. Conversely, if heritable differences in traits diverged evolutionally, without pleiotropic and epistatic effects (Stern & Orgogozo 2008), then it is likely that with an increasing number of base substitutions (mutations), the phenotypes will become more dissimilar among the genotypes. However, little is known about if and how life history, morphological and digestive traits are covaried in Daphnia (Spitze 1993) and how phenotypic differences in these traits are related to the genetic distance among genotypes.
To address these uncertainties, I examined the heritabilities of life history, morphology and digestive traits of D. pulex JPN1 genotypes. The heritability is a metrics measuring the degree of genetic attribute to a phenotypic resemblance between parental and offspring individuals in sexual organisms (Lynch & Walsh 1998). In the same sense, I used this term as the degree of genetic attribute to phenotypic similarity of a trait among asexual genotypes sharing the same ancestor individual.Our specific objectives were to clarify (1) if not only life history and morphology traits but also digestive traits are heritable, (2) how much these traits vary in response to changes in food conditions, (3) how much these traits covary with each other, and (4) if the magnitude of the phenotypic difference in heritable traits relates to individual genetic distance. By examining these variables, I explore the evolutionary ability of the phenotypic traits and ecological drivers that cause divergence in the phenotypes of a D.
pulex lineage after invading Japan.
Methods
Experimental materials
Four distinct genetic groups (JPN1- 4) of obligate parthenogenetic D. pulex are distributed in Japan (So et al. 2015). Among these, JPN1 is estimated to have invaded Japan several hundred to thousand years ago and consists of several haplotypes (So et al. 2015). In this study, I used five genotypes of the Daphnia pulex JPN1 lineage that were previously collected from ponds and small lakes in Japan and examined in So et al. (2015). Genotype A1 was collected from Lake Hataya Ohnuma (Yamagata Prefecture, latitude (N) 38.245º longitude (E) 140.204º), A3 from Osawa Tame-ike Pond (Miyagi Prefecture, N 38.439º E 140.919º), A5 from Furuichi Oike Pond (Tottori Prefecture, N 35.391º E 133.339º), A6 from Arigatani-ike Pond (Shizuoka
8
Prefecture, N 34.691º E 138.126º), and B from Daizahoshi-ike Pond (Nagano Prefecture, N 36.706º E 138.145º) (So et al. 2015).
Scenedesmus obliquus algae was cultured in a flow-through system with COMBO (Kilham
et al. 1998), a defined freshwater culture medium for algae and zooplankton, and was used as the food source for Daphnia cultures. Before their use, algal cells were harvested, and their cell density was quantified under an optical microscope (Olympus, Tokyo, Japan). According to the previously measured carbon content for an algal cell of S. obliquus (2.09×10⁻⁸ mg C cell -1), the appropriate amounts of algae were estimated for achieving a designed carbon food level and then used in experiments.
Individuals in each genotype, taken from a single mother that originated from genotypes maintained for several years in our laboratory, were cultured in 900 ml bottles containing 600
ml of COMBO with 2.0 mg C L-1 of S. obliquus in a controlled room (20 °C, photoperiod,
Light(L): Dark(D) 14:10). The individuals were transferred to fresh medium every other day and fed daily. The individual abundance in the culture bottles was adjusted to less than 1 individual 20 ml-1 in all the clones. Then, neonates born within 24 hours (hr) were collected from the 3rd brood produced by the cultured individuals and used for the following experiments.
Assay of digestive enzyme activity
In each genotype, 20 neonates were randomly chosen and individually placed into 50-ml stoppered bottles containing the growth medium COMBO with S. obliquus. Half of the
Daphnia were grown at a food concentration of 2.0 mg C L-1, and the other half were grown at
0.2 mg C L-1. The animals were fed daily and moved to new medium every two days. After a
4-day cultivation, on day 5, 10 individuals of each treatment were randomly collected. At least 5 individuals were used for the measurements of body length and body weight, and the remaining individuals were used for measuring digestive enzyme activity.
For measurements of body length and weight, 5-day-old animals were rinsed twice in distilled water and placed under a microscope where media was removed until the animals were properly positioned. Using an Olympus DP20 camera (Olympus, Tokyo, Japan) mounted on an Olympus SZH10 stereomicroscope (Olympus, Tokyo, Japan), images of Daphnia were captured at a magnification of 40×, and their body length from the base of the tail-spine to the top of the head was subsequently measured using ImageJ software (National Institutes of Health, Bethesda, USA). Then, they were individually transferred into a pre-weighed aluminium boat, dried for 24 hr at 60 °C, cooled for 12 hr in a vacuum desiccator at room
temperature, and weighed using a Mettler-Toledo UMX2 microbalance to the nearest 0.1 µg (Mettler-Toledo, Tokyo, Japan).
For assaying the digestive enzyme activities, the animals were rinsed several times with distilled water, homogenized with a micropestle in 200 µl of ice-cold Tris/HCl buffer (0.05 mol L-1, pH 8), and centrifuged for 10 minutes (min) at 14,000× gravitational acceleration (g) using a KUBOTA 1120 centrifuge (Kubota, Tokyo, Japan). The supernatant of the centrifuged samples was treated as an extract of a single animal for the analysis of beta-glucosidase (EC no. 3.2.1.21), lipase (3.1.1.3 and others), alkaline phosphatase (3.1.3.1), arginine amino-peptidase (3.4.11.6) and alanine amino-amino-peptidase (3.2.11.2). Assays were run at room temperature with 5 µl of substrate, 15 µl of sample extract and 230 µl of citrate-phosphate buffer (0.1 mol L-1, pH 5) (McIlvaine 1921) for beta-glucosidase or Tris/HCl buffer for alkaline phosphatase (0.05 mol L-1, pH 8) and other enzymes (0.05 mol L-1, pH 7), according to the protocol developed by Knotz et al. (2006). The substrates used in the enzyme assays were
4-methylumbelliferyl beta-d-glucoside (Sigma M3633) for beta-glucosidase,
4-methylumbelliferyl butyrate for lipase (Sigma 19362), L-arginine-7-amido-4-methylcoumarin hydrochloride (Sigma A2027) for arginine amino-peptidase, and L-alanine-4-methyl-7-coumarinylamide-trifluoroacetate (Sigma A4302) for alanine amino-peptidase. Stock solutions of these substrates were prepared in ethylene glycol monomethyl ether (5 mmol L-1). The concentration of these substrates in the assays was 100 µmol L-1. Fluorescence was measured at 360 nm (excitation) and 450 nm (emission) every 5 min for 35 min with a Fluoroskan Ascent microplate fluorometer (Thermo Fisher Scientific, Tokyo, Japan). Blanks were run in parallel. For preparing standard curves, 0~10 µmol L-1 of 4-beta-methylubelliferone (MUF) and 7-amino-4-methylcoumarin (AMC) were used (Knotz et al. 2006).
The water-soluble protein content of the animals was measured using a bicinchoninic acid assay (BCA) (Smith et al. 1985). Bovine serum albumin (BSA: 0, 50 mg L-1, 100 mg L-1) was used as the standard. For these measurements, 100 µL of supernatant from the centrifuged sample or BSA was mixed with 750 µL of the working reagent of the bicinchoninic acid kit (BCA1 SIGMA-ALDRICH) and incubated for 2 hr at 55 °C. The assays were read at 562 nm using a UV-1600 spectrophotometer (Shimadzu, Tokyo, Japan). Digestive enzyme activity was calculated corresponding to the average water-soluble protein content of each clone in a specific unit (nmol hr-1 mgprotein-1).
10
A growth experiment was performed at the two food concentrations mentioned above. For each food concentration, 10 neonates of each clone were individually grown in 50-ml stoppered bottles containing the growth medium COMBO with algal food as in the experiment for measuring digestive enzyme activities. In this study, the experiment lasted until they had produced the sixth brood. To ensure that the food particles were homogeneous in the suspension, the bottles were secured to a grazing wheel that rotated at a speed of 1 revolution per minute (rpm). The growth medium and algal food were changed every two days, and
Daphnia were fed daily.
When the growth medium was changed, images of the animals were captured as above and used for measuring the body length from the base of the tail-spine to the top of the head, the tail-spine length and the number of eggs in the brood pouch. In this study, maturation was defined as the time when the eggs first appeared in the brood pouch. The frequency of moulting casts (exuviae) and the size of newly released neonates were also counted and removed from the bottle.
The von Bertalanffy growth curve was applied for estimating the asymptotic body length
L∞ and growth coefficient k as follows:
Lt = L∞ × {1-exp [-k (t-t0)]},
where Lt is the body length at age t (days), t0 is the hypothetical age at ‘0’ body length.
Genetic analysis
To estimate the phylogenetic relationships and the genetic distances among Daphnia clones, I used genetic data acquired from our whole-genome sequencing as described below. Fifty to seventy individuals of each clone were used for DNA extraction conducted using a
Maxwell(R) 16 instrument and Maxwell(R) 16 LEV Plant DNA Kit (Promega). Construction of
the library and sample sequencing were performed at the Beijing Genomics Institute (BGI) JAPAN (Kobe, Japan). The libraries were constructed by a unique method of BGI JAPAN (low input method) from more than 500 ng of DNA per sample. The libraries were sequenced on an
Illumina Hiseq XTM Ten platform (Illumina, San Diego, CA, USA) using a paired-end 150 bp
(PE150) strategy to obtain approximately 8 Gb data/sample (approximately 40x coverage). The data were filtered using MapReduce acceleration-supported (SOAPunke) software (Chen et al. 2018) with the following options: -n 0.1, -l 10, -q 0.5, -i and -A 0.5. Reads of the individual FASTQ files were mapped to the reference genome data of D. pulex isolate PA42 (Ye et al. 2017) using burrows-wheeler alignment (BWA) (Li & Durbin 2009). Removal of potential
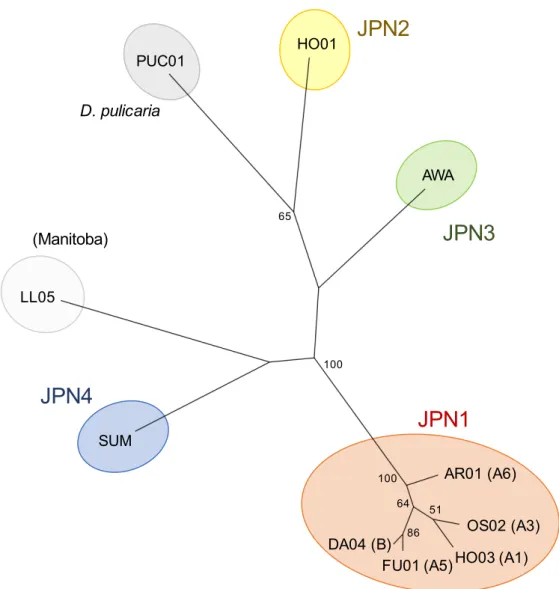
polymerase chain reaction (PCR) duplicates and detection of polymorphisms in the data were conducted using sequence alignment/map(SAM)tools (Li et al. 2009). The proportion of different sites (uncorrected p-distance) was calculated using sequence data (135933993 base-pairs (bps)) with a > 20 quality score as the pairwise genetic distances among clones. To clarify the phylogenetic relationship among clones, I constructed an unrooted phylogenetic tree by the maximum likelihood (ML) method using SNP data with SNPhylo (Lee et al. 2014). In this tree, I included several genotypes used in So et al.(2015) other than JPN1 clones: D. pulex JPN2 (HO01) was collected from Lake Hataya Ohnuma (Yamagata Prefecture, N 38.245º E 140.204º), JPN3 (AWA) from Lake Awaji nariai-ji (Hyogo Prefecture, N 34.283º E 134.809º) and JPN4 (SUM) from Sumiyoshi ike Pond (Kagoshima Prefecture, N 31.772º E 130.592º), a genotype of D. pulex (LL05) was collected from a small lake in Manitoba, Canada (longitude/latitude unknown), and D. pulicaria (PUC01) was collected from Lake Biwa (Shiga Prefecture, N 35.176º E 136.979º).
Statistical analysis
In this study, I measured a total of 17 phenotypic traits for each of the 5 clones (genotypes) that were grouped and categorized as enzyme activity (five traits), life history traits (seven traits) and morphological traits (five traits) (Table 1). A two-way analysis of variance (ANOVA) was used to examine the effects of genotype, food level, and their interaction (GxF) on each of the phenotypic traits. Significant effects were determined at p<0.05, and a level was adjusted by a Bonferroni correction when multiple tests were performed. In these analyses, genotype and GxF were set as random factors, food level was set as a fixed factor, and variance components were estimated using the restricted maximum likelihood (REML) parameter. Before the analysis, a log-transformation was performed for beta-glucosidase, alkaline phosphatase, arginine amino-peptidase, maturation age, mean egg number of the first three clutches and body length at five days, and a two-step transformation algorithm (Templeton 2011) was performed for intermoult duration before maturation to stabilize the variance.
Broad-sense heritability (H2) for each trait was calculated as follows: H2 = Vg /VT,
where Vg is the genetic variance and VT is the total phenotypic variance (Lynch & Walsh 1998). The 95% confidence interval (CI) of heritability for each trait was estimated using the
12
according to Holland et al. (2003). Then, the coefficient of genetic variation (CV) was calculated as follows:
CV= Vg0.5 / µ,
where µ is the mean value of given phenotypic traits.
To detect the relationships among traits, I first estimated the best linear unbiased predictors (BLUPs) of genotype values (sample number = 5 clones Table S5) for each trait based on the analysis above. Then, PCA was estimated using the BLUPs of heritable traits. Components with eigenvalues greater than 1.0 have been extracted to explain the variability of phenotypic traits. I used the BLUPs since these are more robust to unbalanced replication and less biased by environmental effects than the genotype mean values (Shaw 1995).
I examined the relationship between phenotypic dissimilarity and genetic distance among five genotypes. For this, I estimated the standardized Euclidean distance using the BLUPs of each trait. The distance was estimated for overall traits, traits in each category and single traits. Individual genetic distance was estimated using uncorrected p-distances by pairwise comparisons of the genome sequences between genotypes. Then, I examined the relationship between two matrices of genomic and phenotypic traits by a Mantel test.
These statistical tests were conducted with Statistical Product and Service Solutions (SPSS) statistics version 21.0 (International business machines corporation (IBM), Armonk, USA) and R version 3.3.3 (R Core Team 2017).
Results
Effects of genotype and food level on phenotypic traits
Both genotype (G) and food level (F) significantly affected 11 out of 17 traits (Table 1). Conversely, the growth coefficient k and the body length at maturation and at day 5 only differed among genotypes, the intermoult duration before maturation differed between food levels, and the lipase activity and intermoult duration after maturation did not differ among genotypes or food levels (Table 1). Compared with these main effects, significant interaction effects of genotype and food level (GxF) were found for a limited number of traits including beta-glucosidase and phosphatase activities for digestive traits and neonate size for morphological traits. Variances explained by genotype and food level differed highly among the traits. For example, >60% of the variation in day 5 body length and relative tail-spine length
were explained by the genotype, while the large variations in beta-glucosidase, arginine amino-peptidase, mean egg number, maturation age and maximum body length were explained by the present food level (Table 1). Thus, the effects of genotype and food level varied among the traits, even within the same trait category. However, on average, the proportion of the variance that was explained by the genotype was greater in morphological traits (mean 39.50%) than in either digestive traits (mean 6.28%) or life history traits (mean 10.66%) (Table 1).
Heritability and genetic variance
Broad-sense heritability varied highly among the traits and ranged from 0 to 0.91 with a mean of 0.33 (Table 2). Among the three trait categories, heritability greater than 0.5 was often found in morphological traits but not in life history traits. Digestive traits showed relatively high heritability, except for lipase activity. The coefficients of genetic variation for the digestive traits were comparable to those of the morphological traits and were generally higher than those of the life history traits. In life history traits, maturation age showed the highest heritability, followed by maturation size and the growth coefficient (k). Since heritability was less than 0.1 for the intermoult durations of mature and immature individuals, and lipase activity showed no significant difference among the genotypes, I excluded these traits from the following analyses.
Relationship among phenotypic traits
Relationships among the traits were examined by principal component analysis (PCA) using best linear unbiased predictors (BLUPS). The first three components explained 93% of the variation in the traits examined. The eigenvectors of traits for each PCA showed that most of the life history traits contributed to the PC1, while most of the morphological traits contributed to the PC2. Digestive traits were not clustered together but distributed into different PCs (Table 3): alkaline phosphatase and arginine amino-peptidase activities were strongly and moderately related to PC1, while alanine amino-peptidase and beta-glucosidase activities were negatively related to PC2 and PC3, respectively. The scores of these PCs were largely different among genotypes, indicating that a suite of these phenotypic traits differed among the genotypes (Fig. 1).
14
I estimated pairwise genetic distance among the genotypes according to their phylogenetic relationships (Fig. S1 and Table S1). Then, I examined the relationships between the genetic distance and phenotypic differences in the overall traits, the trait groups (Table S2) and single traits (Table S3). No significant relationships were found between the genetic distance and any type of phenotypic trait examined (Fig. 2 and Table S4).
Discussion
This study showed large variations in the expression of phenotypic traits among five asexual genotypes belonging to the JPN1 clade of D. pulex (as defined in So et al. (2015)). Most of these phenotypic traits were significantly different among the genotypes and were heritable. So et al. suggested that these genotypes share the ancestral clone that originally invaded Japan (So et al. 2015). In addition, So et al. (2015) used a known mutation rate of mitochondrial deoxyribonucleic acid (mtDNA) (Xu et al. 2012) and number of base substitutions among JPN1 genotypes to estimate that an ancestral clone of the JPN1 clade arrived in Japan 680~2280 years ago (So et al. 2015). Although this estimation has large uncertainty, it is not divergent from the phylogenetic relationship constructed from the data of 5282 single nucleotide polymorphisms (SNPs) in this study; therefore, these genotypes certainly share the same ancestral genotype. The possibility cannot be ruled out that different genotypes invaded Japan from a remote habitat by a single event or vector. However, if this were the case, then these genotypes were phenotypically similar to each other since they were produced from obligate parthenogenesis and likely invaded from a native habitat with a unique set of selection forces. Thus, considering the large variation in the heritable phenotypic traits, it is likely that the JPN1 genotypes ecologically diverged with various phenotypic traits since they invaded Japan.
Heritability of Daphnia traits
According to Mousseau & Rolf (1987), who examined data from 75 species, the heritability of physiological traits is the same as that of morphological traits, which are both higher than that of life history traits. In general, it is expected that the responses of morphological and physiological traits to selection are faster than those of life history traits since the number of genes related to phenotypic variations are likely smaller in the former
(Merilä & Sheldon 1999). Since digestive enzyme activity is a physiological trait, it seems to be regulated by fewer genes compared with life history traits. Indeed, recent studies have shown that some digestive enzyme activities are highly related to the expression of a limited number of genes (Koussoroplis et al. 2017, Schwarzenberger & Fink 2018). Nonetheless, contrary to expectations, the heritability of the enzyme activities examined was lower than that of the morphological traits, although some of these showed slightly higher heritability than the life history traits. In this study, I estimated broad-sense heritability in asexual D. pulex genotypes since narrow-sense heritability is meaningless for asexual organisms (Lynch & Walsh 1998). Thus, caution is needed in understanding the implications of the heritability examined (Ebert 1993). The low heritability determined in this study means that the variation is relatively lower among genotypes than among individuals within the genotypes. If all the genotypes have evolved under the same food environmental conditions, the digestive enzyme activities should have converged to the same levels among the genotypes. In addition, if food conditions vary temporally, it is disadvantageous for animals to evolve specific digestive traits. In nature, the abundance and species composition of algae that Daphnia prey on change not only seasonally but also spatially depending on trophic conditions (Huszar & Caraco 1998). Accordingly, although most of the enzyme activities were significantly different among genotypes, their heritability and thus their variation among the genotypes would be limited. Note that this differs somewhat from morphological and life history traits; digestive traits were related to different PCs depending on the following enzymes: lipase, alkaline phosphatase and arginine amino-peptidase activities were related to PC1, while alanine amino-peptidase and beta-glucosidase were related to PC2 and PC3, respectively. These results suggest that JPN1 genotypes have evolved under variable food conditions that impeded genetic linkage among digestive traits.
Genetic relations of traits and selective forces
In this study, 93% of the variation in phenotypic traits among the JPN1 clones was summarized by the first three PCs in the principal component analysis, suggesting that the direction of these variations is not random but converged into a few directions. The phenotypic traits, maturation age, instar and size, egg numbers for the first several clutches, and asymptotic size (L∞) were positively correlated with each other. These results imply that clones that matured at an earlier age were of smaller size and produced a smaller number of eggs per clutch. These relationships suggest that maturation instar and size, egg number in the first several
16
clutches and asymptotic size are determined solely by age when the Daphnia JPN1 clones mature. Thus, differences in these traits among clones may be a result of pleiotropic effects of mutation(s) that occurred in maturation-related genes, such as hormone genes and other endocrine genes (Flatt 2005), rather than the additive effects of multiple genes related to maturation.
Among the heritable digestive enzyme activities, alkaline phosphatase was positively related to maturation and clutch sizes. A similar result was obtained for arginine amino-peptidase activity, but its relation with PC1 was not as strong. It should be noted that alkaline phosphatase was not limited to digestive enzymes (Wojewodzic 2011). However, since phosphorus is a key element for promoting body mass synthesis (Sterner & Elser 2002), genotypes with greater alkaline phosphatase activity may have been able to mature at larger sizes and produce larger numbers of eggs. This possibility implies that genes that regulate digestive enzyme activities are functionally linked with those regulating maturation.
Studies have shown that maturation size is a crucial factor in determining the colonization success of Daphnia in given habitats (Gliwicz & Boavida 1996, Culver & Kerfoot 1980, Leibold & Tessier 1991). In aquatic ecosystems, most zooplanktivorous fish prey preferentially on large zooplankton individuals (Werner & Hall 1974, Zaret & Kerfoot 1975). Therefore, in habitats inhabited by fish, individuals with early maturation have a higher probability of producing offspring (Zaret & Kerfoot 1975, Zaret 1980, Beckerman et al. 2010). In addition, it may be advantageous for Daphnia individuals not to grow continually and thus to have a small asymptotic size (L∞) for maximizing their fitness in habitats with planktivorous fish. Heritable differences in maturation age and size suggest that habitat-specific variations in predation pressures may have acted as a selective force for the diverging JPN1 genotypes.
Apart from life history traits, most morphological traits such as body size (length and weight) at day 5, neonate size, tail-spine length and growth coefficient (k) were positively related to the 2nd PC. These results imply that genotypes with higher growth rates produce larger neonates with longer tail-spines. In small lakes and ponds where planktivorous fish were not yet abundant or were absent due to temporal drying or summer or winter kills (Brönmark et al. 1999), invertebrate predators such as midge larvae often dominated (Dodson 1974, Gliwicz 1994). Since these invertebrate predators prey on small zooplankton, Daphnia individuals who rapidly attain larger sizes by postponing maturation have an advantage in reducing predation risk (Zaret & Kerfoot 1975, Hall et al. 1976, Lynch 1977). In addition, a longer tail-spine is known to be effective for Daphnia individuals to defend against predation by invertebrate predators (McCauley & Murdoch 1990, Laforsch & Tollrian 2004). Thus, being
larger at birth and developing longer tail-spines seem to be a defensive strategy against invertebrate predation. As above, I argue that early maturation is a life history strategy for reducing size-specific mortality imposed by fish predation. However, these life history traits are not correlated with those of morphological traits in JPN1 genotypes. This fact suggests that traits for reducing predation risks from planktivorous fish and from invertebrate predators may have evolved separately among the D. pulex JPN1 genotypes.
Among the enzyme activities measured, the alanine amino-peptidase activity was negatively related to PC2, indicating that genotypes with higher growth rates had reduced activity of the enzyme. Thus, the difference in the activity of this enzyme among genotypes may be a result of a decrease in activity associated with increasing body size. Nonetheless, this covariation is somewhat puzzling since animals with higher growth rates should require more nitrogen (Anderson & Pond 2000, Raubenheimer et al. 2009). One possibility is that in nature,
D. pulex JPN1 genotypes may have experienced protein deficiencies in different manners.
Although the cultured algae used in this study were sufficient in terms of nitrogen content relative to the demand of Daphnia (Urabe et al. 2018), algal elemental and organic matter contents vary highly in natural lakes (Ahlgren et al. 1997, Elser et al. 2000, Elser et a. 2001). Thus, JPN1 genotypes with high digestive enzyme activity for amino acids may have been selected under food conditions that were deficient in protein. Alternatively, but not exclusively, in nature, Daphnia often experience deficiencies in biologically important chemicals such as phosphorus and essential fatty acids (Elser 2001, Urabe et al. 2018). Under such conditions, it is disadvantageous for individuals to have high nitrogen digestion abilities since they have to then dispose of excess, assimilated chemicals to maintain their body stoichiometry (Urabe & Sterner 2001, Darchambeau 2003, Anderson et al. 2005, Suzuki-Ohno et al. 2012). This possibility implies that JPN1 genotypes with low digestive enzyme activities for amino acids may have been selected under food conditions that were rich in proteins to increase their growth rates and tail-spine lengths to overcome invertebrate predation risks.
In this study, only beta-glucosidase activity was related to PC3. Since I could not rule out the possibility that this trait was directly or indirectly related to other traits that were not examined in this study, it was difficult to identify selective agents causing the genetic variation of this trait. However, the results showed that variation in this trait had evolved irrespective of the selective pressures posed by predators.
18
Although a number of studies have examined how phenotypic differentiation is related to genetic differentiation in populations (Spitze 1993, Reed & Frankham 2001, Leinonen et al. 2008), few have examined how phenotypic dissimilarities are related to genomic differences among individuals. If variations of heritable phenotypes occurred mainly due to mutations in additive genes or polygenes, then it is expected that increasing heritable genomic differences will result in increasingly dissimilar heritable phenotypes. Relatedly, Burstin & Charcosset (1997) argued that relationships between genetic distances gauged by neutral genetic markers and phenotypic differentiation should follow a triangular pattern since large phenotypic variations are associated with large genetic variations, while small phenotypic variations are not always associated with small degrees of genetic variation. However, if large phenotypic variations emerge mainly as a result of pleiotropic effects of mutations in regulatory gene(s), then phenotypic differences would not relate to genomic distance. Supporting the latter case, neither the pairwise dissimilarities of any phenotypic categories nor the pairwise differences of any single phenotypic traits were significantly related to the pairwise genetic distances at the whole genome level (Fig. 2 and Table S4). Plots of the phenotypic differences and dissimilarity against the genetic distance did not show the triangular pattern. Although our data are limited, the results suggest that large phenotypic variants of JPN1 clones have evolved mainly due to the pleiotropic effects of a limited number of mutations rather than a gradual accumulation of mutations in additive genes and polygenes.
Conclusions
This study showed that D. pulex JPN1 evolved divergent traits without genetic recombination for several hundred to thousand years since their ancestral clone originally invaded Japan. Variations in heritable traits suggest that predation pressures and food environments have played roles in the divergence and selection of these clones. Moreover, the relationship among these traits support the view that large phenotypic differences among JPN1 genotypes likely occurred mainly by pleiotropic effects of a limited number of mutated genes, rather than an “adaptive character complex” that was created by natural selection favouring certain combinations of genetically independent traits through independent mutations and recombination (Endler 1995). Similar to the present results, a lineage of Daphnia pulex and a green alga Caulerpa racemosa have successfully invaded and expanded their distributions in Africa (Mergeay 2006) and in the Mediterranean (Durand 2002), respectively, although they also do not reproduce sexually. The success of asexual organisms in new habitats is often
attributable to their plasticity in phenotypic traits (Richards 2006). However, regardless of the magnitude of the plasticity, asexual individuals have limited adaptive capacity if their niche is frozen (Vrijenhoek 1979, Pound et al. 2004). Other than such phenotypic plasticity, Lee (2002) suggested that genetic architecture within a genotype promoting high degrees of evolvability is a prerequisite for successful colonization by invasive species. This study supports such a view: a genetic architecture allowing for variations and covariations in heritable phenotypic traits present in D. pulex JPN1, which was established before invading Japan, may have produced various genotypes in the lineage that could adapt rapidly to a variety of novel lakes and ponds in Japan without genetic recombination by sexual reproduction. It is necessary to identify mutated genes among JPN1 clones to uncover the genetic architectures and linkages that promote such phenotypic divergence.
20
Fig. 1. Results of PCA showing a biplot of PC scores of JPN1 genotypes (A1, A3, A5, A6 and B) and loadings of phenotypic traits (Glu: beta-glucosidase; Phos: alkaline phosphatase; Arg: arginine amino-peptidase; Ala: alanine amino-peptidase; Age: maturation age; Instar: maturation instar number; MBL: maturation body length; k: growth coefficient; Eggn: mean egg number of the first three clutches; Neonate: mean neonate size of the first three clutches; Bl5: body length at five days; Bw5: body weight at five days; Tail: relative tail-spine length of the first adult instar;L∞: asymptotic body length). Panels A and B represent biplots of the PC1 and PC2, and the PC1 and PC3, respectively.
Fig. 2. Relationship between genetic distance and phenotypic distance in different trait types between Daphnia pulex clones. Among these, A, D, G, and J showed the relations at the food concentrations of 2.0 mg C L-1, B, E, H, and K showed the relations at the food concentrations of 0.2 mg C L-1, and C, F, I, and L showed the relations in the combined data. The correlation coefficient (r) and probability of significance (p) in the Mantel test are shown in each panel.
22
Fig. S1. Phylogenetic relationships of five clones in JPN1 lineage and other clones. This is based on 5282 SNPs from whole genome sequence data. Using data with quality scores higher than 20, a phylogenetic tree of the clones by the maximum likelihood (ML) method were constructed using SNPhylo pipeline (Lee et al. 2014). Numbers on branches indicate bootstrap values (>50% are shown). In this analysis, I included genotypes used in So et al. (2015) other than D. pulex JPN1 clones. These are D. pulex JPN2 (HO01), JPN3 (AWA) and JPN4 (SUM) and a genotype of D. pulex (LL05) collected from a small lake in Manitoba, Canada, and D.
pulicaria (PUC01) collected from Lake Biwa.
AR01 (A6) DA04 (B) HO03 (A1) FU01 (A5) OS02 (A3)
JPN1
PUC01 SUM D. pulicariaJPN4
AWA HO01 LL05 (Manitoba)JPN2
JPN3
65 51 100 86 64 100Table 1. The effects of genotype, food level, and their interaction on phenotypic traits in Daphnia pulex. The means and ranges of these traits examined for
Daphnia JPN1 are shown with the variance components of each effect (Var %). Statistically significant p-values (<0.05) are shown in bold.
Genotype Food Genotype × Food
Trait Mean Range F-value p Var % F-value p Var % F-value p Var %
Digestive
Beta-glucosidase (nmol hr-1 mg
protein-1) 322.8 93.9-680.6 10.56 < 0.001 4.42 260.46 < 0.001 83.19 4.32 0.03 1.77
Lipase (nmol hr-1 mgprotein-1) 1949.4 1212.0-2789.4 1.61 0.95 0.00 0.02 1.00 0.00 0.99 1.00 0.00
Alkaline phosphatase (nmol hr-1 mgprotein-1) 764.47 325.5-1526.2 13.83 < 0.001 2.08 37.56 < 0.001 35.41 6.15 0.01 20.83
Arginine amino-peptidase (nmol hr-1 mgprotein-1) 195.93 67.0-578.5 6.46 0.01 8.80 125.17 < 0.001 80.00 0.38 1.00 0.00
Alanine amino-peptidase (nmol hr-1 mgprotein-1) 178.05 82.9-310.1 11.75 < 0.001 16.12 106.94 < 0.001 59.16 0.68 1.00 0.40
Life history
Maturation age (days) 7.62 5.00-12.00 9.48 < 0.001 12.55 96.81 < 0.001 65.21 0.20 1.00 0.00
Maturation instar number 3.14 1.00-6.00 4.66 0.02 10.40 36.65 < 0.001 45.60 0.96 1.00 0.09
Maturation body length (mm) 1.61 1.32-1.90 6.45 < 0.001 23.57 7.52 0.09 14.35 0.74 1.00 0.00
Intermoult duration before maturation (days) 1.94 1.50-4.50 1.62 1.00 4.21 9.56 0.03 20.20 0.05 1.00 0.00
Intermoult duration after maturation (days) 2.31 2.00-2.67 1.65 1.00 0.00 3.10 0.88 4.98 2.61 0.44 11.20
k 0.11 0.06-0.17 5.57 0.009 19.40 3.60 0.81 0.05 1.61 1.00 0.05
Mean egg number of the first three clutches 6.19 1.67-12.50 7.78 < 0.001 4.51 177.12 < 0.001 76.21 2.78 0.33 3.99
Morphology
Mean neonate size of the first three clutches
(mm) 0.63 0.50-0.78 10.28 < 0.001 1.47 19.59 < 0.001 13.64 8.43 < 0.001 29.32
Body length at five days (mm) 1.29 0.98-1.54 21.26 < 0.001 64.66 2.16 0.30 1.37 1.18 0.67 1.64
Body weight at five days (mg) 0.02 0.006-0.03 15.52 < 0.001 47.37 11.84 0.001 15.79 1.72 0.34 5.26
Relative tail spine length of the first adult instar 0.19 0.10-0.25 41.78 < 0.001 75.67 18.87 < 0.001 0.00 2.49 0.66 5.88 L∞ (mm) 2.45 1.89-3.10 12.09 < 0.001 8.33 158.07 < 0.001 70.43 3.35 0.22 5.24
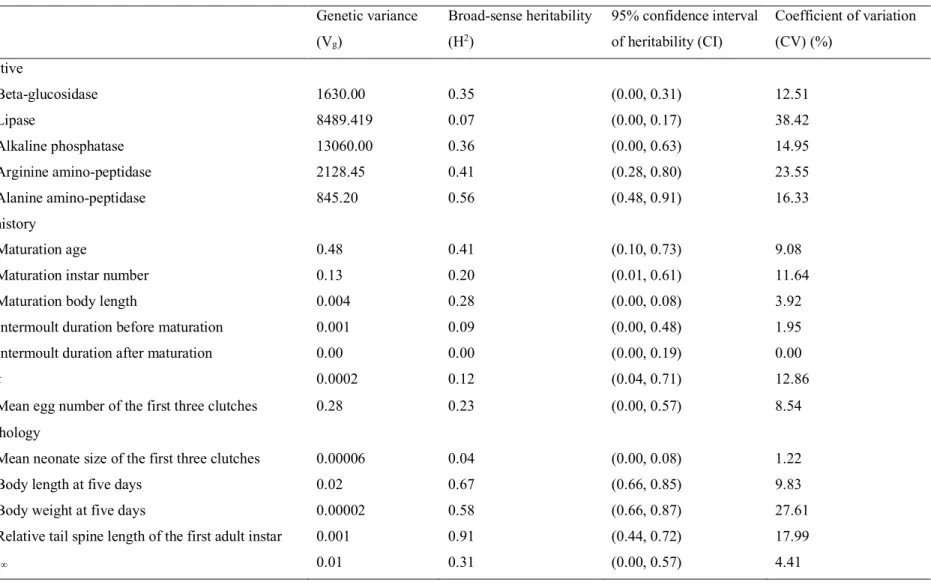
Table 2. Genetic variance, broad-sense heritability, 95% confidence interval of heritability and coefficient of variation for 17 Daphnia phenotypic traits.
Trait Genetic variance
(Vg) Broad-sense heritability (H2) 95% confidence interval of heritability (CI) Coefficient of variation (CV) (%) Digestive Beta-glucosidase 1630.00 0.35 (0.00, 0.31) 12.51 Lipase 8489.419 0.07 (0.00, 0.17) 38.42 Alkaline phosphatase 13060.00 0.36 (0.00, 0.63) 14.95 Arginine amino-peptidase 2128.45 0.41 (0.28, 0.80) 23.55 Alanine amino-peptidase 845.20 0.56 (0.48, 0.91) 16.33 Life history Maturation age 0.48 0.41 (0.10, 0.73) 9.08
Maturation instar number 0.13 0.20 (0.01, 0.61) 11.64
Maturation body length 0.004 0.28 (0.00, 0.08) 3.92
Intermoult duration before maturation 0.001 0.09 (0.00, 0.48) 1.95
Intermoult duration after maturation 0.00 0.00 (0.00, 0.19) 0.00
k 0.0002 0.12 (0.04, 0.71) 12.86
Mean egg number of the first three clutches 0.28 0.23 (0.00, 0.57) 8.54
Morphology
Mean neonate size of the first three clutches 0.00006 0.04 (0.00, 0.08) 1.22
Body length at five days 0.02 0.67 (0.66, 0.85) 9.83
Body weight at five days 0.00002 0.58 (0.66, 0.87) 27.61
Relative tail spine length of the first adult instar 0.001 0.91 (0.44, 0.72) 17.99
Table 3. Factor loading, eigenvalue and variance explained by the BLUPs of heritable phenotypic traits in the principal component analysis. Components with eigenvalues greater than 1.0 have been extracted to explain the variability of phenotypic traits. The loading scores greater than 0.80 and the highest compared to each of the other components are shown in bold.
Component
Phenotypic traits 1 2 3
L∞ 0.99 0.05 0.10
Maturation age 0.93 -0.36 0.05
Maturation body length 0.92 0.39 0.08
Mean egg number of the first three clutches 0.91 0.00 -0.10
Alkaline phosphatase 0.89 -0.45 0.07
Maturation instar number 0.87 -0.33 0.34
Arginine amino-peptidase 0.62 -0.53 0.19
Body length at five days 0.01 0.93 0.33
Mean neonate size of the first three clutches 0.25 0.93 0.19
Body weight at five days -0.20 0.91 -0.10
Relative tail spine length of the first adult instar -0.07 0.91 0.41
Alanine amino-peptidase 0.36 -0.84 -0.14
k -0.39 0.84 -0.36
Beta-glucosidase -0.14 -0.30 -0.91
Eigenvalue 7.33 4.62 1.12
Variance contribution rate (%) 52.35 33.03 8.03
26
Table S1. Genetic distance measured by proportion of different sites (p-distance) among Daphnia pulex JPN1 genotypes (A1, A3, A5, A6 and B).
Genotype A3 A5 A6 B
A1 1.75.E-03 1.66.E-03 1.85.E-03 1.72.E-03
A3 1.70.E-03 1.88.E-03 1.73.E-03
A5 1.92.E-03 1.41.E-03
Table S2. Distance of phenotypes in each category among Daphnia pulex JPN1 genotypes (A1, A3, A5, A6). The phenotypic distance was calculated using difference in BLUPs between clones.
2.0 mg C L-1 0.2 mg C L-1 Combined
Trait type Genotype A3 A5 A6 B A3 A5 A6 B A3 A5 A6 B
Digestive A1 3.25 3.24 3.54 4.03 3.27 2.46 1.93 4.28 3.07 2.19 2.34 4.22 A3 2.13 0.97 1.52 2.56 2.35 3.35 2.20 2.10 3.43 A5 2.44 3.20 1.77 2.11 2.16 2.52 A6 1.08 3.10 3.24 Life history A1 1.66 2.17 1.51 3.76 2.42 2.90 3.29 4.19 1.25 2.96 2.60 4.40 A3 1.32 0.79 4.40 2.41 2.58 3.34 2.07 1.53 4.36 A5 1.44 4.33 2.03 2.86 1.75 4.06 A6 4.57 4.64 4.90 Morphology A1 3.81 3.60 4.24 4.36 3.68 3.26 4.87 4.60 4.12 4.14 5.14 4.79 A3 1.31 2.94 2.97 1.15 2.16 2.19 0.73 1.30 2.30 A5 1.98 2.38 2.30 2.70 1.39 2.61 A6 2.85 2.76 2.63 All A1 5.28 5.31 5.73 7.03 5.63 5.17 6.31 7.66 5.28 5.54 6.21 7.75 A3 2.72 3.43 5.47 3.72 4.12 5.22 3.15 3.11 6.11 A5 3.46 5.89 3.56 4.48 3.11 5.45 A6 5.49 6.22 6.44
Table S3. Distance of single phenotypes among Daphnia pulex JPN1 genotypes (A1, A3, A5, A6 and B). The phenotypic distance was calculated using difference in BLUPs between genotypes.
2.0 mg C L-1 0.2 mg C L-1 Mixture Trait Genotype A3 A5 A6 B A3 A5 A6 B A3 A5 A6 B Beta-glucosidase A1 144.59 102.49 128.61 124.11 123.43 15.31 10.53 28.29 73.98 20.15 28.19 21.52 A3 42.10 15.98 20.48 138.74 133.96 151.72 53.83 45.79 52.46 A5 26.13 21.62 4.78 12.98 8.04 1.37 A6 4.51 17.76 6.67 Lipase A1 - - - - 175.10 180.60 274.78 59.92 101.77 92.10 113.83 2.67 A3 - - - 5.49 99.67 115.18 9.67 12.06 104.44 A5 - - 94.18 120.68 21.73 94.77 A6 - 214.85 116.50 Alkaline phosphatase A1 16.93 55.86 22.51 65.96 106.72 273.04 2.34 716.08 26.35 35.13 7.30 163.17 A3 72.79 5.58 49.03 166.32 109.06 609.36 0.00 8.78 19.05 136.82 A5 78.37 121.82 275.38 443.04 8.78 0.00 27.84 128.04 A6 43.45 718.42 19.05 27.84 0.00 155.88 Arginine amino-peptidase A1 23.98 37.63 28.14 38.11 43.06 112.85 30.18 149.72 17.00 37.82 0.22 47.15 A3 13.65 4.16 14.13 69.79 73.24 106.65 20.81 17.22 30.15 A5 9.48 0.48 143.03 36.87 38.03 9.33 A6 9.97 179.90 47.36 Alanine amino-peptidase A1 16.96 12.86 47.15 47.06 43.16 36.63 58.65 82.46 32.19 26.75 58.39 70.83 A3 4.11 30.19 30.10 6.53 15.49 39.30 5.44 26.19 38.63 A5 34.30 34.20 22.02 45.83 31.64 44.08 A6 0.09 23.81 12.44 Maturation age A1 0.29 0.1 0.03 1.39 0.12 0.28 0.2 1.14 0.23 0.26 0.14 1.47 A3 0.19 0.32 1.1 0.17 0.32 1.02 0.03 0.37 1.24 A5 0.13 1.29 0.48 0.86 0.4 1.2 A6 1.42 1.34 1.61
Maturation instar number
A1 0.07 0.05 0.05 0.39 0.24 0.25 0.33 0.65 0.09 0.18 0.15 0.65
A3 0.03 0.03 0.31 0.49 0.09 0.89 0.27 0.06 0.74
A5 0.00 0.34 0.58 0.4 0.33 0.46
Continue
2.0 mg C L-1 0.2 mg C L-1 Mixture
Trait Genotype A3 A5 A6 B A3 A5 A6 B A3 A5 A6 B
Maturation body length
A1 0.05 0.05 0.07 0.06 0.04 0.07 0.12 0.01 0.05 0.08 0.12 0.03
A3 0.0007 0.02 0.11 0.03 0.08 0.03 0.02 0.06 0.08
A5 0.02 0.11 0.05 0.06 0.04 0.1
A6 0.13 0.11 0.14
Intermoult duration before maturation
A1 0.00 0.00 0.00 0.00 0.09 0.07 0.04 0.02 0.02 0.01 0.01 0.01
A3 0.00 0.00 0.00 0.16 0.05 0.07 0.03 0.01 0.01
A5 0.00 0.00 0.11 0.09 0.02 0.02
A6 0.00 0.01 0.001
Intermoult duration after maturation A1 0.04 0.01 0.04 0.001 0.1 0.14 0.12 0.1 - - - - A3 0.05 0.08 0.04 0.04 0.02 0.0006 - - - A5 0.03 0.01 0.01 0.04 - - A6 0.04 0.02 - k A1 0.0022 0.0072 0.0009 0.0177 0.0161 0.0384 0.0329 0.0376 0.0061 0.0223 0.0149 0.0276 A3 0.0094 0.0012 0.0198 0.0224 0.0168 0.0215 0.0163 0.0089 0.0216 A5 0.0081 0.0105 0.0055 0.0008 0.0074 0.0053 A6 0.0186 0.0047 0.0127
Mean egg number of the first three clutches
A1 1.72 2.46 1.07 1.25 0.85 0.24 0.16 0.96 0.11 0.37 0.14 0.43
A3 0.74 0.66 2.98 0.61 0.69 0.11 0.26 0.03 0.54
A5 1.4 3.72 0.08 0.72 0.23 0.8
A6 2.32 0.8 0.57
Mean neonate size of the first three clutches
A1 0.0063 0.0044 0.0008 0.0033 0.079 0.1079 0.1317 0.0821 0.005 0.0058 0.0058 0.0044
A3 0.0019 0.0071 0.003 0.0289 0.0528 0.0031 0.0008 0.0008 0.0006
A5 0.0052 0.001 0.0238 0.0258 2E-06 0.0013
A6 0.0041 0.0496 0.0014
Body length at five days
A1 0.27 0.27 0.32 0.31 0.20 0.12 0.27 0.21 0.25 0.21 0.32 0.28
A3 0.01 0.06 0.05 0.04 0.04 0.03 0.04 0.07 0.03
A5 0.05 0.04 0.16 0.10 0.11 0.07
Continue
2.0 mg C L-1 0.2 mg C L-1 Mixture
Trait Genotype A3 A5 A6 B A3 A5 A6 B A3 A5 A6 B
Body weight at five days
A1 0.003 0.01 0.01 0.01 0.003 0.003 0.01 0.01 0.003 0.01 0.01 0.01
A3 0.005 0.007 0.009 0.0004 0.005 0.003 0.002 0.006 0.006
A5 0.002 0.005 0.005 0.004 0.004 0.004
A6 0.002 0.001 0.0003
Relative tail spine length of the first adult instar
A1 0.08 0.07 0.09 0.09 0.07 0.06 0.05 0.06 0.08 0.06 0.07 0.08 A3 0.02 0.01 0.01 0.02 0.02 0.01 0.02 0.004 0.0008 A5 0.03 0.02 0.002 0.01 0.01 0.01 A6 0.003 0.01 0.003 L∞ A1 0.18 0.2 0.27 0.17 0.01 0.004 0.01 0.09 0.06 0.07 0.1 0.12 A3 0.02 0.08 0.35 0.01 0.02 0.07 0.02 0.05 0.18 A5 0.07 0.37 0.01 0.09 0.03 0.2 A6 0.44 0.1 0.23
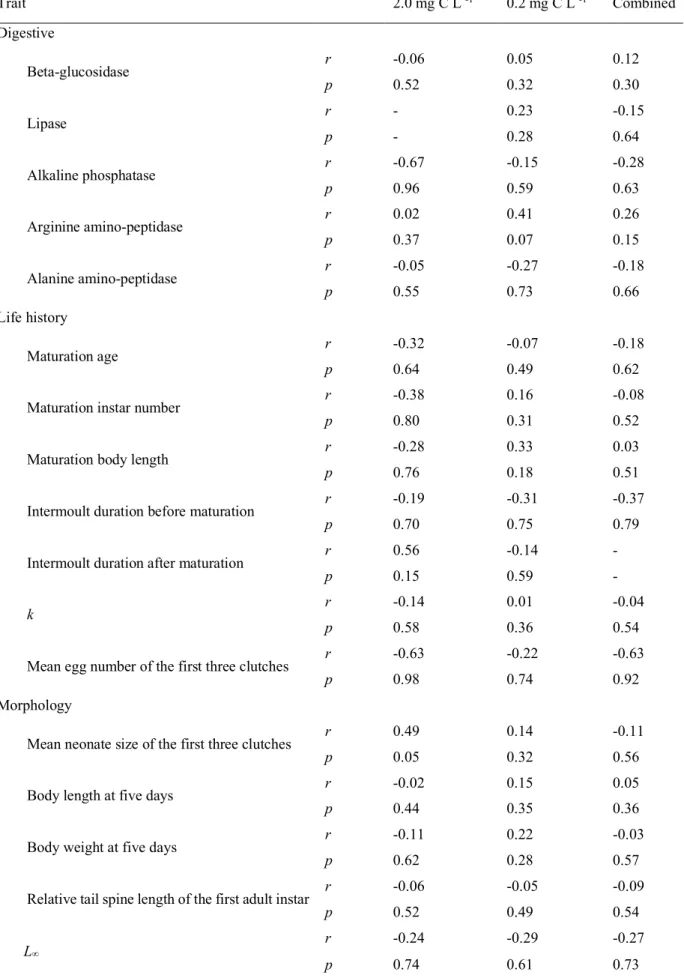
Table S4. Relationship between genetic distance and phenotypic distance between genotypes in each of the single traits. Trait 2.0 mg C L -1 0.2 mg C L -1 Combined Digestive Beta-glucosidase r -0.06 0.05 0.12 p 0.52 0.32 0.30 Lipase r - 0.23 -0.15 p - 0.28 0.64 Alkaline phosphatase r -0.67 -0.15 -0.28 p 0.96 0.59 0.63 Arginine amino-peptidase r 0.02 0.41 0.26 p 0.37 0.07 0.15 Alanine amino-peptidase r -0.05 -0.27 -0.18 p 0.55 0.73 0.66 Life history Maturation age r -0.32 -0.07 -0.18 p 0.64 0.49 0.62
Maturation instar number r -0.38 0.16 -0.08
p 0.80 0.31 0.52
Maturation body length r -0.28 0.33 0.03
p 0.76 0.18 0.51
Intermoult duration before maturation r -0.19 -0.31 -0.37
p 0.70 0.75 0.79
Intermoult duration after maturation r 0.56 -0.14 -
p 0.15 0.59 -
k r -0.14 0.01 -0.04
p 0.58 0.36 0.54
Mean egg number of the first three clutches r -0.63 -0.22 -0.63
p 0.98 0.74 0.92
Morphology
Mean neonate size of the first three clutches r 0.49 0.14 -0.11
p 0.05 0.32 0.56
Body length at five days r -0.02 0.15 0.05
p 0.44 0.35 0.36
Body weight at five days r -0.11 0.22 -0.03
p 0.62 0.28 0.57
Relative tail spine length of the first adult instar r -0.06 -0.05 -0.09
p 0.52 0.49 0.54
L∞
r -0.24 -0.29 -0.27
Table S5. BLUPs of each trait in Daphnia pulex JPN1 genotypes. Food concentration Genotype Beta-glucosidase Lipase Alkaline Phosphatase Arginine amino-peptidase Alanine amino-peptidase Maturation age Maturation instar number Maturation body length Intermoult duration before maturation 2.0 mg C L-1 A1 99.96 0.00 9.91 25.57 24.81 0.35 0.11 -0.02 1.26E-16 A3 -44.63 0.00 -7.02 1.59 7.84 0.06 0.04 0.03 -1.58E-16 A5 -2.53 0.00 65.77 -12.06 11.95 0.25 0.06 0.03 6.84E-17 A6 -28.65 0.00 -12.60 -2.57 -22.35 0.38 0.06 0.05 6.84E-17 B -24.15 0.00 -56.05 -12.54 -22.25 -1.04 -0.28 -0.08 -1.05E-16 0.2 mg C L-1 A1 13.86 138.08 218.70 55.09 44.18 0.27 0.06 -0.05 0.02 A3 -109.57 -37.02 111.98 12.03 1.02 0.15 0.31 -0.01 -0.07 A5 29.17 -42.52 -54.34 -57.76 7.55 -0.01 -0.18 0.02 0.08 A6 24.39 -136.70 221.04 85.27 -14.47 0.47 0.39 0.07 -0.02 B 42.15 78.16 -497.38 -94.63 -38.28 -0.87 -0.58 -0.04 -0.01 Combined A1 28.77 61.01 46.39 20.35 37.63 0.36 0.12 -0.04 0.004 A3 -45.21 -40.77 20.04 3.35 5.44 0.14 0.21 0.01 -0.013 A5 8.61 -31.09 11.26 -17.47 10.88 0.1 -0.07 0.03 0.014 A6 0.58 -52.82 39.09 20.57 -20.75 0.5 0.26 0.07 -0.002 B 7.25 63.67 -116.78 -26.80 -33.20 -1.1 -0.53 -0.07 -0.003
Continue
Food concentration Genotype
Intermoult duration after maturation k Mean egg number of the first three clutches Mean neonate size of the first three clutches Body length at five days Body weight at five days Relative tail spine length of the firstt adult instar L∞ 2.0 mg C L-1 A1 0.004 -0.00435 -0.8 -0.00263 -0.2345 -0.00674 -0.066 -0.1 A3 0.04 -0.00652 0.92 0.00365 0.031306 -0.00353 0.017 0.09 A5 -0.008 0.00285 1.66 0.001719 0.03734 0.001138 0.001 0.1 A6 -0.038 -0.00528 0.27 -0.00343 0.087577 0.003487 0.026 0.17 B 0.002 0.013304 -2.05 0.000696 0.078273 0.005653 0.023 -0.27 0.2 mg C L-1 A1 -0.09 -0.02499 0.44 -0.08016 -0.15982 -0.00384 -0.049 0.02 A3 0.01 -0.00893 -0.41 -0.00117 0.038599 -0.00092 0.022 0.01 A5 0.04 0.013427 0.2 0.027777 -0.04346 -0.00127 0.007 0.02 A6 0.03 0.007885 0.28 0.051587 0.112982 0.003746 0.005 0.03 B 0.01 0.012606 -0.52 0.001967 0.051698 0.002288 0.015 -0.07 Combined A1 0 -0.01419 -0.04 -0.0042 -0.20913 -0.0054 -0.057 -0.02 A3 0 -0.00813 0.07 0.000804 0.038016 -0.00221 0.019 0.03 A5 0 0.008132 0.33 0.001582 -0.00389 -8.60E-05 0.004 0.05 A6 0 0.00072 0.1 0.001584 0.106485 0.003703 0.015 0.08 B 0 0.013465 -0.47 0.000234 0.068525 0.003997 0.019 -0.15
34
Chapter III. Understanding the divergence of asexual Daphnia
pulex: the implications of competition under limited food
Introduction
Competitive interaction is one of important factors determining colonization success of invasive species. Since most zooplankton species share the same algal resources and habitat space, they face strong competitive interactions in nature. Indeed, a number of studies have shown that zooplankton community structure is often determined by competitive interactions (Neil, 1974, Lynch 1979, Sommer 2002). The fact implies that to colonize successfully in a habitat, zooplankton species have to overcome competitive interactions with other species.
Since they are obligate parthenogenetic, any populations of genotypes in panarctic D.
pulex JPN lineages are biologically isolated. In addition, since they are the same species and
thus have the same niche, it is likely that different asexual genotypes compete each other for limited resources. In previous study, I have shown that although they share the same ancestral clone, D. pulex JPN1 lineage have large variations in various phenotypic traits among the genotypes. If these phenotypic variations affected on the competitive ability, competitive superiority would differ among these genotypes. In other words, if these genotypes are allotropically selected by different selective forces, superiority in the intra-specific competition differ among the genotypes. When they are asymptotically distributed, a selection may have favored such genotypes that reduce intra-specific competition. Alternatively, if phenotypic variations of the traits are ecologically trivial, they are equal to each other in intra-specific competition. In addition, genotypes that are not yet genetically diverged may not differ in their superiority in intra-specific competition. As such, examination of competitive ability provides various clue for ecological and evolutional processes behind that these genotypes have been selected.
In this study, therefore, I examined the competitive ability of several JPN1 genotypes using life table experiment and intra-specific competition experiment. The specific objects are to clarify: (1) whether or not the competitive ability differs among the genotypes, (2) if it does, why a genotype is inferior to others in intra-specific competition, and (3) if the difference in competitive superiority among genotypes is related with genetic distance among these. Through these examinations, I explore divergent process of D. pulex JPN1 lineage after the invasion into Japan archipelago.
Methods
36
In this study, four genotypes (clones) of the D. pulex JPN1 lineage (A1, A3, A5 and B) were chosen because they were found to vary in important phenotypic traits such as maturation age and size, clutch size (Tian et al. 2019). These four genotypes of D. pulex were previously collected from ponds and small lakes in Japan (So et al. 2015). Genotype A1 was collected from Lake Hataya Ohnuma (Yamagata Prefecture, latitude (N) 38.245º longitude (E) 140.204º), A3 from Osawa Tame-ike Pond (Miyagi Prefecture, N 38.439º E 140.919º), A5 from Furuichi Oike Pond (Tottori Prefecture, N 35.391º E 133.339º), and B from Daizahoshi-ike Pond (Nagano Prefecture, N 36.706º E 138.145º) (So et al. 2015).
A green algal species, Scenedesmus obliquus, was cultured in a flow-through system with a daily dilution rate of 0.5 L using COMBO (Kilham et al. 1998), and was used as the food for
Daphnia cultures. For supplying algal cells to experimental animals, these were harvested and
enumerated under an optical microscope (Olympus, Tokyo, Japan). Using cell-specific carbon of S. obliquus measured previously (2.09×10⁻⁸ mg C cell-1), I estimated the appropriate amounts of algae for achieving a designed carbon food level and then used it in experiments.
Individuals in each genotype, taken from a single maternal individual that originated from a culture line maintained for several years in our laboratory, were cultured in 1L bottles
containing 600 ml of COMBO with 2.0 mg C L-1 of S. obliquus in a controlled room (20 °C,
photoperiod, Light(L): Dark(D) 14:10). The animals were fed daily and transferred to fresh medium every other day. The individual density in the culture bottles was adjusted to less than 1 individual 20 ml-1 in all the clones. Then, neonates born within 24 hours (hr) were collected from the cultured females after their 3rd brood and used for the following experiments.
Life table experiment
In this experiment, I collected the data from the growth experiment in Tian et al. 2019, in which, more than 20 neonates in each genotype were randomly chosen and individually placed into 50-ml stoppered bottles containing the growth medium COMBO with S. obliquus. Half of the Daphnia were grown at a food concentration of 2.0 mg C L-1, and the other half were grown at 0.2 mg C L-1. The experiment lasted until they had produced the sixth brood. To ensure that the food particles were homogeneous in the suspension, the bottles were secured to a grazing wheel that rotated at a speed of 1 revolution per minute. Daphnia were fed daily, and the growth medium and algal food were changed every two days. On the basis of the release time of the six clutches and neonate numbers, the intrinsic rate of population increase (r) was iteratively calculated as following equation:
1 = # $%&% × exp(−./)
1 234
where mt is the age-specific fecundity (number of neonates per adult), nt is the age-specific survivorship.
Competition experiment
To obtain sufficient experimental animals, at least 120 neonates in each genotype were randomly chosen and equally divided into six 1L bottles containing 600 ml of COMBO with 2.0 mg C L-1 of S. obliquus as the 1st pre cultures. The animals were fed daily and transferred to fresh medium every other day. The newly born neonates were removed from the bottles. After a 14-day cultivation, at least 120 neonates born within 24 hr were randomly collected from the 1st pre cultures. and transferred to new bottles with the same cultivation regime as the 2nd pre cultures. To initiate experiments, 4-day old juveniles and the 18-day old females were randomly collected from the 2nd and 1st pre cultures, respectively.
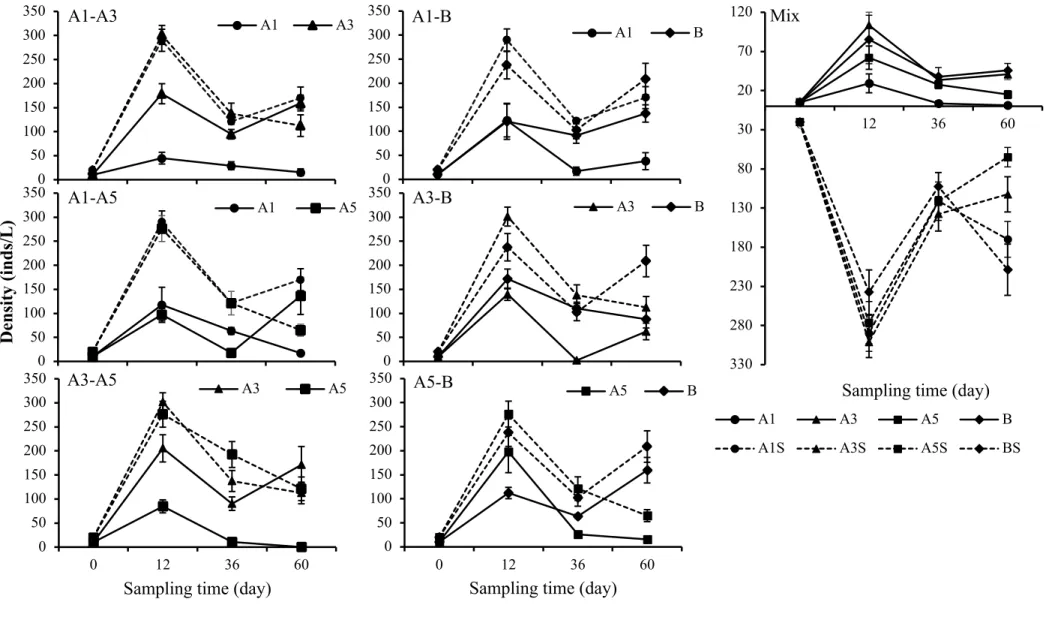
For experiments, I made three different runs, single genotype, two genotypes and four genotypes runs. In each run, glass bottles were filled with 1L of COMBO medium with 2.0 mg C L-1 of S. obliquus and received total 20 individuals. For single genotype runs, I transferred ten 18-days old individuals and ten 4-days old individuals of a single genotype and used these as control treatments. For two genotypes runs, I transferred five 18-days old and five 4-days individuals of each of two genotypes in following combinations (A1-A3, A1-A5, A1-B, A3-A5, A3-B and A5-B). For four genotypes treatments, I transferred two 18-days old and three 4-days individuals of each of four genotypes (A1, A3, A5 and B). These runs were used as competition treatments. Thus, I performed total 11 runs (four single genotype run, six two genotypes run and one four genotypes run). Each run was done with four replications. In each run, I added algal food at 1 mg C L-1 every third day (i.e., approximating a daily average food concentration of 0.33 mg C L-1).
Every 6 days during the run, 200ml medium were sampled and renewed in each bottle. The run was lasted for 60 days. Prior to sampling, all bottles were gently mixed and 200 ml medium from each bottle was poured into a beaker. Then I counted number of individuals in the beaker for quantifying number of individuals. From day 12, at least 20 individuals in the 200ml samples were randomly collected and then passed through a 80-µm mesh screen to capture the animals (all glassware and screening were rinsed thoroughly between bottles).