Is Corporate Environmental Responsibility More
Valuable in the Shaky Period? The Moderating
Effect of Ownership Type
著者
Zhou Hui ?, Nagayasu Jun
journal or
publication title
DSSR Discussion Papers
number
121
page range
1-33
year
2021-03
URL
http://hdl.handle.net/10097/00130595
Data Science and Service Research
Discussion Paper
Discussion Paper No. 121
Is Corporate Environmental Responsibility
More Valuable in
the Shaky Period? The Moderating Effect of
Ownership Type
Zhou Hui and Jun Nagayasu
March, 2021
Center for Data Science and Service Research Graduate School of Economic and Management Tohoku University 27-1 Kawauchi, Aobaku Sendai 980-8576, JAPAN
Is Corporate Environmental Responsibility More Valuable in
the Shaky Period? The Moderating Effect of Ownership Type
*Zhou Hui Jun Nagayasu
Abstract
Local protectionism is a severe problem in Chinese environmental governance that offers enterprises various levels of protection from environmental regulations according to different ownership types. Therefore, we examine the effectiveness of corporate environ-mental responsibility (CER) engagement on firm value with emphasis on the moderating role of ownership type. The study period is split into a period with a steady institutional background (2006–2015) and a shaky period of environmental reforms (2016–2019) to capture the difference in legal circumstances. We find that, first, the impact of CER on firm value changed significantly from negative to positive over the two periods. Second, ownership type played a moderating role that influenced CER effectiveness on firm value. Third, given the environmental reforms, CER effectiveness for state-owned enterprises af-filiated with the central government increased the most while that for private enterprises increased the least.
JEL classification: M14, G32, H70
Keywords: Corporate environmental responsibility; Firm value; Centralization; Local protectionism; Ownership type
*This study is partially supported by the Tohoku Forum for Creativity via the thematic program,
Envi-ronmental and Financial Risks. We acknowledge the helpful comments and suggestions given by Akira Hibiki, Xintong Li, and other attendees of the online International Conference of Young Researchers Meeting on Environmental Risks (December 2020).
Tohoku University, Graduate Program in Economics and Management, Address: 27-1 Kawauchi,
Aoba-ku, Sendai, Miyagi 980-8576 JAPAN.Email: [email protected], Tel: +81 22 795 6265, Fax: +81 22 795 6270.
Tohoku University, Graduate School of Economics and Management, Address: 27-1 Kawauchi, Aoba-ku,
1
Introduction
With growing environmental degradation, studies are increasingly focusing on corporate envi-ronmental responsibility (CER) engagements.1 CER refers to a firm’s willingness and ability to combine environmental considerations with its daily operations and management. The related literature is mainly devoted to the connotation, determinants, and consequences of CER (Porter and Kramer, 2006; Jo and Harjoto, 2012). In China, empirical studies have analyzed the determinants and consequences of CER. He and Chen (2009) discuss the drivers of CER among Chinese corporations and find the government and the social environment to be the most important in creating CER consciousness. Zeng et al. (2010) investigate the determinants and status of environmental information disclosure of Chinese listed companies. Du et al. (2014) examine religion’s influence on polluting enterprises and find that Buddhism is significantly positively associated with CER. Wu et al. (2020) and Li et al. (2020) evaluate CER’s impact on firm performance using different mediating factors.
Nonetheless, previous empirical studies do have some limitations. One limitation is that no attention has been paid to the evolution of CER’s impact. That is, most studies implicitly assume a stable background regarding CER investments, which results in the same conse-quence from the same level of CER engagement. This assumption is reasonable for some developed countries, whose institutional and social backgrounds are relatively mature and stable (Holtbr¨ugge and D¨ogl, 2012). However, it is impractical for countries such as China, where comprehensive environmental management reforms undertaken since 2016 have cre-ated a shaky institutional background. Nearly all listed enterprises have been investigcre-ated for a potential violation of environmental regulations, with some of them facing the prospect of stringent punishment (Jia and Chen, 2019). As a result, CER engagements have become a more important signal for the market than before as more CER engagements might be correlated with a reduced risk of punishment, a kind of “risk resistance indicator.”
The other limitation is that there is no hypothesis that explains why CER’s impact on firm value can be either negative or positive in any country. For example, some researchers defend-ing the trade-off hypothesis argue that CER could increase the operatdefend-ing costs of a company and, thereby, reduce firm value, while others support the stakeholder theory, which indicates that CER has overwhelming benefits for building corporate reputation and enhancing com-petitive advantages (Escrig-Olmedo et al., 2017; Dixon-Fowler et al., 2017). This study,
how-1
As an important part of corporate social responsibility (CSR), CER focuses on environmental responsi-bility and corporate sustainaresponsi-bility. Thus, in this study, using CER instead of CSR can yield a more reliable conclusion.
ever, hypothesizes that such mix-ups can be attributed to local protectionism—unwarranted protection from local government to lower environmental protection requirements and create competitive advantages for local enterprises. We believe that when local protectionism is strong, the corporate competitiveness generated by greater CER engagements is trivial com-pared to lower environmental investment and that CER engagements actually damage firm value, and vice versa. Note that the environmental reforms undertaken in China since 2016 have strengthened environmental supervision2 and weakened local protection. We therefore explore the role of CER’s evolutionary impact on firm value while examining the role of local protectionism.
Thus, the purpose of this study is to examine CER’s consequences over time—whether the impact of CER engagement on firm value changes when institutional background is dif-ferent. Equally important is ascertaining whether local protectionism can be considered an important potential factor through checking the evolution of CER’s impact and the moder-ating effect of ownership type. In China, firm ownership type influences firm operation and management. Compared to private firms, state-owned firms do not have a strong incentive to pursue profit and are more likely to comply with national policies. Moreover, state-owned businesses face higher public pressure. In this study, we divide all companies in our sample into three categories based on ownership types: firms controlled by the central government, firms controlled by local governments, and private firms. We investigate how the effects of CER differ with ownership type under the centralization trend in China.
Our study contributes to prior research in two ways. First, it is the pioneer to investigate CER effectiveness under varying institutional circumstances. We use two subsample peri-ods: a “steady period” representing a relatively steady institutional background from 2006 to 2015 and a “shaky period” representing a relatively shaky institutional background with environmental reform from 2016 to 2019. Second, we integrate environmental reform into an overall trend toward centralization in Chinese administrative reform and provide a novel per-spective to demonstrate how local protectionism influences CER’s impact in the two periods and for different ownership types. Previous studies have pointed out an intrinsic connection between the centralization trend and environmental reform, but no study has explored the relationship between CER engagements and local protectionism (Zhang et al., 2018). Our subsample regression results strongly indicate weakened local protectionism during 2016–19. The remainder of this paper is organized as follows. In Section 2, we discuss the varying
2It is part of the centralization reform, which signifies greater local power to the central government and
institutional setups under which the study is conducted. Section 3 summarizes the literature and puts forward the hypotheses. Section 4 presents the sampling variables for empirical research and estimation methods. Section 5 presents the empirical results and Section 6 concludes.
2
Institutional background
2.1 Environmental governance before 2016
The Chinese environmental governance system was set up in 1973, while initially concerns like deforestation and land overuse owing to poor agricultural practices were the main envi-ronmental problems. Although the central government was the dominant player in environ-mental governance on both legislation and enforcement until 1989, environenviron-mental protection had never been a priority compared to economic and social issues (He et al., 2012). Most environmental protection regulations and laws were drafted during 1989–2015, and local en-vironmental protection bureaus were gradually established from the province level to the county level, thereby creating a comprehensive administration. Since 2012, the Chinese cen-tral government has assigned a high priority to environmental protection for local cadres (Wang, 2013).
Despite these institutional developments, rapid industrialization has resulted in greater environmental degradation (Zhang and Wen, 2008; Sands et al., 2015). For example, the average PM2.5 (a kind of pollution particle smaller than 2.5 mm) concentration level in 170 Chinese cities in 2014 was around 61 ± 20µg/m3, 4 − 8 times higher than the standard set by the World Health Organization for “good health,” and only 9.5% of the cities monitored in China met the National Ambient Air Quality Standards (Wang et al., 2017).
Widespread lax environmental protection, or so-called local protectionism in environmen-tal management, is to blame (Lo, 2015; Van Rooij et al., 2017) for weak protection. On the one hand, the environmental regulatory framework had matured in a decentralized way that adopted a “divide and rule strategy” (Yu and Wang, 2013; Ran, 2013). That is, local environmental protection bureaus were empowered with sufficient discretion in return for no monetary support from the central government. This means that the Ministry of Environ-mental Protection (MEP) delegated its regulatory powers in exchange for a spending fee. On the other hand, under a dual leadership structure, there are two higher authorities for local environmental protection bureaus—a high-level environmental protection branch (the vertical
authority) and a local cadre (the horizontal authority). As fiscal and personnel powers were controlled mostly by local governments, local environmental protection bureaus responded more to these governments’ desire for lax enforcement (Bai et al., 2004). This lax enforce-ment protected local enterprises and yielded the benefits of tax revenue, private benefits, as well as sound economic performance for the local government (Ran, 2013; Kostka, 2014). In line with the pollution haven hypothesis, lax environmental enforcement also attracted investments from manufacturing enterprises (Kostka, 2016). This framework directly led to ineffectual supervision of enforcement by the MEP. Correspondingly, the MEP only guided provincial and sub-provincial regulatory administrations, which are often vague and aspira-tional (Yang, 2017). A former Minister of MEP, Zhou Shengxian, called his department one of the “four major embarrassing departments in the world” in 2013, admitting the distressing situation.
2.2 Environmental governance during 2016–2019
A crystal fact is that the main source of environmental degradation and resource consumption are industries (Przychodzen et al., 2018). To prevent factories and enterprises from bypass-ing regulations and laws, the central government launched comprehensive reforms in 2016. President Xi introduced the term “New Normal” to refer to the long-lasting changes from pursuing economic growth to a more sustainable and balanced development. The reforms had a centralized pattern in three aspects: legislation, institutional framework reform, and enforcement (Li et al., 2019). For legislation, new and amended laws were enacted by the central committee, such as Environmental Protection Law (revised), Atmospheric Pollution Prevention and Control Law, Marine Environment Protection Law, Water Pollution Preven-tion and Control Law, and Law on the PrevenPreven-tion and Control of Environment PolluPreven-tion Caused by Solid Wastes. Similar regulations for the atmosphere, water, and soil protection were also issued directly by the MEP.
Importantly, the conventional “top-down” regulatory framework, where local cadres had the motivation and discretion to dominate environmental enforcement, was bypassed in the process of institutional restructuring. The MEP now has more funds to support local environ-mental projects directly. Further, the Ministry of Ecology and Environment was established to replace the MEP in granting more responsibilities on environmental enforcement and su-pervision. There is a tighter central control over local agents’ fiscal powers and the salient deviation from the previously dominant performance-based governance system. That is,
im-proved environmental enforcement has replaced robust GDP growth as one of the dominating factors for a local official’s career promotion (Li et al., 2019). The central authority also en-courages markets and NGOs to supervise the locally dominated environmental enforcement. One landmark event during these reforms was an unprecedented Environmental Inspec-tion led by the Central Government (EICG), initiated in 2016. The EICG focused on the re-evaluation of local governments’ environmental enforcement and enterprises’ illegalities. Under the direct supervision of central government officials, the EICG inspected all provinces in five batches over two years. Although the start date of inspections in the provinces varied for each batch, the inspection period was always one month. The Central Discipline Commit-tee of the Communist Party of China, which is the enforcer of anti-corruption policies, was also involved to maximize the effectiveness of EICG. From 2018, the second round of EICG was conducted to achieve consistent supervision. According to official reports, 1,527 people were taken into custody and 18,199 officials were publicly named for violating environmental laws.
In summary, it is widely recognized that local protectionism before 2016 led to lax en-vironmental governance. The comprehensive reforms undertaken from 2016 to 2019, viewed as a part of a centralizing trend in administrative reform, have weakened this protectionism and overturned the lax enforcement, at least in the short term.
3
Literature review and hypothesis development
3.1 Effects of CER on firm value in the steady period
CER is one of the key factors that align a firm’s environmental protection engagements with firm value. However, there are long-standing debates on whether the benefits of CER activities exceed their costs in the short term. Many investigators agree with CER’s overall positive contribution in helping to control costs, establish firm reputation, and earn credits from customers (Porter and Van der Linde, 1995; Tantalo and Priem, 2016). The majority of these views are based on the stakeholder theory, which implies that CER contributes to firms’ competitive advantage by helping them build a good reputation among stakeholders (Dixon-Fowler et al., 2017). Consequently, firm value can be enhanced by managing the core stakeholder relationships (Hamman et al., 2010).
In contrast, the trade-off hypothesis argues that CER activities weaken corporate financial performance despite apparent gains (Elsayed and Paton, 2005). This is because CER is viewed
as a disadvantage that increases corporate costs and, thereby, reduces profitability (Liu et al., 2010). As CER activities consume the firm’s core resources, they contribute directly to a relative disadvantage vis-a-vis competitors with a smaller CER engagement; hence, firms do not have the incentive to spend more on CER (Fujii et al., 2013; Trumpp and Guenther, 2017). Islam and Deegan (2008) suggest that legislative pressure and accountability are the key elements that boost CER activities rather than mere earnestness. Darnall and Edwards Jr (2006) further list out factors that explain greater costs when adopting an environmental management system (one is CER implementation). The trade-off hypothesis has more appeal in developing markets, which focus more on enterprise profitability and are less sensitive to CER engagements.
Based on the previous analyses, we support the trade-off hypothesis and propose Hypoth-esis 1.
Hypothesis 1: During the steady period (2016–19), CER had a significant negative impact on firm value, ceteris paribus.
3.2 Effects of CER on firm value in the shaky period
The mechanism of CER’s effectiveness can be derived from ample theoretical research. It is widely agreed that changing CER’s determinants from an inconsistent policy improves the stock market’s response (Pfeffer and Salancik, 2003; Cots, 2011). CER is conceived as the accepted ideas of social relationships and norms that align enterprises’ willingness with external factors (Frynas and Yamahaki, 2016). However, there is no consensus regarding how much time is needed for reform, and enterprises need much time and repeated attempts before successfully managing a new relationship. Due to temporary dysfunction, the stock market also adjusts its evaluation of CER’s effectiveness (Mitchell et al., 1997). Mellahi et al. (2016) demonstrate that, in the formation of economic outcomes, nonmarket issues (political, social, or environmental) take effect through mediating mechanisms regarding organizational boundary spanning and external moderating mechanisms.
From the perspective of practical evidence, the other factor that explains the mechanism of CER’s effectiveness is the increased business risk faced by enterprises since 2016. As dis-cussed above, environmental enforcement was lax in China earlier. Many enterprises chose low-cost methods like bribery to evade environmental supervision. However, the environ-mental reforms since 2016 have overturned the situation using multiple methods, including campaign-style inspection, stricter legislation, and institutional reform. For example, EICG
was carried out by the central government from 2016 to 2018; the revised Marine Environ-ment Protection Law was issued in 2017; the revised Water Pollution Prevention and Control Law was published in 2017; the Ministry of Environment was reorganized in 2018; an environ-mental lawsuit system was set up in 2018 and 2019; and a Special Environenviron-mental Protection Fund was established in 2016. The central executive branch now takes more responsibilities in law enforcement while the local government’s discretion is limited (Tian et al., 2019). One striking result is that enterprises that fail to comply with new regulations within a specified time face penalties and risk permanent closure as well (Zhang et al., 2018). Correspondingly, more CER engagements can be viewed as an appropriate “risk resistance indicator” that boosts the stock market’s confidence.
In summary, based on the theoretical foundation and practical evidence, the Chinese environmental reform that purportedly threatens enterprise survival will cause CER’s effec-tiveness to increase. Thus, we propose Hypothesis 2.
Hypothesis 2: During the shaky period (2006–15), CER’s impact on firm value signifi-cantly increased and was positive, ceteris paribus.
3.3 Distinctive effects of CER on firm value by ownership type
It is widely recognized that firm ownership type plays an important role in CSR’s impact on firm value in China (Chen et al., 2009). Ownership type can be categorized into three groups: state-owned enterprises controlled by the central government (SOECG), state-owned enterprises controlled by the local government (SOELG), and private enterprises (PE) (Wang et al., 2008). State-owned enterprises (SOEs) including SOECGs and SOELGs are believed to be managed differently than PEs (Chen et al., 2009). For example, one SOE’s managers are officials deputed by the government and therefore, their career prospects are closely related to the extent to which their management executes instructions from their superiors.
One result from China’s decentralized administrative structure3is notable—heterogeneous enforcement across localities and enterprises (Kostka and Nahm, 2017). Heterogeneous en-forcement refers to the fact that despite a uniform central management system, the ill-suited administrative structure eventually fails to enforce these laws and regulations coherently. China has a complex system of formal and informal divisions of authority between the cen-tral government and various levels of local and regional governments (Lo and Fryxell, 2005). Heberer and Schubert (2017) demonstrate that local cadres still establish low-demand local
3
The decentralized structure in the environmental executive branch is where the central government relin-quishes most of its fiscal, administrative, and personnel powers to sub–national governments.
regulations, regardless of strict national legislation, and take advantage of their discretionary powers to evade environmental protection responsibilities and defend local enterprises. Lax enforcement is particularly salient in the case of SOEs because of strong political connections. That is, SOELGs receive local protection because they are directly responsible for and are most politically connected with local authorities, and SOECGs receive more protection be-cause their managers often have higher administrative rankings than the local head (Wang, 2016). Therefore, engaging in CER activities will not result in external credits for SOEs as the stock market responds indifferently as well. Besides, according to the trade-off theory, the overweight cost from these engagements will result in enterprises spending the bare mini-mum on CER. Hence, CER effectiveness was negative particularly for SOECGs and SOELGs during the steady period (2016–19).
From 2016, all enterprises could expect an increasingly positive CER effectiveness in the shaky period with weakened local protectionism as CER can be viewed as a “risk resistance indicator.” However, CER effectiveness in SOEs could be more because of “additional political score” (Li and Zhang, 2010; Van Rooij et al., 2017). Becoming an advocate of central policies is believed to be an important signal of good risk resistance capability for SOEs and political achievement for their managers, as the Chinese government is used to promoting new policies by setting examples and commending them vigorously in the future. Private enterprises, on the other hand, rarely receive equivalent credit because of fewer political connections and are not fully trusted (Kung and Ma, 2018; Walder, 2002).
In brief, the cost of CER engagements shall surpass their benefits in the steady period particularly for SOEs, while they gain more from the combination of weakened local pro-tectionism and unique benefits from political advocates. Therefore, we suggest Hypothesis 3.
Hypothesis 3: For SOELGs & SOECGs, there is an increased CER impact on firm value than for PEs. That is, CER was more valuable for SOELGs & SOECGs during the shaky period.
4
Research design
4.1 Sample periods and data collection
The initial sample contains all A-listed firms 4 from 2006 to 2019.5 China is suitable for our investigation of CER’s evolutionary effectiveness for three reasons. First, China is paying more attention to environmental information disclosure in recent years, so we can obtain suitable data related to corporate environmental responsibility (Li et al., 2020).6 Second, China witnessed steady economic growth in the study period and provides a stable social
en-vironment beyond enen-vironmental management reform.7 Third, China has undergone
compre-hensive reforms on environmental governance from 2016 to 2019, which offers us the varying institutional circumstances needed for our study purpose. Finally, we split the study period into two distinct periods to capture the change in the institutional background.8 The period from 2006 to 2015 is considered a relatively stable period regarding environmental manage-ment policy and enforcemanage-ment, before the country started extensive environmanage-mental reforms from 2016. Therefore, a partition into two periods allows us to investigate CER effectiveness under different environments.
Our data set includes 1004 listed firms and 6232 observations. For the validity of the research, we exclude all special treatment (*ST/ST) firms9 and firms that do not have our required data. Moreover, to avoid the influence of extreme values on the results, all continuous variables are winsorized at the 1st and 99th percentiles. The data are collected from the China Stock Market & Accounting Research Database (CSMAR), Chinese Research Data Services Platform, and Wind Database.
4.2 Measurement of variables
4.2.1 Corporate environmental responsibility
We use content analysis to measure CER by analyzing the environmental information dis-closed in CSR reports based on the CSMAR and Chinese Research Data Services Platform.
4
A-shares denote the publicly listed firms traded on Shenzhen and Shanghai Stock Exchanges. These stocks are traded in Renminbi (RMB), China’s legal tender.
5We choose this time period since it allows us the maximum time interval for calculating CER engagement. 6
The “Guidelines for Social Responsibility of Listed Companies” published in China in 2006 stipulates that Chinese listed firms should routinely assess their CSR performance in accordance with the guidelines.
7
See Report on the Work of the Government 2019 (http://www.gov.cn/zhuanti/2019qglh/2019lhzfgzbg/index.htm).
8See the official schedule for comprehensive environmental reform, Integrated Reform Plan for
Pro-moting Ecological Progress (http://www.caeisp.org.cn/zh-hans/integrated-reform-plan-proPro-moting-ecological- (http://www.caeisp.org.cn/zh-hans/integrated-reform-plan-promoting-ecological-progress).
Based on Li et al. (2020), we evaluate CER on five dimensions: legal consciousness, social evaluation, eco-friendly production, low-carbon technology, and green management. Each dimension is measured by several indexes. The specific evaluation system is shown in Table 1. To keep the direction of all indicators consistent, firms that have not been penalized for environmental irregularities take the value of 1; else they take a value of 0. Firms that are not discharging pollutants take a value of 1; else they take a value of 0. For the remaining indicators, if the answer is yes, we assign the value of 1, else 0. These indicators are all reflections of the sampled firms’ objective facts. We weighted all the items equally to avoid subjectivity and get a reasonable calculation of CER for all selected firms. The score of each dimension of CER is the sum of the values of the indicators under each dimension, and the total CER score is the sum of the five dimensions.
[Table 1]
4.2.2 Firm value
Firm value usually reflects the company’s ability to provide satisfactory returns to all stake-holders (sharestake-holders, creditors, managers, employees, etc.) under value-induced manage-ment and the rule of law. In this study, we use Tobin’s Q to measure firm value. Tobin’s Q is the ratio of firm market value to its asset replacement cost, and it is widely used as a measurement of firm value in the accounting, economics, and finance literature (Mangena et al., 2012; Gompers et al., 2003). It is a good indicator for evaluating firm value since it can not only reflect the firm’s past value but also take into account its future performance expectations.
4.2.3 Ownership structure of China’s listed companies
According to the listed company equity documents from CSMAR, all Chinese listed firms can be divided into four types based on ownership structure: state-owned enterprises, private enterprises, foreign companies, and others. Further, state-owned enterprises are divided into three categories according to different hierarchies: city, province, and country. According to the distinct performance mechanisms of different ownership structure companies in different institutional backgrounds and consistent with the literature (Chen et al., 2009), we divide our sample enterprises into three categories: SOECG, SOELG, and PE. We use dummy variables SOECG, SOELG, and PE to indicate the three kinds of enterprises.
4.2.4 Control variables
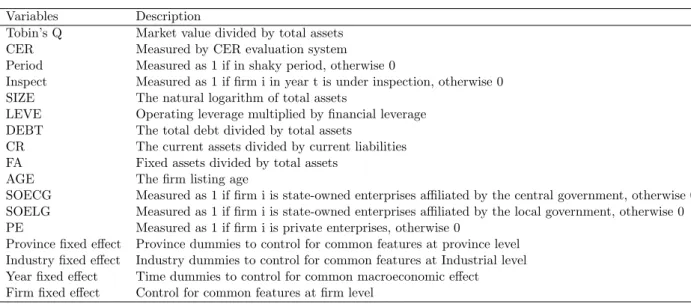
In addition to CER, many determinants that can potentially affect firm value are added into the estimation model as control variables. Referring to previous studies, we select the following control variables (Fosu et al., 2016; Kuzey and Uyar, 2017). Firm size (SIZE) mea-sured as the natural logarithm of total assets is considered an important variable that affects performance through economies of scale or scope (Stock et al., 2002). Other factors such as total leverage (LEVE; measured as operating leverage multiplied by financial leverage), debt ratio (DEBT; measured as the ratio of total debt divided by total assets), liquidity (CR; measured as current assets divided by current liabilities), fixed assets ratio (FA; measured as fixed assets divided by total assets), and firm age (AGE; measured as firm’s listing age) are also included (Fosu et al., 2016; Kuzey and Uyar, 2017). The variables’ description and measurements are shown in Table 2.
[Table 2]
4.2.5 Model construction
This section describes the econometric model used to examine the relationship between CER and firm value (Tobin’s Q) in different periods. To test our hypotheses, we construct the
following baseline regression model for all firms. We use the dummy variable Period to
distinguish between the steady and shaky periods, which is referred to by Mangena et al. (2012) and Shen et al. (2019).
Baseline model:
Tobin’sQi,t =β0+ β1CERi,t+ β2CERi,t× Periodi,t+ β3Periodi,t
+ β4Controlsi,t+ Year + Industry + Province + εi,t
(1)
where i indexes the firm, t indexes the year, and Period captures the different periods when the year of the observation is between 2016 to 2019. Period takes the value of 1, else 0. Control is a set of control variables expected to influence firm value, like firm size, debt ratio, total leverage, liquidity, fixed assets ratio, and firm listing age. Year captures the time-fixed effects. Industry captures the industry-fixed effects. Province captures the province-fixed effects. εi,t is the error term. To determine if the impact of CER on firm value
increased during the shaky period, our model contains the interaction term CER*Period. To see how ownership type plays a moderating effect, we perform the previous regression on the ownership type subsamples.
5
Empirical results
5.1 Data description
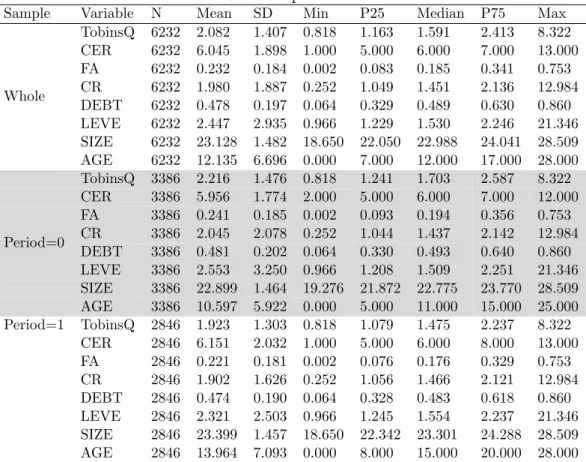
Table 3 shows the descriptive statistics of all variables for the full period (2013–2018), the steady period (Period 0, 2013–2015), and the transitional period (Period 1, 2016–2018). The CER of the whole period ranges from 1 to 13 points, with a mean score of 6.045. No firm has a CER level of zero, which signifies that all the A-listed firms in our study period provide CER information in their annual reports according to our measurement. The scores also show that the CER level of the sample firms has a wide range, with some firms obtaining a full score of 13 points. The mean of the CER level in stage 2 (6.151) is slightly higher than that of stage 1 (5.956), which indicates a slightly increasing willingness in CER engagements during the shaky period. The mean firm value (Tobin’s Q) in stage 2 (1.923) is slightly lower than in stage 1 (2.216), because the stock market value decreased slightly after 2015. Regarding the control variables, the mean value of the natural logarithm of firm size is 23.128, the average value of the fixed assets ratio is 23.2%, the mean value of the current ratio is 1.98, the average debt-to-asset ratio is 47.8%, the mean total leverage is 2.447, and the average listing age is 12.135 years. All these values are consistent with the literature (Kuzey and Uyar, 2017; Li et al., 2020).
[Table 3]
Table 4 is the correlation matrix, which exhibits the correlation between all the variables and suggests potential collinearity. After analyzing the correlation matrix and the variance inflation factor (VIF), we confirm that multicollinearity is not a concern for all the variables. We also observe that CER has a significant negative impact on firm value.
[Table 4]
5.2 Baseline findings
We start our analysis by testing the impact of CER on firm value in the two periods. Table 5 reports the baseline results for the constructed models of the whole sample in the two periods. As shown in column (4), the results are derived from two methods (ordinary least squares (OLS) and fixed-effects (FE)) and consider the existence of covariates’ effect. Regardless of the method adopted (columns (1) and (2) vs columns (3) and (4)) or whether covariates are included (columns (1) and (3) vs columns (2) and (4)), the results are similar. Specifically, the CER coefficient is -0.032 and -0.038, respectively, and significant at the 1% level using
both methods given the involvement of covariates, indicating that every one-point increase in the CER score decreases the Tobin’s Q value by around 0.03, or around 1.5% in the steady period, all else being equal. This result shows that CER has a significant negative impact on Tobin’s Q in 2006–2015, which is consistent with some previous studies (Zeng et al., 2010; Shen et al., 2019) and strongly supports Hypothesis 1. On the other hand, the CER*Period coefficient is 0.065 and 0.062, respectively, and significant at the 1% level using both methods given the involvement of covariates, indicating that every one-point increase in the CER score increases around 0.03, or around 1.5% of the Tobin’s Q value in the shaky period, all else being equal. This result shows that CER has an inverse positive impact on Tobin’s Q during 2016– 2019 and confirms the presence of CER’s effectiveness, which strongly supports Hypothesis 2. With respect to the effect of covariates, we find that firm size (SIZE) is negatively related to Tobin’s Q, which implies that bigger firms are relatively inefficient. Furthermore, the fixed assets ratio, total leverage, and debt ratio are significantly negatively correlated with Tobin’s Q. We also find that the current ratio is significantly positively correlated with firm value. These findings are consistent with those of previous studies (Bozec et al., 2010; Li et al., 2020).
[Table 5]
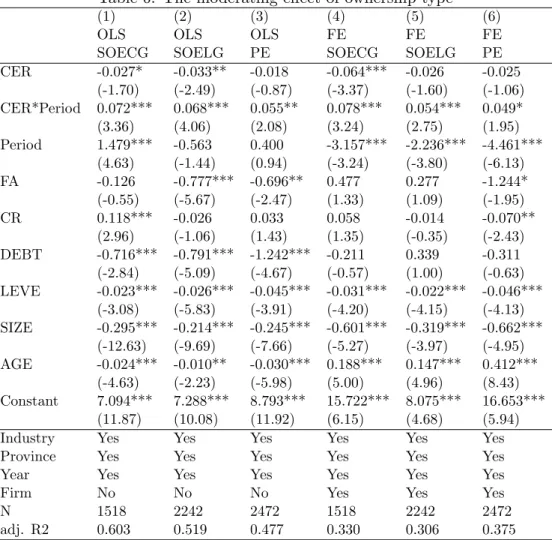
We then test the moderating effect of ownership type between CER and firm value. Table 6 reports the results from the subsample regression of the two periods. Columns (1), (2) and (3) show the results from the OLS method while columns (4), (5) and (6) indicate those from the FE model. First, focusing on the CER coefficient, we find that CER had a more negative impact on firm value for SOECGs and SOELGs than PEs in the steady period in both models. This is consistent with our hypothesis that SOECGs and SOELGs receive stronger local protection because of their closer connections to the local governments. When local protection is strong, corporate competitiveness generated by greater CER engagements would be insignificant compared to the lower environmental investment; thus, CER engagements are a disadvantage for firm value since the corresponding added cost may exceed the value of any added benefit and vice versa. PEs benefited less from local protectionism than the other types during the steady period and therefore gained more “compensation” from CER engagements. Second, focusing on the interaction term CER*Period, both methods strongly support the fact that CER’s positive impact increased the most for SOECGs and the least
for PEs during the shaky period in both models. For example, when comparing model
finding further supports our hypothesis that following the environmental reforms and reduced local protection during the shaky period, SOECGs, which suffered the most from reduced local protection, gained the most competitive advantage from CER engagements. These competitive advantages from CER promote firm value in two ways: first, as a “risk resistance indicator” to credit the enterprise’s capacity for surviving and running smoothly during the shaky period, and second, as an “additional political score” to credit the enterprise’s capacity for advocating new policies. These findings, therefore, strongly support Hypothesis 3 and indicate the involvement of local protectionism.
[Table 6]
5.3 Endogeneity concerns
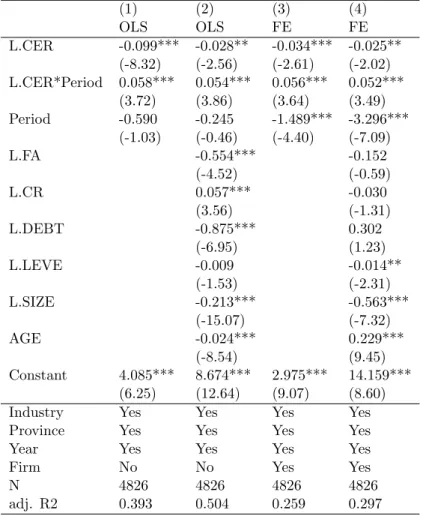
To eliminate potential endogeneity caused by simultaneity and reverse causality, we adopt lagged explanatory variables instead of contemporaneous variables; the results are reported
in Table 7. In columns (1) and (2), we use OLS estimation with industry-fixed effects,
province-fixed effects, and year-fixed effects. In columns (3) and (4), we use the FE model for estimation with firm-fixed effects and year-fixed effects. We include control variables
in columns (2) and (4). We can see from the table that for L.CER (lagged CER) and
L.CER*Period (lagged CER*Period), the coefficients are similar to that of Table 5. The same implications hold: CER had a significant negative impact on Tobin’s Q during 2006– 2015 (which strongly supports Hypothesis 1) and had significant positive incremental impact on Tobin’s Q during 2016–2019 (which strongly supports Hypothesis 2).
[Table 7]
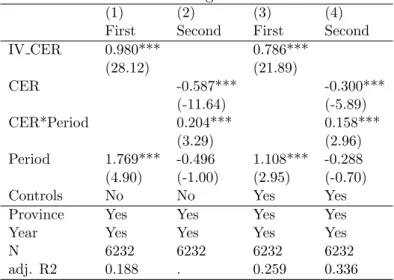
We also employ the instrumental variables method to alleviate the endogenous concerns of omitting correlated variables, using the average CER of all other firms in the same industry as instrumental variables. The results are displayed in Table 8. Columns (1) and (2) exclude control variables while columns (3) and (4) include control variables. Columns (1) and (3) are the regression results of the first stage, and columns (2) and (4) show the regression results of the second stage. From Table 8, we can see that our IV CER is highly related to the original CER in the two regressions, 0.980 and 0.786, respectively. Thus, CER’s impact on firm value during the steady period and its incremental impact during the shaky period are consistent with our baseline model. That is, the coefficients of CER are significantly negative (-0.587 and -0.300), and the coefficients of the CER*Period are significantly positive (0.204 and 0.158) in the regression results in the second stage.
[Table 8]
5.4 Robustness check
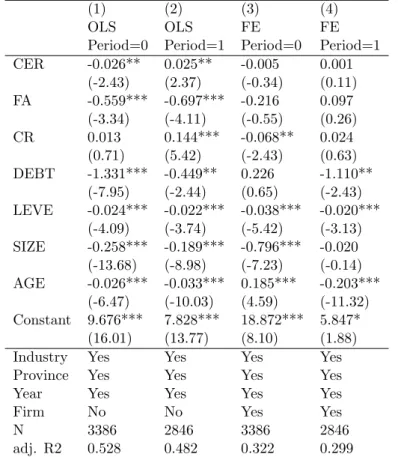
The robustness of the results is checked through three further analyses, which support our theoretical framework and propositions. First, we run separate OLS and FE model regressions
for the steady period (2006—2015) and the shaky period (2016—2019). The subsample
results are shown in Table 9, where columns (1) and (2) indicate the OLS regression results and columns (3) and (4) indicate the FE regression results. Using simple comparison, we find that the OLS results are consistent with the previous baseline findings; the impact of CER on firm value is significantly negative during the steady period, while it is significantly positive during the shaky period, and is significant at the 5% level. Although the FE model regression results are not significant, they show a predicted sign. Therefore, the regression results of the subsample support our findings.
[Table 9]
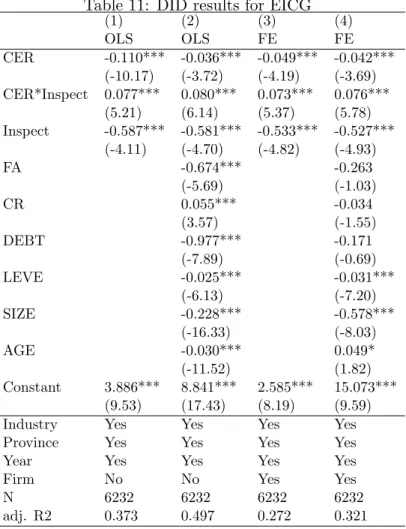
Second, we observe that the EICG was conducted during the environmental reforms. As Table 10 implies, EICG was conducted in batches, and there were natural control and treated groups in each batch. Therefore, we can use the difference-in-difference (DID) method to examine the average treatment effect of EICG and consider receiving treatment as a substitute of experiencing a shaky period for enterprises. Inspect is equal to 1 if firm i is under or has finished inspection in year t, and 0 otherwise. CER*Inspect shows the incremental CER impact after the EICG. The results from the DID method are compared with the baseline results to assess robustness. From the results shown in Table 11, the coefficients of CER and CER*Inspect are strongly consistent with the baseline findings in Table 5 regardless of whether there is an involvement of covariates. The four coefficients of CER in the first row show that the impact of CER on firm value is significantly negative in the steady period. The four coefficients of CER*Inspect in the second row show that the incremental CER impact on firm value is significantly positive in the steady period. Thus, this test supports the validity of our findings.
[Tables 10 & 11]
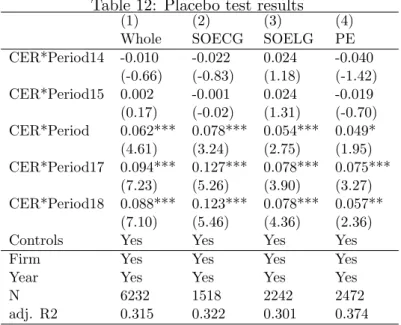
Finally, we conduct a placebo test to exclude the effect of time-changing factors and to test whether the influence from the shaky period does exist. The argument is that, given the assumption that the environmental reforms began in another year rather than in 2016, if there exists any significant non-zero coefficient of CER*Period (indicating the incremental
impact of CER on firm value) before 2016 or any insignificant close-to-zero coefficient of CER*Period after 2016, then our preceding time division will lose its statistical validity. We use Period14 to represent the assumed beginning of the shaky period from the year 2014; thus, CER*Period14 captures the incremental impact of CER on firm value in the assumed shaky period. The other interaction terms such as CER*Period15, CER*Period17, and CER*Period18 have similar meanings. The placebo results are shown in Table 12. All four columns’ results clear our concerns, as coefficients of CER*Period14 and CER*Period15 are both close-to-zero and coefficients of CER*Period, CER*Period17, and CER*Period18 are all significantly non-zero. Furthermore, the coefficients of CER*Period across the three
ownership type groups after 2016 also support our findings from Table 6. That is, the
incremental CER impact is highest for SOECGs and least for PEs. One interesting result is that if we split the period later (2017 or 2018), the difference in CER effectiveness is more salient as SOECGs benefit increasingly more from CER engagements than others. This pattern might reflect the theoretical proposition that since the shaky period is composed of an integration of many environmental reforms rather than just a sole campaign-style EICG in 2016, we should expect a shift from the shaky period to another steady period with normalized stringent supervision in the future.
[Table 12]
6
Conclusion
The government and the public have been paying increasing attention to environmental degra-dation in recent years and demanding greater environmental accountability and disclosure from enterprises. CER, which measures the willingness and investment of enterprises for environmental protection, thus assumes importance. It is explicitly demonstrated that CER has an impact on firm value, but whether this impact is positive or negative is still debatable. As many studies in China yield mixed results, we believe strong local protectionism could be the potiential reason. Notice that the environmental reforms undertaken from 2016 have strengthened environmental supervision and weakened local protection, CER’s impact in two seperate time periods (before and after 2016) is considered in our study to test evolution of CER’s impact. The moderating role of ownership is also studied to better reveal the existence of local protectionism.
This study makes two main contributions. First, to the best of our knowledge, it is the first to investigate CER effectiveness under varying institutional circumstances—that is,
whether there has been a robust change in the impact of CER on firm value before and after the environmental reforms in 2016. The results provide strong evidence on the involvement of local protectionism in the relationship between CER and firm value. Second, according to the findings of previous studies, firm ownership type is closely connected with the strength of local protection, which is ample reason for us to dig deeper into local protectionism’s role. Our results demonstrate the role of weakened local protectionism after 2016 and help us to view the environmental reforms from a new perspective—that is, as a part of the larger Chinese administrative reforms to combat decentralization.
We investigate the impact of CER on firm value using data from Chinese A-listed firms from 2006–2019. We first examine whether there is a significant difference in CER’s effec-tiveness on firm value between the steady period and shaky period. Then, we investigate the moderating role of firm ownership types on that relationship in the two periods to check local protectionism’s role. Our results show that, first, CER negatively affects firm value in the steady period, but positively affects it in the shaky period. Second, we find that enterprises that previously received more local protection show larger increments in CER effectiveness.
Our findings are very relevant to firm management, investors, and policymakers. When deciding on CER investment, managers should comprehensively consider the characteristics of the company and the institutional background to optimize their results. When anticipat-ing strict environmental enforcement and weak local protection in a few years, they should
consider greater CER engagements and information disclosure. For investors, keeping a
close eye on policies and change in public awareness is necessary when reasonably estimat-ing firm value. Our results show that, throughout the environmental reform period, greater CER engagements benefited SOECGs. Therefore, investors should also be more attentive to CER. Policymakers should try to ensure strict and effective implementation of environmen-tal policies and laws. Our results show that, to make environmenenvironmen-tal policies truly effective, policymakers need to combat local protectionism. Moreover, when environmental protection policies are strictly implemented, CER’s positive effect is more prominent. This will undoubt-edly lead companies to more environmental protection investments and promote sustainable development.
References
Bai, C.-E., Du, Y., Tao, Z. and Tong, S. Y. (2004), ‘Local protectionism and regional special-ization: evidence from China’s industries’, Journal of International Economics 63(2), 397– 417.
Bozec, R., Dia, M. and Bozec, Y. (2010), ‘Governance–performance relationship: a
re-examination using technical efficiency measures’, British Journal of Management 21(3), 684–700.
Chen, G., Firth, M. and Xu, L. (2009), ‘Does the type of ownership control matter? Evidence from China’s listed companies’, Journal of Banking & Finance 33(1), 171–181.
Cots, E. G. (2011), ‘Stakeholder social capital: a new approach to stakeholder theory’, Busi-ness Ethics: A European Review 20(4), 328–341.
Darnall, N. and Edwards Jr, D. (2006), ‘Predicting the cost of environmental management system adoption: the role of capabilities, resources and ownership structure’, Strategic Management Journal 27(4), 301–320.
Dixon-Fowler, H. R., Ellstrand, A. E. and Johnson, J. L. (2017), ‘The role of board environ-mental committees in corporate environenviron-mental performance’, Journal of Business Ethics 140(3), 423–438.
Du, X., Jian, W., Zeng, Q. and Du, Y. (2014), ‘Corporate environmental responsibility in polluting industries: Does religion matter?’, Journal of Business Ethics 124(3), 485–507. Elsayed, K. and Paton, D. (2005), ‘The impact of environmental performance on firm
per-formance: static and dynamic panel data evidence’, Structural Change and Economic Dy-namics 16(3), 395–412.
Escrig-Olmedo, E., Mu˜noz-Torres, M. J., Fern´andez-Izquierdo, M. ´A. and Rivera-Lirio, J. M. (2017), ‘Measuring corporate environmental performance: A methodology for sustainable development’, Business Strategy and the Environment 26(2), 142–162.
Fosu, S., Danso, A., Ahmad, W. and Coffie, W. (2016), ‘Information asymmetry, leverage and firm value: Do crisis and growth matter?’, International Review of Financial Analysis 46, 140–150.
Frynas, J. G. and Yamahaki, C. (2016), ‘Corporate social responsibility: Review and roadmap of theoretical perspectives’, Business Ethics: A European Review 25(3), 258–285.
Fujii, H., Iwata, K., Kaneko, S. and Managi, S. (2013), ‘Corporate environmental and eco-nomic performance of Japanese manufacturing firms: Empirical study for sustainable de-velopment’, Business Strategy and the Environment 22(3), 187–201.
Gompers, P., Ishii, J. and Metrick, A. (2003), ‘Corporate governance and equity prices’, The Quarterly Journal of Economics 118(1), 107–156.
Hamman, J. R., Loewenstein, G. and Weber, R. A. (2010), ‘Self-interest through delegation: An additional rationale for the principal-agent relationship’, American Economic Review 100(4), 1826–46.
He, G., Lu, Y., Mol, A. P. and Beckers, T. (2012), ‘Changes and challenges: China’s envi-ronmental management in transition’, Envienvi-ronmental Development 3, 25–38.
He, M. and Chen, J. (2009), ‘Sustainable development and corporate environmental respon-sibility: Evidence from Chinese corporations’, Journal of Agricultural and Environmental Ethics 22(4), 323–339.
Heberer, T. and Schubert, G. (2017), County and township cadres as a strategic group. A new approach to political agency in China’s local state, in ‘Critical Readings on the Communist Party of China (4 Vols. Set)’, Brill, pp. 1141–1177.
Holtbr¨ugge, D. and D¨ogl, C. (2012), ‘How international is corporate environmental responsi-bility? A literature review’, Journal of International Management 18(2), 180–195.
Islam, M. A. and Deegan, C. (2008), ‘Motivations for an organisation within a developing country to report social responsibility information’, Accounting, Auditing & Accountability Journal .
Jia, K. and Chen, S. (2019), ‘Could campaign-style enforcement improve environmental per-formance? Evidence from China’s central environmental protection inspection’, Journal of Environmental Management 245, 282–290.
Jo, H. and Harjoto, M. A. (2012), ‘The causal effect of corporate governance on corporate social responsibility’, Journal of Business Ethics 106(1), 53–72.
Kostka, G. (2014), Barriers to the implementation of environmental policies at the local level in China, The World Bank.
Kostka, G. (2016), ‘Command without control: The case of China’s environmental target system’, Regulation & Governance 10(1), 58–74.
Kostka, G. and Nahm, J. (2017), ‘Central–local relations: Recentralization and environmental governance in China’, The China Quarterly 231, 567–582.
Kung, J. K.-s. and Ma, C. (2018), ‘Friends with benefits: How political connections help to sustain private enterprise growth in China’, Economica 85(337), 41–74.
Kuzey, C. and Uyar, A. (2017), ‘Determinants of sustainability reporting and its impact on firm value: Evidence from the emerging market of Turkey’, Journal of Cleaner Production 143, 27–39.
Li, W. and Zhang, R. (2010), ‘Corporate social responsibility, ownership structure, and po-litical interference: Evidence from China’, Journal of Business Ethics 96(4), 631–645. Li, X., Yang, X., Wei, Q. and Zhang, B. (2019), ‘Authoritarian environmentalism and
environ-mental policy implementation in China’, Resources, Conservation and Recycling 145, 86– 93.
Li, Z., Liao, G. and Albitar, K. (2020), ‘Does corporate environmental responsibility engage-ment affect firm value? The mediating role of corporate innovation’, Business Strategy and the Environment 29(3), 1045–1055.
Liu, X., Liu, B., Shishime, T., Yu, Q., Bi, J. and Fujitsuka, T. (2010), ‘An empirical study on the driving mechanism of proactive corporate environmental management in China’, Journal of Environmental Management 91(8), 1707–1717.
Lo, C. W.-H. and Fryxell, G. E. (2005), ‘Governmental and societal support for environmental enforcement in China: an empirical study in Guangzhou’, Journal of Development Studies 41(4), 558–588.
Lo, K. (2015), ‘How authoritarian is the environmental governance of China?’, Environmental Science & Policy 54, 152–159.
Mangena, M., Tauringana, V. and Chamisa, E. (2012), ‘Corporate boards, ownership struc-ture and firm performance in an environment of severe political and economic crisis’, British
Mellahi, K., Frynas, J. G., Sun, P. and Siegel, D. (2016), ‘A review of the nonmarket strategy literature: Toward a multi-theoretical integration’, Journal of Management 42(1), 143–173. Mitchell, R. K., Agle, B. R. and Wood, D. J. (1997), ‘Toward a theory of stakeholder iden-tification and salience: Defining the principle of who and what really counts’, Academy of Management Review 22(4), 853–886.
Pfeffer, J. and Salancik, G. R. (2003), The external control of organizations: A resource dependence perspective, Stanford University Press.
Porter, M. E. and Kramer, M. R. (2006), ‘The link between competitive advantage and corporate social responsibility’, Harvard Business Review 84(12), 78–92.
Porter, M. E. and Van der Linde, C. (1995), ‘Toward a new conception of the environment-competitiveness relationship’, Journal of Economic Perspectives 9(4), 97–118.
Przychodzen, W., G´omez-Bezares, F. and Przychodzen, J. (2018), ‘Green information tech-nologies practices and financial performance–the empirical evidence from German publicly traded companies’, Journal of Cleaner Production 201, 570–579.
Ran, R. (2013), ‘Perverse incentive structure and policy implementation gap in China’s local environmental politics’, Journal of Environmental Policy & Planning 15(1), 17–39. Sands, J., Lee, K.-H., Qian, W., Burritt, R. and Chen, J. (2015), ‘The potential for
environ-mental management accounting development in China’, Journal of Accounting & Organi-zational Change .
Shen, F., Ma, Y., Wang, R., Pan, N. and Meng, Z. (2019), ‘Does environmental performance affect financial performance? Evidence from Chinese listed companies in heavily polluting industries’, Quality & Quantity 53(4), 1941–1958.
Stock, G. N., Greis, N. P. and Fischer, W. A. (2002), ‘Firm size and dynamic technological innovation’, Technovation 22(9), 537–549.
Tantalo, C. and Priem, R. L. (2016), ‘Value creation through stakeholder synergy’, Strategic Management Journal 37(2), 314–329.
Tian, M., Xu, G. and Zhang, L. (2019), ‘Does environmental inspection led by central gov-ernment undermine Chinese heavy-polluting firms’ stock value? The buffer role of political connection’, Journal of Cleaner Production 236, 117695.
Trumpp, C. and Guenther, T. (2017), ‘Too little or too much? Exploring U-shaped relation-ships between corporate environmental performance and corporate financial performance’, Business Strategy and the Environment 26(1), 49–68.
Van Rooij, B., Zhu, Q., Na, L. and Qiliang, W. (2017), ‘Centralizing trends and pollution law enforcement in China’, The China Quarterly 231, 583–606.
Walder, A. G. (2002), ‘Markets and income inequality in rural China: Political advantage in an expanding economy’, American Sociological Review pp. 231–253.
Wang, A. L. (2013), ‘The search for sustainable legitimacy: environmental law and bureau-cracy in China’, Harv. Envtl. L. Rev. 37, 365.
Wang, Q., Wong, T.-J. and Xia, L. (2008), ‘State ownership, the institutional environ-ment, and auditor choice: Evidence from China’, Journal of Accounting and Economics 46(1), 112–134.
Wang, S., Zhou, C., Wang, Z., Feng, K. and Hubacek, K. (2017), ‘The characteristics and drivers of fine particulate matter (PM2.5) distribution in China’, Journal of Cleaner Pro-duction 142, 1800–1809.
Wang, Y. (2016), ‘Beyond local protectionism: China’s state–business relations in the last two decades’, The China Quarterly 226, 319–341.
Wu, W., Liang, Z. and Zhang, Q. (2020), ‘Effects of corporate environmental responsibility strength and concern on innovation performance: The moderating role of firm visibility’, Corporate Social Responsibility and Environmental Management 27(3), 1487–1497. Yang, D. L. (2017), ‘China’s Illiberal Regulatory State in Comparative Perspective’, Chinese
Political Science Review 2(1), 114–133.
Yu, X. and Wang, H. (2013), ‘How should the center lead China’s reforestation ef-forts?—Policy making games between central and local governments’, Resources, Con-servation and Recycling 80, 64–84.
Zeng, S., Xu, X., Dong, Z. and Tam, V. W. (2010), ‘Towards corporate environmen-tal information disclosure: an empirical study in China’, Journal of Cleaner Production 18(12), 1142–1148.
Zhang, B., Chen, X. and Guo, H. (2018), ‘Does central supervision enhance local environmen-tal enforcement? Quasi-experimenenvironmen-tal evidence from China’, Journal of Public Economics 164, 70–90.
Zhang, K.-m. and Wen, Z.-g. (2008), ‘Review and challenges of policies of environmental protection and sustainable development in China’, Journal of Environmental Management 88(4), 1249–1261.
Table 1: CER evaluation system
Dimensions Indicators
Legal consciousness
1. Whether to follow the Global Reporting Initiative Sustainable Reporting Guidelines; 2. Whether to disclose the environment and sustainable development information; 3. Whether subjected to environmental penalties.
Social evaluation 1. Whether received an environmental commendation; 2. Whether to have environmental advantages.
Eco-friendly production
1. Whether to adopt a circular economy; 2. Whether to carry out green production; 3. Whether to discharge pollution. Low carbon technology 1. Whether to save energy;
2. Whether to develop or apply environmentally friendly technologies.
Green management
1. Whether to have a third-party verification; 2. Whether to have an ISO 14001 certification; 3. Whether to adopt a green office.
Note: This CER evaluation system is directly referred to Li et al. (2020).
Table 2: Variable description Variables Description
Tobin’s Q Market value divided by total assets CER Measured by CER evaluation system Period Measured as 1 if in shaky period, otherwise 0
Inspect Measured as 1 if firm i in year t is under inspection, otherwise 0 SIZE The natural logarithm of total assets
LEVE Operating leverage multiplied by financial leverage DEBT The total debt divided by total assets
CR The current assets divided by current liabilities FA Fixed assets divided by total assets
AGE The firm listing age
SOECG Measured as 1 if firm i is state-owned enterprises affiliated by the central government, otherwise 0 SOELG Measured as 1 if firm i is state-owned enterprises affiliated by the local government, otherwise 0 PE Measured as 1 if firm i is private enterprises, otherwise 0
Province fixed effect Province dummies to control for common features at province level Industry fixed effect Industry dummies to control for common features at Industrial level Year fixed effect Time dummies to control for common macroeconomic effect Firm fixed effect Control for common features at firm level
Table 3: Descriptive statistics
Sample Variable N Mean SD Min P25 Median P75 Max TobinsQ 6232 2.082 1.407 0.818 1.163 1.591 2.413 8.322 CER 6232 6.045 1.898 1.000 5.000 6.000 7.000 13.000 FA 6232 0.232 0.184 0.002 0.083 0.185 0.341 0.753 CR 6232 1.980 1.887 0.252 1.049 1.451 2.136 12.984 DEBT 6232 0.478 0.197 0.064 0.329 0.489 0.630 0.860 LEVE 6232 2.447 2.935 0.966 1.229 1.530 2.246 21.346 SIZE 6232 23.128 1.482 18.650 22.050 22.988 24.041 28.509 Whole AGE 6232 12.135 6.696 0.000 7.000 12.000 17.000 28.000 TobinsQ 3386 2.216 1.476 0.818 1.241 1.703 2.587 8.322 CER 3386 5.956 1.774 2.000 5.000 6.000 7.000 12.000 FA 3386 0.241 0.185 0.002 0.093 0.194 0.356 0.753 CR 3386 2.045 2.078 0.252 1.044 1.437 2.142 12.984 DEBT 3386 0.481 0.202 0.064 0.330 0.493 0.640 0.860 LEVE 3386 2.553 3.250 0.966 1.208 1.509 2.251 21.346 SIZE 3386 22.899 1.464 19.276 21.872 22.775 23.770 28.509 Period=0 AGE 3386 10.597 5.922 0.000 5.000 11.000 15.000 25.000 Period=1 TobinsQ 2846 1.923 1.303 0.818 1.079 1.475 2.237 8.322 CER 2846 6.151 2.032 1.000 5.000 6.000 8.000 13.000 FA 2846 0.221 0.181 0.002 0.076 0.176 0.329 0.753 CR 2846 1.902 1.626 0.252 1.056 1.466 2.121 12.984 DEBT 2846 0.474 0.190 0.064 0.328 0.483 0.618 0.860 LEVE 2846 2.321 2.503 0.966 1.245 1.554 2.237 21.346 SIZE 2846 23.399 1.457 18.650 22.342 23.301 24.288 28.509 AGE 2846 13.964 7.093 0.000 8.000 15.000 20.000 28.000
Note: Our sample contains all listed firms in the Chinese A-share market after dropping special treatment (ST) firms and observations with missing values. The whole period of the sample is 2006-2019. “Period =0” refers to subsamples in a steady period (2006-2015), “Period =1” refers to subsamples in a shaky period (2016-2019). The total numbers of firms and observations are 1004 and 6232, respectively.
Table 4: Correlation matrix
TobinsQ CER Period FA CR DEBT LEVE SIZE AGE
TobinsQ 1 CER -0.187*** 1 Period -0.104*** 0.051*** 1 FA -0.172*** 0.097*** -0.053*** 1 CR 0.390*** -0.167*** -0.038*** -0.267*** 1 DEBT -0.455*** 0.171*** -0.019 -0.003 -0.630*** 1 LEVE -0.168*** 0.024* -0.039*** 0.309*** -0.197*** 0.234*** 1 SIZE -0.473*** 0.373*** 0.168*** 0.074*** -0.394*** 0.565*** 0.090*** 1 AGE -0.271*** 0.070*** 0.250*** -0.029** -0.194*** 0.229*** 0.067*** 0.281*** 1 Note: This table reports the correlation coefficients of each variable in our main regression. All of correlation coefficients are below 0.8 which indicates there are no significant multi-collinearity problem.
Table 5: The relation between CER and firm value in two periods (1) (2) (3) (4) OLS OLS FE FE CER -0.108*** -0.032*** -0.045*** -0.038*** (-9.71) (-3.14) (-3.68) (-3.22) CER*Period 0.067*** 0.065*** 0.059*** 0.062*** (4.52) (4.95) (4.19) (4.61) Period -0.504 -0.087 -0.992*** -3.343*** (-1.52) (-0.25) (-3.09) (-7.48) FA -0.676*** -0.268 (-5.70) (-1.05) CR 0.055*** -0.034 (3.57) (-1.54) DEBT -0.981*** -0.170 (-7.92) (-0.68) LEVE -0.025*** -0.031*** (-6.14) (-7.23) SIZE -0.227*** -0.577*** (-16.26) (-8.01) AGE -0.029*** 0.272*** (-11.47) (11.07) Constant 3.870*** 8.795*** 2.560*** 14.270*** (9.47) (17.33) (8.10) (9.17) Industry Yes Yes Yes Yes Province Yes Yes Yes Yes Year Yes Yes Yes Yes Firm No No Yes Yes N 6232 6232 6232 6232 adj. R2 0.372 0.496 0.270 0.319
Note: This table reports the OLS and fixed-effect (FE) regression re-sults of research in which the dependent variable is Tobin’ Q. Our pri-mary concern is whether the impact of CER on firm value increased in shaky period (Period =1 refers to the shaky period, 0 otherwise). The coefficient of CER captures the relationship between CER and firm value in a steady period. The interaction term CER*Period captures the incremental impact of CER in a shaky period. We report the OLS regression results with industry, province and year fixed effects included in columns (1) and (2), FE regression results with firm and year fixed effects included in columns (3) and (4). Besides, in columns (3) and (4), the control variables are added while there are no control variables in columns (1) and (2). The t-statistics (in parentheses) are based on heteroscedasticity-consistent standard errors. * denotes p < 0.1, ** denotes p < 0.05, *** denotes p < 0.01.
Table 6: The moderating effect of ownership type
(1) (2) (3) (4) (5) (6) OLS OLS OLS FE FE FE SOECG SOELG PE SOECG SOELG PE CER -0.027* -0.033** -0.018 -0.064*** -0.026 -0.025 (-1.70) (-2.49) (-0.87) (-3.37) (-1.60) (-1.06) CER*Period 0.072*** 0.068*** 0.055** 0.078*** 0.054*** 0.049* (3.36) (4.06) (2.08) (3.24) (2.75) (1.95) Period 1.479*** -0.563 0.400 -3.157*** -2.236*** -4.461*** (4.63) (-1.44) (0.94) (-3.24) (-3.80) (-6.13) FA -0.126 -0.777*** -0.696** 0.477 0.277 -1.244* (-0.55) (-5.67) (-2.47) (1.33) (1.09) (-1.95) CR 0.118*** -0.026 0.033 0.058 -0.014 -0.070** (2.96) (-1.06) (1.43) (1.35) (-0.35) (-2.43) DEBT -0.716*** -0.791*** -1.242*** -0.211 0.339 -0.311 (-2.84) (-5.09) (-4.67) (-0.57) (1.00) (-0.63) LEVE -0.023*** -0.026*** -0.045*** -0.031*** -0.022*** -0.046*** (-3.08) (-5.83) (-3.91) (-4.20) (-4.15) (-4.13) SIZE -0.295*** -0.214*** -0.245*** -0.601*** -0.319*** -0.662*** (-12.63) (-9.69) (-7.66) (-5.27) (-3.97) (-4.95) AGE -0.024*** -0.010** -0.030*** 0.188*** 0.147*** 0.412*** (-4.63) (-2.23) (-5.98) (5.00) (4.96) (8.43) Constant 7.094*** 7.288*** 8.793*** 15.722*** 8.075*** 16.653*** (11.87) (10.08) (11.92) (6.15) (4.68) (5.94) Industry Yes Yes Yes Yes Yes Yes Province Yes Yes Yes Yes Yes Yes Year Yes Yes Yes Yes Yes Yes Firm No No No Yes Yes Yes N 1518 2242 2472 1518 2242 2472 adj. R2 0.603 0.519 0.477 0.330 0.306 0.375
Note: This table reports the OLS and fixed-effect (FE) regression results of ownership type subsam-ples in which the dependent variable is Tobin’s Q. We report the OLS results with industry, province and year fixed effects included in columns (1), (2) and (3), FE regression results with firm and year fixed effects included in columns (4), (5) and (6). The t-statistics (in parentheses) are based on heteroscedasticity-consistent standard errors. * denotes p < 0.1, ** denotes p < 0.05, *** denotes p < 0.01
Table 7: Regression results with lagged explanatory variables (1) (2) (3) (4) OLS OLS FE FE L.CER -0.099*** -0.028** -0.034*** -0.025** (-8.32) (-2.56) (-2.61) (-2.02) L.CER*Period 0.058*** 0.054*** 0.056*** 0.052*** (3.72) (3.86) (3.64) (3.49) Period -0.590 -0.245 -1.489*** -3.296*** (-1.03) (-0.46) (-4.40) (-7.09) L.FA -0.554*** -0.152 (-4.52) (-0.59) L.CR 0.057*** -0.030 (3.56) (-1.31) L.DEBT -0.875*** 0.302 (-6.95) (1.23) L.LEVE -0.009 -0.014** (-1.53) (-2.31) L.SIZE -0.213*** -0.563*** (-15.07) (-7.32) AGE -0.024*** 0.229*** (-8.54) (9.45) Constant 4.085*** 8.674*** 2.975*** 14.159*** (6.25) (12.64) (9.07) (8.60) Industry Yes Yes Yes Yes Province Yes Yes Yes Yes Year Yes Yes Yes Yes Firm No No Yes Yes N 4826 4826 4826 4826 adj. R2 0.393 0.504 0.259 0.297
Note: We lag some explanatory variables by one year and perform the OLS and FE regression to alleviate the endogenous problem caused by simultaneity or reverse causality. The t-statistics (in parentheses) are based on heteroscedasticity-consistent standard errors. * denotes p < 0.1, ** denotes p < 0.05, *** denotes p < 0.01
Table 8: 2SLS regression results
(1) (2) (3) (4) First Second First Second IV CER 0.980*** 0.786*** (28.12) (21.89) CER -0.587*** -0.300*** (-11.64) (-5.89) CER*Period 0.204*** 0.158*** (3.29) (2.96) Period 1.769*** -0.496 1.108*** -0.288 (4.90) (-1.00) (2.95) (-0.70) Controls No No Yes Yes Province Yes Yes Yes Yes Year Yes Yes Yes Yes N 6232 6232 6232 6232 adj. R2 0.188 . 0.259 0.336
Note: To alleviate the endogenous concerns on omitted correlated variables, we conduct the instrumental variables method, we use the average CER of all other firms in the same industry as the instru-mental variable. We report results of the instruinstru-mental variables ap-proach in this table, columns (1) and (2) without control variables while columns (3) and (4) with control variables. The t-statistics (in parentheses) are based on heteroscedasticity-consistent standard errors. * denotes p < 0.1, ** denotes p < 0.05, *** denotes p < 0.01.
Table 9: The relationship between CER and firm value in period subsamples
(1) (2) (3) (4) OLS OLS FE FE Period=0 Period=1 Period=0 Period=1 CER -0.026** 0.025** -0.005 0.001 (-2.43) (2.37) (-0.34) (0.11) FA -0.559*** -0.697*** -0.216 0.097 (-3.34) (-4.11) (-0.55) (0.26) CR 0.013 0.144*** -0.068** 0.024 (0.71) (5.42) (-2.43) (0.63) DEBT -1.331*** -0.449** 0.226 -1.110** (-7.95) (-2.44) (0.65) (-2.43) LEVE -0.024*** -0.022*** -0.038*** -0.020*** (-4.09) (-3.74) (-5.42) (-3.13) SIZE -0.258*** -0.189*** -0.796*** -0.020 (-13.68) (-8.98) (-7.23) (-0.14) AGE -0.026*** -0.033*** 0.185*** -0.203*** (-6.47) (-10.03) (4.59) (-11.32) Constant 9.676*** 7.828*** 18.872*** 5.847* (16.01) (13.77) (8.10) (1.88) Industry Yes Yes Yes Yes Province Yes Yes Yes Yes Year Yes Yes Yes Yes Firm No No Yes Yes N 3386 2846 3386 2846 adj. R2 0.528 0.482 0.322 0.299
Note: Period =0 refers to steady period, and Period =1 refers to shaky period. Columns (1) and (2) are OLS regression with indus-try, province and year fixed effects controlled. Columns (3) and (4) are FE regression with firm and year fixed effects controlled. The t-statistics (in parentheses) are based on heteroscedasticity-consistent standard errors. * denotes p < 0.1, ** denotes p < 0.05, *** denotes p < 0.01
Table 10: Inspection time periods and inspected provinces
Inspection batches Provinces subjected to EICG 2016.1.1-2016.2.5 Hebei
2016.7.12-2016.8.19 Inner Mongolia, Heilongjiang, Jiangsu, Jiangxi, Henan, Guangxi, Yunnan, and Ningxia 2016.11.24-2016.12.30 Beijing, Shanghai, Hubei, Guangdong, Chongqing, Shanxi, and Gansu
2017.4.24-2017.5.28 Shanxi, Anhui, Tianjin, Hunan, Fujian, Liaoning, and Guizhou
2017.8.7–2017.9.15 Jilin, Zhejiang, Shandong, Hainan, Sichuan, Xizang, Qinghai, and Xinjiang
Note: EICG is conducted in 5 batches with each lasted about one months. Several provinces are under inspection in each batch expect for the pilot province Hebei.
Table 11: DID results for EICG (1) (2) (3) (4) OLS OLS FE FE CER -0.110*** -0.036*** -0.049*** -0.042*** (-10.17) (-3.72) (-4.19) (-3.69) CER*Inspect 0.077*** 0.080*** 0.073*** 0.076*** (5.21) (6.14) (5.37) (5.78) Inspect -0.587*** -0.581*** -0.533*** -0.527*** (-4.11) (-4.70) (-4.82) (-4.93) FA -0.674*** -0.263 (-5.69) (-1.03) CR 0.055*** -0.034 (3.57) (-1.55) DEBT -0.977*** -0.171 (-7.89) (-0.69) LEVE -0.025*** -0.031*** (-6.13) (-7.20) SIZE -0.228*** -0.578*** (-16.33) (-8.03) AGE -0.030*** 0.049* (-11.52) (1.82) Constant 3.886*** 8.841*** 2.585*** 15.073*** (9.53) (17.43) (8.19) (9.59) Industry Yes Yes Yes Yes Province Yes Yes Yes Yes Year Yes Yes Yes Yes Firm No No Yes Yes N 6232 6232 6232 6232 adj. R2 0.373 0.497 0.272 0.321
Note: Inspect captures whether the firm is after the inspection then. CER*Inspect captures the incremental impact of CER on firm value after the EICG. The t-statistics (in parentheses) are based on heteroscedasticity-consistent standard errors. * denotes p < 0.1, ** de-notes p < 0.05, *** dede-notes p < 0.01
Table 12: Placebo test results
(1) (2) (3) (4) Whole SOECG SOELG PE CER*Period14 -0.010 -0.022 0.024 -0.040 (-0.66) (-0.83) (1.18) (-1.42) CER*Period15 0.002 -0.001 0.024 -0.019 (0.17) (-0.02) (1.31) (-0.70) CER*Period 0.062*** 0.078*** 0.054*** 0.049* (4.61) (3.24) (2.75) (1.95) CER*Period17 0.094*** 0.127*** 0.078*** 0.075*** (7.23) (5.26) (3.90) (3.27) CER*Period18 0.088*** 0.123*** 0.078*** 0.057** (7.10) (5.46) (4.36) (2.36) Controls Yes Yes Yes Yes Firm Yes Yes Yes Yes Year Yes Yes Yes Yes N 6232 1518 2242 2472 adj. R2 0.315 0.322 0.301 0.374
Note: We use Period14 to represent the shaky period from 2014, CER*Period14 captures the incremental impact of CER on firm value in the assumed shaky period. The other interaction terms have the similar meanings. We report all the assumed incremental im-pacts in this table. The t-statistics (in parentheses) are based on heteroscedasticity-consistent standard errors. * denotes p < 0.1, ** denotes p < 0.05, *** denotes p < 0.01