Study on the influence of sequence of green
fluorescent protein gene on expression
efficiency in Escherichia coli
(大腸菌内での緑色蛍光タンパク質遺伝子の塩基配列が発現効率
に及ぼす影響に関する研究)
Xiaoliang Hao
Contents
Abstract ... 1
Chapter 1 General introduction ... 4
1.1 Background and significance... 4
1.2 Genetic engineering ... 6
1.3 Escherichia coli (E. coli) ... 7
1.4 Green fluorescent protein (GFP) ... 7
1.4.1 Definition of GFP ... 7
1.4.2 Characteristics of GFP ... 8
1.4.3 Application of GFP ... 8
References ... 9
Figures ... 14
Chapter 2 Influence of last sense codon on expression efficiency of GFP gene in E. coli ... 16
2.1 Introduction ... 16
2.2 Experimental ... 17
2.2.1 Bacterial strains and plasmids ... 17
2.2.2 Insertion of last sense codon to GFP gene ... 17
2.2.3 Digestion with the restriction enzymes EcoRI and HindIII ... 18
2.2.4 Dephosphorylation with calf intestine alkaline phosphatase (CIAP) ... 19
2.2.5 Purification of pKK223-3 digested with EcoRI and HindIII, and PCR products of GFP gene digested with EcoRI and HindIII ... 19
2.2.6 Ligation and transformation ... 19
2.2.7 Sequence of GFP gene in the expression vector pKK223-3... 20
2.2.8 Measurement of fluorescence intensity of GFP in E. coli ... 20
2.2.9 SDS-PAGE (SDS-Polyacrylamide Gel Electrophoresis) of soluble proteins extracted from E. coli ... 21
2.3.2 SDS-PAGE of soluble proteins extracted from E. coli ... 23
2.4 Conclusions ... 24
References ... 25
Figures and tables ... 26
Chapter 3 Influence of the combination of last sense codon and stop codon on expression efficiency of GFP gene in E. coli ... 34
3.1 Introduction ... 34
3.2 Experimental ... 35
3.3 Results and discussions ... 36
3.3.1 Comparison of three kinds of stop codons without insertion of last sense codon by the expression vector pKK223-3 ... 36
3.3.2 Comparison of the RFI by the stop codon was changed by the expression vector pKK223-3 ... 36
3.3.3 Comparison of the RFI by the stop codon was changed by the expression vector pET21(+) ... 37
3.3.4 Comparison of expression vectors (pKK223-3 and pET21(+)) ... 37
3.3.5 SDS-PAGE of soluble proteins extracted from E. coli ... 38
3.4 Conclusions ... 38
References ... 40
Figures and tables ... 41
Chapter 4 Study on the relationship between mutation and expression efficiency of GFP gene in E. coli ... 49
4.1 Introduction ... 49
4.2 Experimental ... 50
4.3 Results and discussions ... 52
4.3.1 Construction of mutant genes ... 52
4.3.2 SDS-PAGE of soluble proteins extracted from E. coli ... 54
4.4 Conclusions ... 54
References ... 55
Chapter 5 Conclusions and unresolved problems ... 63
5.1 Conclusions ... 63
5.2 Unresolved problems ... 64
Figure ... 65
Appendix: Abbreviation ... 66
Appendix: Reagents and equipments ... 67
List of publications ... 70
Abstract
This dissertation describes the influence of sequence of green fluorescent protein (GFP) gene on expression efficiency in Escherichia coli (E. coli).
Gene expression in E. coli has been the most popular means of producing recombinant proteins. E. coli is a very useful host that offers efficient culturing efficiency, easy manipulation and low cost media. People have produced a wide variety of different types of proteins in E. coli. Although many proteins are useful for the humans, these proteins can only rarely be obtained in sufficiently large quantities from their natural sources. Therefore, such proteins are often produced in E. coli via genetic engineering. The expression efficiency of genes in E. coli is very important in genetic engineering, and the codon composition of coding sequences plays an important role in the regulation of gene expression. To master the relationship between the gene sequence and gene expression is helpful for understanding principles of gene expression and effectively controlling the production of protein. It is hoped that the results would be helpful for the further study of gene expression. The dissertation composes of the following 5 chapters:
Chapter 1 General introduction
This chapter introduced background and significance of this research. It included the definition, principles of genetic engineering, the definition of E. coli, also included the definition, characteristics, application of GFP, gene expression, etc.
Chapter 2 Influence of last sense codon on expression efficiency of GFP gene in E. coli
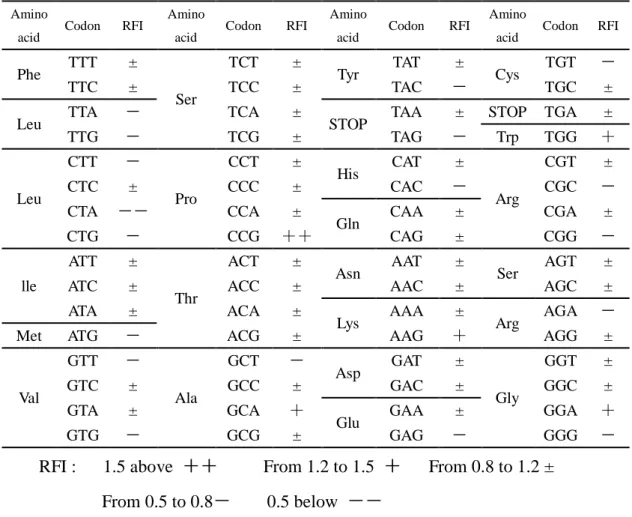
were acquired. GFP-fusion fluorescence intensity was an excellent indicator of over-expression potential. Because fluorescence was one of the most convenient ways to follow a gene expression, so the fluorescence intensity was used to analyze the expression efficiency of GFP gene. Because the fluorescence intensity was easy to be measured and quantified, it was used to compare the expression efficiency of GFP gene. Relative fluorescent intensity (RFI) was normalized with the fluorescence intensity of the wild type GFP, and had been applied in analyzing the expression efficiency. By research, the strongest RFI (2.1) was observed with a CCG last sense codon, while the lowest RFI (0.33) was observed with a CTA last sense codon. The RFIs of the GFP genes with the other 62 kinds of last sense codons were 0.7-1.5.
For the last sense codons which belonged to the same amino acids, the GFP genes with the last sense codons showed the nearly same RFIs. For example, for phenylalanine (coded by TTT and TTC), the RFIs were close, indicating similar in the quantities of GFP produced, but not variation in the amino acid sequence. Similar tendency was seen for the other amino acids. However, for some last sense codons, the differences were clear; for example, the RFIs were different among the six last sense codons for leucine (TTA, TTG, TCT, TCC, TCA, and TCG).
Our experiments revealed that the last sense codon influenced the expression efficiency of the GFP gene in E. coli; however, clear rule between the last sense codon and the expression efficiency of the GFP gene had not been found.
Chapter 3 Influence of the combination of last sense codon and stop codon on expression efficiency of GFP gene in E. coli
by the expression vector pET21(+).
Chapter 4 Research on the relationship between mutant gene and protein synthesis efficiency of GFP in E. coli
In our previous work, 20 mutant GFP genes had been acquired. In order to know the relationship between mutant gene and protein synthesis efficiency easily, the mutant GFP gene with a single point mutation was chosen. Next, one special mutant GFP(ACC) was found, whose inserted last sense codon was ACC, had three mutant sites, at 56, 357 and 443 position of the GFP gene. The RFI of E. coli having this vector indicated 0.1. Meantime, other four mutant GFP genes with one mutant site were acquired. Finally, the influence of six mutant GFP genes on expression efficiency in E.
coli was studied, and the relationship between the mutant gene and expression
efficiency was discussed. It was found that some mutant genes of GFPs had influenced on the expression efficiency of GFP gene and the mutant A443G showed the lowest RFI (0.04), and mutant A88G showed the lower RFI (0.16), mutant A402G showed the stronger RFI (1.2).
Chapter 5 Conclusions and recommendations
In this chapter, the results in the preceding chapters were summarized, the conclusions were given. The gene sequence had close relationship with the expression efficiency of the GFP gene in E. coli. Some GFP genes with the last sense codons had stronger fluorescence intensities and got the more expression quantities of proteins. The expression vector (pKK223-3 and pET21(+)) had some same points, but showed great differences on genetic expression. The point mutation of GFP gene could greatly influence the gene expression.
General introduction
Chapter 1 General introduction
1.1 Background and significance
Genetic engineering was introduced around 1970 as a strongly potent strategy for genetic research at the level of DNA molecules, the carriers of genetic information. This strategy consists principally of introducing nucleotide sequence alterations into DNA molecules, such as by site-directed mutagenesis and by splicing DNA segments from different locations in the genome or from different kinds of organisms (recombinant DNA molecules) [1].
Since the 1990s, genetic modification has been the focus of debate, owing to its increased use and effect on our lives. There is evidence that genetic modification, including genetic engineering and biotechnology, has appeared in a number of areas, ranging from agriculture, chemical engineering, industry and the food industry, to medicine, molecular biology, environmental protection and human health. However, this increasing appearance of genetic modification in various areas has resulted in growing interest, concerns, ethical and social issues not only in scientific communities but in public ones as well; so, genetic modification is recognized as a socioscientific issue [2].
Protein is an essential nutrient which helps forming structural component of body tissues and is used within many biological processes, for example protein is used to make enzymes, antibodies to help us fight infection as well as DNA the building blocks to life. It’s also needed to make up muscle tissue which in turn helps to keep our bodies active, strong, and healthy. Biomedical and biotechnological research relies on processes leading to the successful expression and production of key biological products. Strong-quality proteins are required for many purposes, including protein structural and functional studies. Gene expression is the culmination of multistep processes involving regulation at the level of transcription, mRNA turnover, translation, and post-translational modifications leading to the formation of a stable product [3-4].
Chapter 1
elegantly used to strong-light sensory neurons in the nematode [5-6]. Since then, the race has been on to produce new and improved versions that are brighter, cover a broad spectral range, and also exhibit enhanced photostability, reduced oligomerization, pH insensitivity, and faster maturation rates. GFP has attracted widespread interest and is considered to have several advantages over other visual marker genes. First, the fluorescence emission of GFP does not require a cofactor or a substrate [7]. The second advantage of GFP is that it is relatively small and can tolerate both N- and C-terminal protein fusions, lending itself to studies of protein localization and intracellular protein trafficking [8-10]. The third advantage of GFP is that GFP mutants with shifted wave-lengths of absorption and emission have been isolated, which permits simultaneous use and detection of multiple reporter genes [11-13].
Gene expression in Escherichia coli (E. coli) has been the most popular means of producing recombinant proteins. E. coli is a very useful host that offers efficient culturing efficiency, easy manipulation and low cost media. People have produced a wide variety of different types of proteins by E. coli [14-21]. Although many proteins are useful for the humans, these proteins can only rarely be obtained in sufficiently large quantities from their natural sources. Therefore, such proteins are often produced in E. coli via genetic engineering.
The expression efficiency of genes in E. coli is very important in genetic engineering, and the codon composition of coding sequences plays an important role in the regulation of gene expression. To master the relationship between the gene sequence and gene expression is helpful for understanding principles of gene expression and effectively controlling the production of protein. The researches about codon, protein, and gene expression have attracted wide attention of people and made great achievements, for example some models had been constructed [22-24], some new methods had been detected and applied to research [25-27].
General introduction
screening of large numbers of samples for selection of desired functions. There is a significant association between codon bias and translation efficiency across all endogenous genes in E. coli [28]. It has long been known that codon preference is related to gene expression [29-32]. Eighteen of the 20 amino acids are each encoded by two or more synonymous codons in the standard genetic code, yet the synonymous codons are often used unequally in a genome. Such codon usage bias has been extensively documented in all three domains of life [30, 31, 33]. Within a genome, strongly expressed genes tend to have stronger codon usage bias than lowly expressed ones and the codons preferentially used in strongly expressed genes of a species are referred to as preferred codons. Codon-usage bias has been observed in almost all genomes and is thought to result from selection for efficient and accurate translation of strongly expressed genes [34-37]. Codon usage is also implicated in the control of transcription, splicing and RNA structure [38-40].
1.2 Genetic engineering
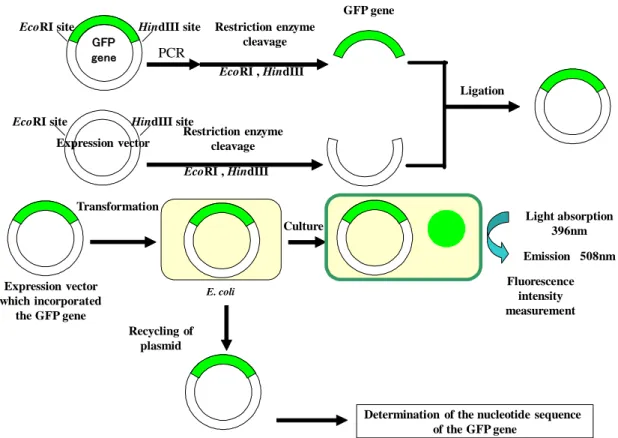
Genetic engineering also can be the rearrangement of gene location or the removal of genes. The “altered” organism then makes new substances or performs new functions based on its new DNA. The chart of Genetic engineering was shown in Fig. 1.1. For example, the protein insulin, used in the treatment of diabetes, now can be produced in large quantities by genetically engineered bacteria and yeasts. Insulin was formerly extracted from pigs or cows [41].
Chapter 1
genetically engineered life forms. Genetic engineering has also helped create thousands of organisms and processes useful in medicine, research, and manufacturing. Genetically engineered bacteria churn out insulin for treating human diabetes, production of which would be substantially more expensive without the use of genetic engineering [14].
1.3 Escherichia coli (E. coli)
E. coli is a gram-negative bacillus, which is made up of species present in the
human and other animal intestine. When eliminated in the environment together with feces it contaminates water, soil and food. E. coli is a convenient host for gene expression and one of the organisms of choice for the production of recombinant proteins, it has become the most popular expression platform. Its advantages include strong levels of heterologous gene expression and scalability of experiments, low cost, fast growth, a lack of posttranslational modification and an ablity to express labeled proteins and is one of the organisms of choice for the production of recombinant proteins. Its use as a cell factory is well-established and it has become the most popular expression platform [16-21, 43].
1.4 Green fluorescent protein (GFP) 1.4.1 Definition of GFP
General introduction
1.4.2 Characteristics of GFP
GFP is composed of 238 amino acids and hence a rather small protein with a molecular weight of roughly 27,000 [51]. Excitation at 396 nm results in an emission maximum at 508 nm [52]. The expression of GFP gene in E.coli was shown in Fig. 1.4. GFP has been used extensively throughout the biological sciences. GFP has been linked to proteins and promoters from archea to zebrafish and mice. It can quantify cells, components of cells, or reactions within subcellular spaces. Reviews detailing GFP applications are prevalent in the literature and are summarized in a comprehensive review of the chemistry and functional properties of GFP [48].
1.4.3 Application of GFP
The use of GFP as a biosensor for genotoxic compounds has also been gaining momentum over the past few years. The most common use of GFP is its remains as a reporter of the protein. GFP imparts stability to its fusion partners and allows for facile estimates of protein locale and quantity. GFP is used to accurately monitor bioprocesses, both at the laboratory scale and on an industrial scale. Poppenborg and coworkers provided one of the first examples of bioprocess monitoring using GFP. GFP fluorescence has been used to investigate a remarkable array of properties and behaviors. The main reasons for this are that the chromophore of GFP is produced through an internal posttranslational autocatalytic cyclization that does not require any cofactors or substrates, fusion of GFP to a protein rarely affects the proteins activity or mobility, and GFP is nontoxic in most cases [48, 53].
Chapter 1
References
1. Arber, W. Genetic engineering compared to natural genetic variations. New
Biotechnology., 27, 517-521 (2010).
2. Sadler, T.D., Zeidler, D. L. Patterns of informal reasoning in the context of socioscientific decision making. Journal of Research in Science Teaching., 42, 112-138 (2005).
3. Ordu, E., Karaguler, N. G. Protein Engineering Applications on Industrially
Important Enzymes: Candida methylica FDH as a Case Study. Protein Engineering.
Chapter 4, 75-98 (2015).
4. Angov, E. Codon usage: Nature’s roadmap to expression and folding of proteins.
Biotechnol. J., 6, 650-659 (2011).
5. Shaner, NC., Patterson, GH., Davidson, MW. Advances in fluorescent protein technology. Journal of Cell Science., 120 (24), 4247-4260 (2007).
6. Chalfie, M., Tu, Y., Euskirchen, G., Ward, W. W., Prasher, D. C. Green fluorescent protein as a marker for gene expression. Science., 263, 802-805 (1994).
7. Cody, C. W., Prasher, D. C., Westler, W. M., Prendergast, F. G., Ward, W. W. Chemical structure of the hexapeptide chromophore of the Aequorea green-fluorescent protein. Ward. Biochemistry., 32 (5), 1212-1218 (1993).
8. Wang, S., Hazelrigg, T. Implications for bcd mRNA localization from spatial distribution of exu protein in Drosophila oogenesis. Nature., 369(6479), 400-403 (1994).
9. Davis, I., Girdham, CH., O'Farrell, PH. A nuclear GFP that marks nuclei in living Drosophila embryos; maternal supply overcomes a delay in the appearance of zygotic fluorescence. Dev Biol., 170(2), 726-729 (1995).
10. Kaether, C., Gerdes, H. H. Visualization of protein transport along the secretory pathway using green fluorescent protein. FEBS Lett., 369(2-3), 267-271 (1995).
General introduction
12. Heim, R., Cubitt, AB., Tsien, RY. Improved green fluorescence. Nature., 373, 663-664 (1995).
13. Delagrave, S., Hawtin, RE., Silva, CM., Yang, MM. Red-shifted excitation mutants of the green fluorescent protein. Bio Technology., 13, 151-154 (1995).
14. Tolia, N. H., Leemor, J. T. Strategies for protein coexpression in Escherichia coli.
Nature methods., 3, 55-64 (2006).
15. Rosano, G. L., Ceccarelli, E. A. Recombinant protein expression in Escherichia
coli, advances and challenges. Frontiers in microbiology., 5, 1-17 (2014).
16. Hannig, G., Makrides, SC. Strategies for optimizing heterologous protein expression in Escherichia coli. Tendency in Biotech., 16, 54-60 (1998).
17. Baneyx, F. Recombinant protein expression in Escherichia coli. Curr Opin
Biotechnol., 10, 411-421 (1999).
18. Panda, AK. Bioprocessing of therapeutic proteins from the inclusion bodies of
Escherichia coli. Adv Biochem Eng Biotechnol., 85, 43-93 (2003).
19. Palomares, LA., Estrada-Mondaca, S., Ramirez, OT. Production of recombinant proteins, challenges and solutions: Methods Mol Biol., 2, 15-52 (2004).
20. Mergulhao, FJ., Summers, DK., Monteiro, GA. Recombinant protein secretion in
Escherichia coli. Biotechnol Adv., 23(3), 177-202 (2005).
21. Yin, J., Li, G., Ren, X., Herrler, G. Select what you need: A comparative evaluation of the advantages and limitations of frequently used expression systems for foreign genes. J Bacteriol., 127, 335-347 (2007).
22. Gilchrist, M. A., Wagner, A. A model of protein translation including codon bias, nonsense errors, and ribosome recycling. Journal of Theoretical Biology., 239, 417-434 (2006).
23. Kosiol, C., Holmes, I., Goldman, N. An Empirical Codon Model for Protein Sequence Evolution. Mol. Biol. Evol., 24(7), 1464-1479 (2007).
24. Jukes, T. H., Cantor, C. R. Evolution of protein molecules: Mammalian protein metabolism. Academic Press. New York., 3, 21-132 (1969).
Chapter 1
111-120 (1980).
26. Bielawski, J. P., Yang, Z. H. A maximum likelihood method for detecting functional divergence at individual codon sites, with application to gene family evolution. Journal of Molecular Evolution., 59, 121-132 (2004).
27. Suzek, B. E., Ermolaeva, M. D., Schreiber, M., Salzberg, S. L. A probabilistic method for identifying start codons in bacterial genomes. Bioinformatics., 17, 1123-1130 (2001).
28. Tuller, T., Waldman, Y. Y., Kupie, M., Ruppin, E. Translation efficiency is determined by both codon bias and folding energy. Current Issue., 107, 3645-3650 (2009).
29. Grantham, R., Gautier, C., Gouy, M., Jacobzone, M., Mercier, R. Codon catalog usage is a genome strategy modulated for gene expressivity. Nucleic Acids Res., 9, 43-74 (1981).
30. Ikemura, T. Codon usage and tRNA content in unicellular and multicellular organisms. Mol Biol Evol., 2, 13-34 (1985).
31. Sharp, PM., Cowe, E., Higgins, DG., Shields, DC., Wolfe, KH., Wright, F. Codon usage patterns in Escherichia coli, Bacillus subtilis, Saccharomyces cerevisiae, Schizosaccharomyces pombe, Drosophila melanogasterand Homo sapiens; a review of the considerable within species diversity. Nucleic Acids Res., 16, 8207-8211 (1988).
32. Médigue, C., Rouxel, T., Vigier, P., Hénaut, A., Danchin, A. Evidence for horizontal gene transfer in Escherichia coli speciation. J Mol Biol., 222, 851-856 (1991).
33. Hershberg, R., Petrov, DA. General rules for optimal codon choice. Plos Genet.,
5(7), 1-10 (2009).
34. Ikemura, T. Correlation between the abundance of Escherichia coli transfer RNAs and the occurrence of the respective codons in its protein genes: a proposal for a synonymous codon choice that is optimal for the E. coli translational system. J Mol
General introduction
35. Goodman, D. B., Church, G. M., Kosuri, S. Causes and Effects of N-Terminal Codon Bias in Bacterial Genes. Science., 342 (6157), 475-479 (2013).
36. Plotkin, J. B., Kudla, G. Synonymous but not the same: the causes and consequences of codon bias. Nature Reviews Genetics., 12, 32-42 (2011).
37. Drummond, D. A., Wilke, C. O. Mistranslation induced protein missing as a dominant constraint on coding sequence evolution. Cell., 134, 341-352 (2008).
38. Tuller, T., Carmi, A., Vestsigian, K., Navon, S., Dorfan, Y., Zaborske, J., Pan, T., Dahan, O., Furman, I., Pilpel, Y. An evolutionarily conserved mechanism for controlling the efficiency of protein translation. Cell., 141, 344-354 (2010).
39. Gu, W., Zhou, T., Wilke, C. O. A universal tendency of reduced mRNA stability near the translation initiation site in prokaryotes and eukaryotes. Plos Comput Biol.,
6(2), 1-8 (2010).
40. Cannarozzi, G., Schraudolph, NN., Faty, M., Von, R. P., Friberg, MT., Roth, AC., Gonnet, P., Gonnet, G., Barral, Y. A role for codon order in translation dynamics.
Cell., 141, 355-367 (2010).
41. Pecarski, D., Jugovic, Z., Stevanovic, A. Genetic engineering. 15th International Research / Expert Conference. “Tendency in the Development of Machinery and Associated Technology”TMT 2011, Prague, Czech Republic, 12-18 (2011).
42. Singleton, P. Bacteria in Biology, Biotechnology and Medicine (5th ed.). Wiley., 444-454 (1999).
43. Koepsell, D. The ethics of genetics of genetic engineering. A position paper from
the center for inquiry office of public policy., 1-22 (2007).
44. Shimomura, O., Johnson, F. H., Saiga, Y. Extraction, purification and properties of aequorin, a bioluminescent protein from the luminous hydromedusan, Aequorea. J.
Cell Comp. Physiol., 59, 223-239 (1962).
45. Johnson, FH., Shimomura, O., Saiga, Y., Gershman, LC., Reynolds, GT., Waters, JR. Quantum efficiency of Cypridina luminescence, with a note on that of Aequorea.
J. Cell. Comp. Physiol., 60, 85-103 (1962).
46. Morin, JG., Hastings, JW. Energy transfer in a bioluminescent system. J. Cell.
Chapter 1
47. Morise, H., Shimomura, O., Johnson, FH., Winant, J. Intermolecular energy transfer in the bioluminescent system of Aequorea. Biochemistry., 13, 2656-62 (1974).
48. Zimmer, M. Green Fluorescent Protein (GFP), Applications, Structure, and Related Photophysical Behavior. Chem. Rev., 102, 759-781 (2002).
49. Atsushi, M. GFP and bioimaging-From the basic detection and expression of fluorescent protein to visualize the biological function (experimental course of post-genome era). Yodosha press., 16 (2000).
50. Tsien, R. Y. The green fluorescent protein. Annu. Rev. Biochem., 67, 509-544 (1998).
51. Prasher, D. C., Eckenrode, V. K., Ward, W. W., Prendergast, F. G., Cormier, M. J. Primary structure of the Aequorea victoria green fluorescent protein. Gene (Amst.).,
111, 229-233 (1992).
52. March, J. C., Rao, G., Bentley, W. E. Biotechnological applications of green fluorescent protein. Appl Microbiol Biotechnol., 62, 303-315 (2003).
53. Poppenborg, L., Friehs, K., Flaschel, E. The green fluorescent protein is a versatile reporter for bioprocess monitoring. J Biotechnol., 58, 79-88 (1997).
54. Chalfie, M. GFP: Lighting up life. Proceedings of the National Academy of
General introduction
Figures
Figure 1.1 The chart of genetic engineering
Chapter 1
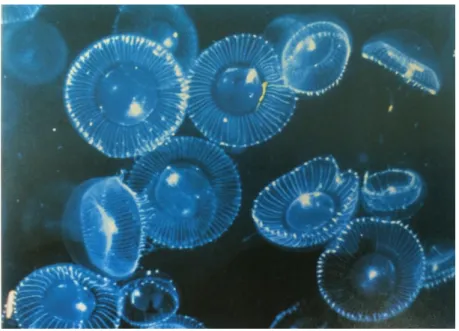
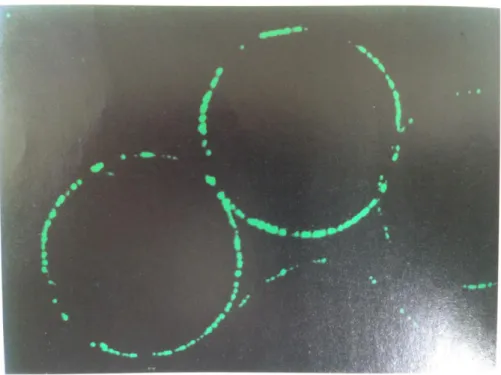
Figure 1.3 Top view of a specimen of Aequorea when stimulated in a darkroom (ref. 49)
Influence of last sense codon on expression efficiency of GFP gene in E. coli
Chapter 2 Influence of last sense codon on expression efficiency of
GFP gene in E. coli
2.1 Introduction
Protein synthesis is a complex, continuous process comprising the main stages of initiation, elongation, and termination. The initiation phase is believed mainly to control translation in bacterial cells [1]. A well-characterized element that influences the initiation step is the Shine-Dalgarno (SD) sequence, purine-rich nucleotides in the upstream of an open reading frame [2]. The SD sequence interacts with the complementary sequence in the 16S rRNA by base-pairing, which promotes the binding of mRNA to the 30S ribosomal subunit to form a pre-initiation complex. The importance of the base pairing between the SD sequence and 16S rRNA during the translational initiation step has been established by a series of biochemical experiments [2-3]. It is very important how to overexpress a gene in genetic engineering. It is known that the sequences around the initiation codon, such as SD sequence [2] or second codons, influence on the translation efficiency in E. coli. About the second codon, it was seen that the two most frequent second codons, AAA and AAU, enhanced the translation efficiency compared with the wild type, whereas the effects of lower frequency codons were not significant [4]. From the researches above, it is known that the sequences around the initiation codon influence gene expression in E.
coli. However, the influence of the sequences around the stop codon has not been
Chapter 2
been applied in analyzing the expression efficiency. In our previous work, it was found that the mutant GFP genes with the last sense codon ACC and AGC had the lowest RFIs (0.1 below). So the test experiments were done by sequence, it was found that there were mutant nucleotides on the GFP chains. After 64 kinds of GFP genes with the last sense codons were tested, 20 kinds of mutant GFP genes were found. Next, 20 kinds of last sense codons were inserted into the GFP genes separately by polymerase chain reaction (PCR), constructed the expression vector, and researched the relationship between the last sense codon and the expression efficiency. This text aimed to research the influence between gene sequence and expression efficiency of protein in E. coli from the perspective of genetic engineering, probe how to gain more and more useful proteins to serve people.
2.2 Experimental
2.2.1 Bacterial strains and plasmids
E. coli JM109 was used as the host strain, and the pKK223-3 was used as the
expression vector. Primers for PCR were purchased from Sigma-Aldrich Japan (Tokyo, Japan). The reagents and equipments were written in appendix.
2.2.2 Insertion of last sense codon to GFP gene
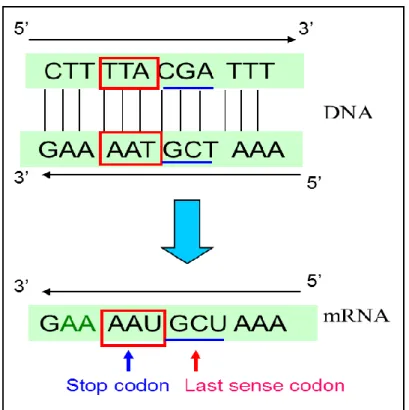
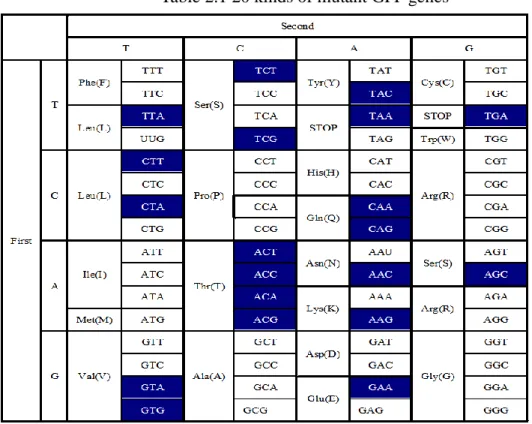
In our previous work, 20 kinds of mutant GFP genes were found (Tab. 2.1). So in this chapter, 20 kinds of primers were inserted into GFP genes by PCR and the modified GFP genes were acquired (Tab. 2.2). The part with the underline was the stop codon (UAA), italic letters were the 20 kinds of last sense codons, the shaded parts indicated digested sites of restriction enzyme corresponding to the primer description. For example, when italic letter was “TAA”, according to the rule of complementarity principle, from 3’ side of DNA gene, it was understood that the last sense codon “TTA” was inserted.
Influence of last sense codon on expression efficiency of GFP gene in E. coli
the restriction enzymes (EcoRI and HindIII). The plasmid pKK223-3 had been digested by the restriction enzymes (EcoRI and HindIII). The GFP gene and the pKK223-3 were ligated by T4 DNA ligase and the modified GFP gene which the last sense codon had been inserted was acquired. After E. coli was transformed by the expression vector containing the modified GFP gene, the colony was acquired. The expression vectors were isolated from E. coli, and the sequence of the modified GFP gene was determined.
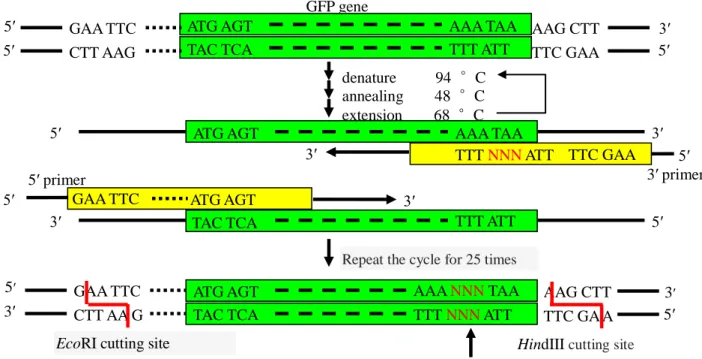
The principle of PCR was shown in Fig. 2.3. There are three major steps involved in the PCR technique: denaturation, annealing, and extension. In step one; the DNA is denatured at 94 °C. In step two, primers anneal to the DNA template strands to prime extension at 48 °C. In step three, extension occurs at the end of the annealed primers to create a complementary copy strand of DNA by Tag polymerase at 68 °C. This process results in the duplication and modification of the original DNA. The beauty of the PCR cycle and process is that it is very fast compared to other techniques and each cycle doubles the number of copies of the desired DNA strand. After 25 cycles, plenty of copies of DNA were acquired [9].
Later the PCR products were transferred into 1.5 mL microtube, 100 µL of PCI was added into the solution, centrifuged (4 °C, 12000 rpm, 7 min), the lower solution was discarded and the supernatant was transferred into the new microtube, 100 µL of CIA was added into the solution, centrifuged (4 °C, 12000 rpm, 1 min), the lower solution was discarded and the supernatant was transferred into the new microtube, centrifuged (4 °C, 12000 rpm, 1 min) again, the lower solution was discarded with the pipette, 10 µL of 3 M Sodium acetate (pH 5.2) and 250 µL of 99.5 % ethanol were added into the solution, cooled at - 85 °C for 60 min, centrifuged (4 °C, 15000 rpm, 20 min), the supernatant was discarded and 100 µL of 70 % of ethanol was added into the below precipitation, centrifuged (4 °C, 15000 rpm, 10 min), the supernatant was discarded and the precipitation was dried under reduced pressure for 10 min, 50 µL of TE buffer was added, and kept at 4 °C.
Chapter 2
41 µL of sterile water, 10 µL of 10 X H Buffer, 2 µL of EcoRI were added into the 1.5 mL microtube with the PCR product. The microtube was incubated at 37 °C for 60 min. The following procedure was the same with that of aftertreatment of PCR procedure.
After the solution was digested with EcoRI, the 25 µL of pKK223-3 / EcoRI solution was digested with HindIII by adding of 63 µL of sterile water, 10 µL of 10 X M Buffer and 2 µL of HindIII solution. The solution was incubated at 37 °C for 60 min. The following procedures were the same with that of aftertreatment of PCR procedure.
2.2.4 Dephosphorylation with calf intestine alkaline phosphatase (CIAP)
In order to make the phosphate group attached to the 5' end of the plasmid remains connecting when used the restriction enzyme, the probability of self-ligated with ligation reaction is strong. Calf intestine alkaline phosphatase (CIAP) was used to remove the phosphate group at the 5' end by a CIAP treatment to prevent self-ligation. The composition of the CIAP reaction contained 25 µL of the solution after digestion by EcoRI and HindIII, 19 µL of sterile water, 5 µL of 10 X Alkaline Phosphatase Buffer and 1 µL of CIAP. The mixture was incubated at 37 °C for 30 min. The following procedures were the same with that of aftertreatment of PCR procedure.
2.2.5 Purification of pKK223-3 digested with EcoRI and HindIII, and PCR products of GFP gene digested with EcoRI and HindIII
Wizard SV Gel and PCR Clean-Up System was used to purify pKK223-3 digested with EcoRI and HindIII, and PCR product of GFP gene digested with EcoRI and
HindIII, which allowed rapid and efficient purification of DNA.
2.2.6 Ligation and transformation
Influence of last sense codon on expression efficiency of GFP gene in E. coli
(50 fmol) and ligation Mix were added into the 0.5 mL microtube, and incubated at 16 °C for overnight.
200 µL of competent cell of E. coli JM109 was placed on the ice for 30 min before the transformation precedure. 10 µL of ligated DNA was added into the 0.5 ml microtube of competent cell, slowly stirred with the pipette, and the microtube was placed on the ice for 30 min again. Later, incubated at 42 °C for 1 min, the microtube was placed on the ice for 2 min. 800 µL of SOC was added into the microtube, shaked in the incubator (37 °C, 200 rpm, 60 min). After incubator, the microtube was centrifuged (4 °C, 6000 rpm, 3 min), 900 µL of supernatant was discarded, the residual liquid was suspended, the coloney was incubated at 37 °C for 18 h, and kept at 4 °C.
2.2.7 Sequence of GFP gene in the expression vector pKK223-3
In order to analyze the sequence of inserted last sense codon, the sequence experiment was carried out using Genetic Analyzer PRISM 310 (Thermo Fischer Scientific). The composition of the reaction solution for sequence contained the sterile water, 5 X sequence buffer, primers and plasmid DNA. The concentration of the plasmid DNA was adjusted to be between 100 and 200 ng. The HS premix of Big Dye Terminator v1.1 Cycle Sequencing Kit was added into the solution. After the sequencing reaction, 16 µL of sterile water and 64 µL of 95 % ethanol were added into the solution, standed for 15 min, the supernatant was thrown away after the centrifugation (20 min, 16000 rpm, 25 °C) and 250 µL of 70 % ethanol was added into the solution and centrifuged (10 min, 16000 rpm, 25 °C) once again, next the precipitation was dried at 90 °C for 1 min, later 25 μL of Hi-Di formamide was added into each sample tube and heated at 95 °C for 2 min, finally the sample tube was kept on the ice for 3 min, prepared for the sequence equipment to test the gene arrangement.
2.2.8 Measurement of fluorescence intensity of GFP in E. coli
Chapter 2
/ mL ampicillin (amp) and 40 µM isopropyl-β-D-thiogalactopyranoside (IPTG) at 37 °C for 18 h. The absorbance at 600 nm of the E. coli culture diluted with LB medium was measured, and the fluorescence intensity at 508 nm excited at 396 nm of the same culture by the fluorescence microplate reader (Nihon Molecular Devise) was analyzed. The expression efficiency of GFP gene was compared as the value of the fluorescence intensity / the absorbance at 600 nm. Fluorescence spectroscopy could be used to measure the concentration of a compound because the fluorescence intensity was increased in proportion to the absorbance at 600 nm, so the fluorescence intensity could be used to compare the expression efficiency of GFP genes with different last sense codons (Fig. 2.4). The calculated method of RFI was that the value of fluorescence intensity of wild type was divided by the value of fluorescence intensity of modified GFP gene.
2.2.9 SDS-PAGE (SDS-Polyacrylamide Gel Electrophoresis) of soluble proteins extracted from E. coli
After the fluorescence intensities of acquired modified GFP genes were known, we wanted to compare the expression quantities of proteins, and analyzed the influences of the modified GFP genes on expression efficiency, therefore sodium dodecyl sulfate-polyacrylamide gel electrophoresis (SDS-PAGE) experiment was done. First, 20 mL of LB medium, 20 µL of 100 mg / mL amp and 50 µL of inoculated E. coli on the colony from glycerol stock were added into each steriled 100 mL erlenmeyer flask. The erlenmeyer flasks were cultured in the culture-shaker (37 °C, 200 rpm). After three hours, 40 µL of IPTG (20 mM) was added into the erlenmeyer flasks. After the solutions were cultured for 15 hours, the solutions were transferred into 50 mL of falcon tube from erlenmeyer flasks, centrifuged (4 °C, 6000 rpm, 10 min). Next, the supernatant was discarded, the falcon tube was freezed at - 85 °C for 3 h. 700 µL of TE
RFI= Value of fluorescence intensity of modified GFP gene
Influence of last sense codon on expression efficiency of GFP gene in E. coli
was added into the falcon tube to suspend the precipitate. The weight of new 1.5 mL microtube was measured and the solution was transferred into the new microtube. After be centrifuged (4 °C, 5000 rpm, 10 min), the supernatant was discarded, at this time the weight of 1.5 mL microtube was measured again, the weight of the precipitate of E. coli was calculated, and the volumn of TE was calculated to 250 µL against 0.1 mg of E. coli. According to the proportion, TE, and Lisozyme were added into the 1.5 mL microtube. The microtube was placed at the room temperature for 60 min. 4 % Sodium Deoxycholate and DNase I were added into the microtube, the microtube was incubated at 37 °C for 60 min, centrifuged (4 °C, 13000 rpm, 10 min), and the soluble fraction was analyzed by SDS-PAGE.
2.3 Results and discussions
2.3.1 Influence of the last sense codons on expression efficiency
Fig. 2.5 was one part of the GFP gene sequence’s figure, three bases which formed complementary base pairs, the part with the underline was the last sense codon, the part with the square was the stop codon. According to the rule of complementarity principle of DNA (Fig. 2.6), nucleotide “A” combined with nucleotide “T”, nucleotide “C” combined with nucleotide “G”, from 5' side of DNA, it was understood that the the last sense codon TCG had been inserted into the DNA chain, no mutation had been occurred in the base sequence.
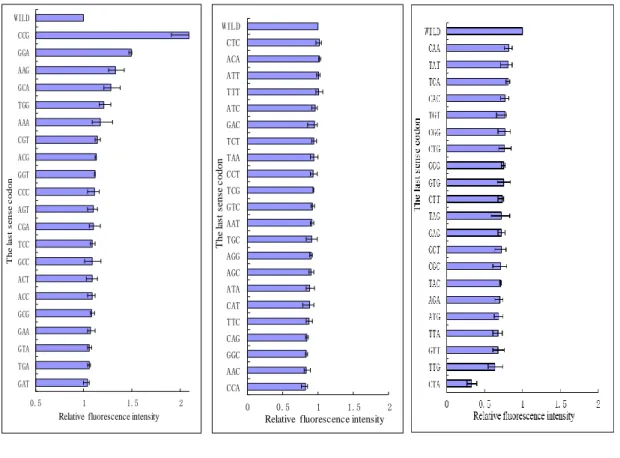
As shown in Fig. 2.7, the RFIs of 64 GFP genes were compared with the last sense codons. It was shown that the strongest RFI (2.1) was observed with the insertion of a CCG last sense codon, while the lowest RFI (0.33) was observed with that of a CTA last sense codon. The RFIs of GFP(CCG), GFP(GGA), GFP(TAA), GFP(TTT), GFP(TTG), GFP(CTA) were also observed 2.1, 1.49, 0.94, 1.01, 0.64, 0.33, respectively. The RFIs of most of GFP genes with the insertion of last sense codons were 0.7-1.5.
Chapter 2
were similar, indicating differences in the quantities of GFP produced, but not variation in the amino acid sequence. Similar tendency was seen for the other amino acids. However, for most of the amino acids, the differences were clear; for example, the RFIs were different among the six last sense codons for leucine (TTA, TTG, TCT, TCC, TCA, and TCG).
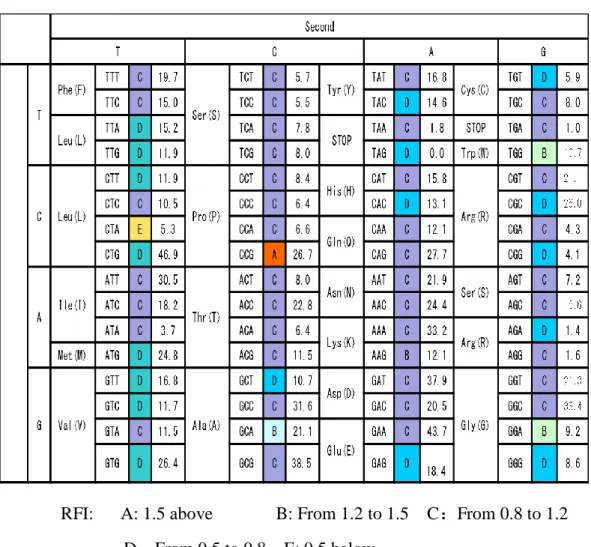
Codon usage frequency (CUF) has always been considered in the research and production of gene expression. When our research results were compared with the usage frequency of the codon commodities, it was found that some rules were the same, for example, as shown in Tab. 2.4, GFP(CCG) had the strongest RFI, and the CUF was bigger; GFP(CTA) had the lowest RFI, and the CUF was smaller. However, the CUF and RFI had not always the same tendency. For example, GFP(CTG) had the lower RFI, but the CUF was bigger, similarly, GFP(GGA) had the stronger RFI, but the CUF was smaller. It was seemed that there were not clear rules between RFI and CUF.
2.3.2 SDS-PAGE of soluble proteins extracted from E. coli
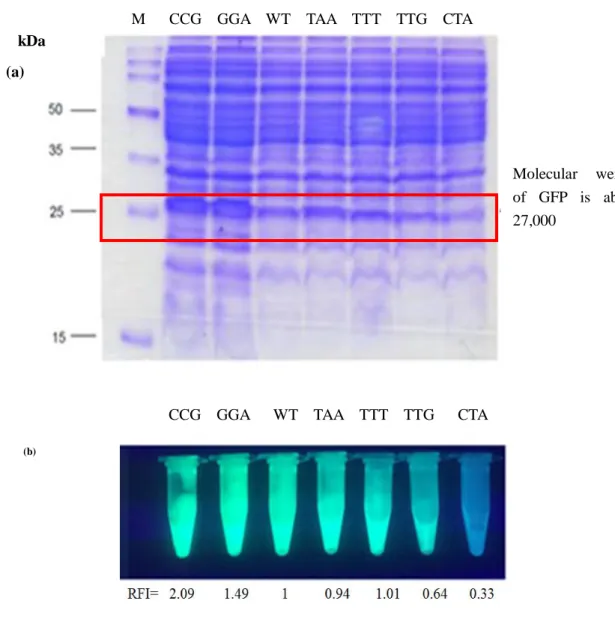
To confirm that the RFI was related to the expression efficiency of the GFP gene, SDS-PAGE of soluble proteins extracted from E. coli was done. In our experiments, GFP(CCG) (2.1), GFP(GGA) (1.49), GFP(TAA) (0.94), GFP(TTT) (1.01), GFP(TTG) (0.64), GFP(CTA) (0.33) were chosen and the expression quantities were compared according to the thickness of band around 27 kDa. As shown in Fig. 2.7, GFP(CCG), GFP(GGA) had the strongest RFIs, and the bands around 27 kDa showed the thickest; GFP(TTG), GFP(CTA) had the lowest RFIs, and the bands around 27 kDa showed the thinnest; GFP(TAA), GFP(TTT) had the similar RFIs with the wild type, the bands around 27 kDa showed the medium thicknesses. From the photograph of the extracts of
E. coli having the same last sense codon as (a) on transilluminator, it was shown that
GFP(CCG), GFP(GGA) had the strongest fluorescences, GFP(TTG), GFP(CTA) had the lowest fluorescences, the results of SDS-PAGE and transilluminator had the same tendency with the ones of RFIs (Fig. 2.8).
Influence of last sense codon on expression efficiency of GFP gene in E. coli
protein by SDS-PAGE. Since GFP(CCG) had the strongest quantity of synthesized protein, it could be used as the last sense codon in genetic engineering to produce useful proteins. Our findings would be useful for further studies of gene expression and may be applicable to genetic engineering.
2.4 Conclusions
Chapter 2
References
1. Kozak, M. Comparison of initiation of protein synthesis in procaryotes, eucaryotes, and organelles. Microbiol. Rev., 47, 1-45 (1983).
2. Shine, J., Dalgarno, L. The 3’-terminal sequence of Escherichia coli 16S ribosomal RNA: Complementarity to nonsense triplets and ribosome binding sites. Proc. Natl.
Acad. Sci. USA., 71, 1342-1346 (1974).
3. Steitz, J. A., Jakes, K. How ribosomes select initiator regions in mRNA: Base pair formation between the 3’-teminus of 16S rRNA and the mRNA during initiation of protein synthesis in Escherichia coli. Proc. Natl. Acad. Sci. USA., 72, 4734-4738 (1975).
4. Sato, T., Terabe, M., Watanabe, H., Gojobori, T., Hori-Takemoto, C., Miura, K. I. Codon and Bases after the Initiation Codon of the Open Reading Frames in the
Escherichia coli Genome and Their Influence on the Translation Efficiency. J. Biochem., 129, 851-860 (2001).
5. Hammon, J., Palanivelu, DV., Chen, J., Patel, C., Minor, DL. A green fluorescent protein screen for identification of well-expressed membrane proteins from a cohort of extremophilic organisms. Protein Sci., 18, 121-133 (2009).
6. Waldo, GS., Standish, BM., Berendzen, J., Terwilliger, TC. Rapid protein-folding assay using green fluorescent protein. Nat Biotechnol., 17, 691-695 (1999).
7. Chiu, W., Niwa, Y., Zeng, W., Hirano, T., Kobayashi, H., Sheen, J. Engineered GFP as a vital reporter in plants. Curr. Biol., 3, 325-330 (1996).
8. Yang, F., Moss, G., Maheswaran, G. The molecular structure of green fluorescent protein. Nat. Biotechnol., 14, 1246-1251 (1996).
Influence of last sense codon on expression efficiency of GFP gene in E. coli
Figures and tables
Stop codon
5’ AUG AAA UAA 3’
5’ AUG AAA NNN UAA 3’
64 kinds of last sense codons
Figure 2.1 The insertion of 64 kinds of last sense codons
Figure 2.2 Flow diagram of experiment
EcoRI , HindIII EcoRI , HindIII Expression vector HindIII site EcoRI site Ligation Restriction enzyme cleavage Restriction enzyme cleavage Transformation Culture Recycling of plasmid Fluorescence intensity measurement
Chapter 2
Figure 2.4 GFP fluorescence was proportional to GFP mRNA yield.
GFP gene 5′ 3′ denature 94 °C annealing 48 °C extension 68 °C 5′ 5′
ATG AGT AAA TAA
TAC TCA TTT ATT
5′ 3′ 3′ \ ‘ ‘ ′ 5′
ATG AGT AAA TAA
TAC TCA TTT ATT
GAA TTC
TTC GAA ATG AGT
TTT NNN ATT
5′ primer 3′ primer
Repeat the cycle for 25 times
(25回)
ATG AGT AAA NNN TAA TAC TCA TTT NNN ATT GAA TTC
CTT AA G
EcoRI cutting site
Last sense codon
TTC GA A AAG CTT
HindIII cutting site
Influence of last sense codon on expression efficiency of GFP gene in E. coli
Figure 2.5 One part of sequence analysis
Chapter 2
(a) (b) (c)
Figure 2.7 RFIs of GFP expressed by genes with insertions of last sense codons in E. coli
0.5 1 1.5 2 GAT TGA GTA GAA GCG ACC ACT GCC TCC CGA AGT CCC GGT ACG CGT AAA TGG GCA AAG GGA CCG WILD
Relative fluorescence intensity
T he l a s t s e ns e c od on 0 0.5 1 1.5 2 CCA AAC GGC CAG TTC CAT ATA AGC AGG TGC AAT GTC TCG CCT TAA TCT GAC ATC TTT ATT ACA CTC WILD
Relative fluorescence intensity
Influence of last sense codon on expression efficiency of GFP gene in E. coli
M CCG GGA WT TAA TTT TTG CTA
CCG GGA WT TAA TTT TTG CTA
Figure 2.8 (a) Results of SDS-PAGE of the extracts of E. coli transformed by the expression vectors with the different last sense codons in the GFP genes.
M: Size marker; WT: wild type. Arrow shows the molecular weight of GFP (27,000) (b) Photograph of the extracts of E. coli having the same last sense codon
Chapter 2
Table 2.1 20 kinds of mutant GFP genes
Table 2.2 The primers of 20 kinds of last sense codons
Primer Sequence Last sense codon
Influence of last sense codon on expression efficiency of GFP gene in E. coli
Table 2.3 Relationship between the last sense codon and the RFI (normalized with wild type GFP gene)
Amino
acid Codon RFI
Amino
acid Codon RFI
Amino
acid Codon RFI
Amino
acid Codon RFI
Phe TTT ±
Ser
TCT ±
Tyr TAT ± Cys TGT -
TTC ± TCC ± TAC - TGC ±
Leu TTA - TCA ± STOP TAA ± STOP TGA ±
TTG - TCG ± TAG - Trp TGG + Leu CTT - Pro CCT ± His CAT ± Arg CGT ± CTC ± CCC ± CAC - CGC - CTA -- CCA ± Gln CAA ± CGA ± CTG - CCG ++ CAG ± CGG - lle ATT ± Thr ACT ±
Asn AAT ± Ser AGT ±
ATC ± ACC ± AAC ± AGC ±
ATA ± ACA ±
Lys AAA ± Arg AGA -
Met ATG - ACG ± AAG + AGG ±
Val GTT - Ala GCT - Asp GAT ± Gly GGT ± GTC ± GCC ± GAC ± GGC ± GTA ± GCA +
Glu GAA ± GGA +
GTG - GCG ± GAG - GGG -
Chapter 2
Table 2.4 CUFs of last sense codon
Influence of the combination of last sense codon and stop codon on expression efficiency of GFP gene in E. coli
Chapter 3 Influence of the combination of last sense codon and stop
codon on expression efficiency of GFP gene in E. coli
3.1 Introduction
In the former chapter, the influence of the last sense codon on expression efficiency of GFP gene in E. coli when the stop codon UAA had been researched, if the stop codon was changed, the influence of last sense codon was whether the same or not, in order to confirm this point, the stop codon was changed from UAA to UAG and UGA. 18 kinds of last sense codons were inserted into GFP gene and the amount of produced GFP in E. coli was measured by fluorescence intensity.
From Tab. 3.1, according to the former research results, GFP(CCG) and GFP(GGA) showed the strongest RFIs (2.1, 1.49), GFP(CTA) and GFP(TTG) showed the lower RFIs (0.33, 0.64), GFP(ATA), GFP(CCC), GFP(CCA), GFP(ACA), GFP(AGT) and GFP(AGG) showed the medium RFIs (0.88, 1.11, 0.82, 1.02, 1.1 and 0.9, respectively), TAA, TAG and TGA were stop codons, according to the reasons above, 18 kinds of last sense codons were chosen from 64 kinds of last sense codons.
One expression system was developed in 1986 by W. F. Studier and B. A. Moffatt, who created a RNA polymerase expression system which was strongly selective for bacteriophage T7 RNA polymerase. The initial system involved two different methods of maintaining T7 RNA polymerase into the cell - in one method, a lambda bacteriophage was used to insert the gene which codes for T7 RNA polymerase, and in the other, the gene for T7 RNA polymerase was inserted into the host chromosome [1]. This expression system has become known as the pET expression System, which is based on the T7 phage RNA polymerase promoter and is now widely used because of its ability to mass-produce proteins, the specificity involved in the T7 promoter which only binds T7 RNA polymerase, and also the design of the system which allows for the easy manipulation of how much of the desired protein is expressed and when that expression occurs [2].
Chapter 3
the ribosomal translational machinery of the cell to create macromolecular products. Like PCR, which uses cellular replication machinery to create a DNA amplifier, cell-free protein synthesis is emerging as a transformative technology with broad applications in protein engineering, biopharmaceutical development, and post-genomic research [3].
In vitro synthesis of proteins in cell-free extracts is an important tool for molecular
biologists and has a variety of applications, including the rapid identification of gene products, protein folding studies, incorporation of modified or unnatural amino acids for functional studies, and investigation of protein-protein and antibody epitope mapping [4].
Different expression vectors have different elements for gene expression. For the expression vectors (pKK223-3 and pET21(+)), the two expression vectors were commonly used for gene expression. Each of them was reported to be strongly efficient, robust and costeffective. The expression vector pKK223-3 uses E. coli RNA polymerase. Translation system in vitro used T7 RNA polymerase. In vitro translation system was shown in Fig. 3.1. In order to analyze the influence between genetic codon and expression efficiency, the translation system was changed from E. coli to in vitro. In this case, the expression vector pKK223-3 could not be expressed, so the expression vector was changed from pKK223-3 to pET21(+), also competent cell was changed from E. coli JM109 strain to E. coli BL21 strain (Fig. 3.2).
It was seen that in Tab. 3.1, firstly 18 kinds of last sense codons were chose to research the influence of the combination of last sense codon and stop codon on expression efficiency of GFP gene in E. coli by the expression vector pKK223-3. Later the expression vector was changed from pKK223-3 to pET21(+) and 12 kinds of last sense codons were chosen to research the influence of the combination of last sense codon and stop codon on expression efficiency of GFP gene in E. coli by the expression vector pET21(+) (Tab. 3.2).
Influence of the combination of last sense codon and stop codon on expression efficiency of GFP gene in E. coli
When the expression vector was pKK223-3, 18 kinds of last sense codons were chosen (Tab. 3.1), and were inserted into GFP genes by PCR (Fig. 3.3). When the expression vector was pET21(+), 12 kinds of last sense codons were chosen (Tab. 3.2). All the primers were shown in Tab. 3.3. The part with the underline was the stop codon. The shaded parts indicated restriction enzyme digested sites corresponding to the primer description.
3.3 Results and discussions
3.3.1 Comparison of three kinds of stop codons without insertion of last sense codon by the expression vector pKK223-3
The stop codon had three kinds (UAA, UAG, and UGA), the wild types of three kinds of stop codons under the same conditions were determined the fluorescence intensities, it was found that the sequence of fluorescence intensity for three kinds of GFP genes of stop codons was wild(UGA) > wild(UAA) > wild(UAG). The result of comparison was seen in Fig. 3.4.
3.3.2 Comparison of the RFI by the stop codon was changed by the expression vector pKK223-3
As the results (Fig. 3.5), for most of the last sense codons, with one kind of last sense codon, when the stop codon was replaced, the change of fluorescence intensity was small. But some specific phenomena were seen, for example, for the last sense codon CCG, the RFI of GFP(CCG) was 2.1 when the stop codon was UAA, but in comparison, the RFI was 1.1 when the stop codon was changed from UAA to UAG. For last sense codon TAG, the RFI of GFP(TAG) with the stop codon UAG was stronger than that with the stop codons UAA and UGA.
Chapter 3
For the last sense codons which belonged to the same amino acid, the GFP genes with these last sense codons had the nearly same RFIs, for example, the last sense codons GTT and GTG belonged to Valine, the last sense codon ACC and ACA belonged to Threonine, the last sense codon AGT and AGC belonged to Serine. Their fluorescence intensities of GFP genes with these last sense codons were separately the same. There were also special cases, for example, the last sense codon CCC, CCA and CCG belonged to Proline, GFP(CCC) and GFP(CCA) had the near fluorescence intensities, but for the last sense codon CCG, when the stop codon was UAA, the RFI of GFP(CCG) was particularly strong (2.1).
The recognition of stop codons by release factors 1 (RF-1) and 2 (RF-2) leads to peptide chain termination during translation. Stop codons (UAG and UAA) are recognized by RF-1 while stop codons (UAA and UGA) are recognized by RF-2. The difference of the influence on expression efficiency among stop codons might be caused by the change of the release factors, this needed further verification.
3.3.3 Comparison of the RFI by the stop codon was changed by the expression vector pET21(+)
When the expression vector was pET21(+), 12 kinds of last sense codons (TGA, ACA, AGC, TAG, CCA, TAA, GTG, CCG, AAA, ACC, AGT, GTT) was inserted into GFP for the stop codon UAG, respectively. From the result of our experiment (Fig. 3.6), for the stop codon UAG, comparison to wild type GFP, GFP(TGA) had the strongest RFI (1.38), GFP(ACA) and GFP(ACC) had the medium RFIs (1.04, 0.94), GFP(CCG) had the lower RFI (0.85), other GFP genes with the last sense codons had the near fluorescence intensities by the expression vector pET21(+). As shown in Fig. 3.7, the fluorescence intensities of three kinds of stop codons were near, GFP(TGA) had the strongest RFI. Other GFP genes with the last sense codons had the near RFIs.
3.3.4 Comparison of expression vectors (pKK223-3 and pET21(+))
Influence of the combination of last sense codon and stop codon on expression efficiency of GFP gene in E. coli
expression efficiency, especially when the stop codon was UAG or UGA (Fig. 3.8, Fig. 3.9). When the stop codon was UAA, there were great differences on the expression efficiency. For example, for the last sense codon CCG, the RFI of GFP(CCG) was 0.89 by the expression vector pET21(+), the RFI of GFP(CCG) was 2.1 by the expression vector pKK223-3, the clear rule was not found (Fig. 3.10).
3.3.5 SDS-PAGE of soluble proteins extracted from E. coli
To confirm that the RFI was related to the expression efficiency of GFP gene, SDS-PAGE of soluble proteins extracted from E. coli was done. The result of SDS-PAGE was seen in Fig. 3.11 by the expression vector pKK223-3. Three kinds of last sense codons CCG, AGT, CTA were selected, and the RFIs by three kinds of stop codons were compared. As shown in Fig. 3.6, the results of RFIs were: CCG(UAA) 2.1, CCG(UAG) 1.1, CCG(UGA) 1.1, AGT(UAA) 1.1, AGT(UAG) 0.92, AGT(UGA) 0.91, CTA(UAA) 0.33, CTA(UAG) 0.73, and CTA(UGA) 0.71. Molecular weight of GFP was about 27,000, from the band of GFP, it was shown that the band of CCG(UAA) was thickest, the bands of CTA(UAA), CTA(UAG), CTA(UGA) were thinner, the thicknesses of other bands were nearly the same. The result of RFIs had the same tendency with that of SDS-PAGE.
Chapter 3
3.4 Conclusions
Influence of the combination of last sense codon and stop codon on expression efficiency of GFP gene in E. coli
References
1. Moffatt, BA., Studier, FW. Use of Bacteriophage T7 RNA Polymerase to Direct Selective Strong-Level Expression of Cloned Genes. Molecular Biology., 189(1), 113-130 (1986).
2. Unger, TF. Show Me The Money: Prokaryotic Expression Vectors And Purification Systems. Scientist- Philadelphia., 11, 20-22 (1997).
3. Whittaker, J. W. Cell-free protein synthesis: the state of the art. Biotechnol Lett.,
35(2), 143-152 (2013).
Chapter 3
Figures and tables
Figure 3.1 In vitro translation system
Figure 3.2 Change of expression vector (From pKK223-3 to pET21(+)) DNA mRNA Amino acids, energy, etc Ribosome Composition of protein
(in vitro transcription) T7 RNA polymerase Tac promoter pKK223-3
E. coli RNA polymerase
Influence of the combination of last sense codon and stop codon on expression efficiency of GFP gene in E. coli
Stop codon
5’ AUG AAA UAA 3’
Insertion of 18 kinds of last sense codons 5’ AUG AAA NNN UAA 3’
UGA or UAG
Figure 3.3 The insertion of last sense codons and change of stop codon in GFP gene
Chapter 3
Figure 3.5 RFIs of GFP expressed by genes with insertion of last sense codons by the expression vector pKK223-3
Figure 3.6 Comparison of the RFIs under the stop codon UAG
0 0.5 1 1.5 2 2.5 CTA TTG GTT TAG GTG CCA ATA AGG AGC TAA ACA TGA ACC AGT CCC AAA GGA CCG WILD
Relative fluorescence intensity
L as t se ns e co do n
Influence of the combination of last sense codon and stop codon on expression efficiency of GFP gene in E. coli
by the expression vector pET21(+)
Figure 3.7 Comparison of the RFIs under three kinds of stop codons by the expression vector pET21(+)
Chapter 3
Figure 3.9 Comparison of the RFIs of the expression vectors (pKK223-3 and pET21) by the stop codon, UGA
Influence of the combination of last sense codon and stop codon on expression efficiency of GFP gene in E. coli
46
M CCG AGT CTA M Stop codon: (UAA)(UAG) (UGA) (UAA)(UAG)(UGA) (UAA)(UAG) (UGA)
Figure 3.11 SDS-PAGE of soluble proteins extracted from E. coli transformed by having three kinds of last sense codons in GFP genes by the expression vector pKK223-3
M WT TGA ACA ACC CCG pET21(+) M
15 kDa
Figure 3.12 SDS-PAGE of soluble proteins extracted from E. coli transformed by having four kinds of last sense codons in GFP genes by the expression vector pET21(+)
Chapter 3
WT TGA ACA ACC CCG pET21(+)
Figure 3.13 Comparison of fluorescence of GFP under ultraviolet light
Table 3.1 18 kinds of last sense codons
Influence of the combination of last sense codon and stop codon on expression efficiency of GFP gene in E. coli
Table 3.2 Comparison of 12 kinds of last sense codons
Table 3.3 Primer sequences
NNN: stop codon (UAG, UGA)
Primer Sequence Last sense codon
Study on the relationship between mutation and expression efficiency of GFP gene in E. coli
Chapter 4 Study on the relationship between mutation and expression
efficiency of GFP gene in E. coli
4.1 Introduction
The research about GFP and its some mutants has always been concerned. People had found mutant was a good way, seven strategies were used to generate mutations in GFP [1]. A library had been constructed in E. coli of mutant GFP genes [2]. A new method had been developed to determine the mutagenic efficacy of a suspected mutagen by employing GFP as a direct biosensor for mutation detection [3]. A new strategy of molecular evolution aimed at generating a red-emitting mutant of GFP had been used and had succeeded in producing the first GFP mutant that substantially matures to the red-emitting state with excitation and emission maxima at 555 and 585 nm, respectively [4].
Extensive efforts had been applied to create GFP variants. As a result, blue and cyan mutants with Tyr66 substituted with Phe, His, or Trp were generated. Also, it was demonstrated that certain mutations can strongly influence a proportion of neutral / anionic chromophore [3]-[5]. Two plasmid vectors had been constructed for the expression of the synthetic SGFP-TYG gene in ascomycete species, indicating that SGFP-TYG can be used as a strongly effective vital marker in ascomycetes [6].The most widely studied of the folding mutants is F99S/M153T/V163A mutant with a modified codon usage for better expression in E. coli, which was found by forming random mutations with PCR [7].