Journal of the American Heart Association
ORIGINAL RESEARCH
Effects of Fatty Acid Therapy in Addition to Strong Statin on Coronary Plaques in Acute Coronary Syndrome: An Optical Coherence Tomography Study
Yoko Kita , MD; Makoto Watanabe , MD, PhD; Daisuke Kamon, MD; Tomoya Ueda, MD, PhD;
Tsunenari Soeda, MD, PhD; Satoshi Okayama, MD, PhD; Kenichi Ishigami, MD, PhD; Hiroyuki Kawata, MD, PhD;
Manabu Horii, MD, PhD; Fumitaka Inoue, MD, PhD; Naofumi Doi, MD, PhD; Hiroyuki Okura, MD, PhD;
Shiro Uemura, MD, PhD; Yoshihiko Saito, MD, PhD
BACKGROUND: Vascular healing response associated with adjunctive n-3 polyunsaturated fatty acid therapy therapy in patients receiving strong statin therapy remains unclear. The aim of this study was to evaluate the effect of polyunsaturated fatty acid therapy with eicosapentaenoic acid (EPA) or docosahexaenoic acid (DHA) in addition to strong statin therapy on coronary atherosclerotic plaques using optical coherence tomography.
METHODS AND RESULTS: This prospective multicenter randomized controlled trial included 130 patients with acute coronary syndrome treated with strong statins. They were assigned to either statin only (control group, n=42), statin+high-dose EPA (1800 mg/day) (EPA group, n=40), statin+EPA (930 mg/day)+DHA (750 mg/day) (EPA+DHA group, n=48). Optical coherence tomography was performed at baseline and at the 8-month follow-up. The target for optical coherence tomography analysis was a nonculprit lesion with a lipid plaque. Between baseline and the 8-month follow-up, fibrous cap thickness (FCT) signifi- cantly increased in all 3 groups. There were no significant differences in the percent change for minimum FCT between the EPA or EPA+DHA group and the control group. In patients with FCT <120 µm (median value), the percent change for minimum FCT was significantly higher in the EPA or EPA+DHA group compared with the control group.
CONCLUSIONS: EPA or EPA+DHA therapy in addition to strong statin therapy did not significantly increase FCT in nonculprit plaques compared with strong statin therapy alone, but significantly increased FCT in patients with thinner FCT.
REGISTRATION: URL: https://www.umin.ac.jp/ctr/; Unique identifier: UMIN 000012825.
Key Words: fatty acid ■ fibrous cap ■ optical coherence tomography
M
any large-scale clinical trials have shown that lipid-lowering statin therapy can be used as primary or secondary prevention for ischemic cardiovascular events.1 However, despite successful lowering of low-density lipoprotein cholesterol (LDL- C) levels with statins, patients with atheroscleroticcardiovascular disease remain at elevated risk for car- diovascular events.2
Epidemiological and clinical studies have shown that long-term intake of long-chain n-3 polyunsatu- rated fatty acids (PUFAs), especially eicosapentae- noic acid (EPA) and docosahexaenoic acid (DHA),
Correspondence to: Makoto Watanabe, MD, PhD, Department of Cardiovascular Medicine, Nara Medical University, 840 Shijo-cho, Kashihara, Nara, Japan 634-8522. E-mail: wmakoto07@kcn.jp
Supplementary Materials for this article are available at https://www.ahajo urnals.org/doi/suppl/ 10.1161/JAHA.119.015593 For Sources of Funding and Disclosures, see page 12.
© 2020 The Authors. Published on behalf of the American Heart Association, Inc., by Wiley. This is an open access article under the terms of the Creative Commons Attribution-NonCommercial License, which permits use, distribution and reproduction in any medium, provided the original work is properly cited and is not used for commercial purposes.
JAHA is available at: www.ahajournals.org/journal/jaha
Downloaded from http://ahajournals.org by on December 16, 2020
can reduce the incidence of cardiovascular events.3,4 A large-scale intervention clinical trial (JELIS [Japan EPA Lipid Intervention Study]) that included patients with hypercholesterolemia showed that long-term use of EPA (1800 mg/day) in addition to statin ther- apy significantly reduced the incidence of secondary coronary events.5
The presence of vulnerable plaques, which contain a thin fibrous cap, large lipid or necrotic core, and in- creased macrophage density, has been demonstrated to predispose patients to plaque rupture and subse- quent acute coronary syndrome (ACS).6,7 Intravascular imaging studies have demonstrated that aggressive
lipid-lowering therapy with strong statins leads to vul- nerable plaque stabilization.8,9 However, the vascular healing response associated with adjunctive PUFA therapy in patients receiving strong statin therapy re- mains unclear.
Intravascular optical coherence tomography (OCT) is a high-resolution imaging technique for plaque characterization. OCT allows for the measurement of fibrous cap thickness (FCT) and lipid volume, which are considered major factors in plaque vulnerability.10 The aim of the present study was to evaluate the effect of adding PUFA therapy (EPA or EPA+DHA) to strong statin therapy on coronary atherosclerotic plaques in patients with ACS using OCT.
METHODS
The data, analytic methods, and study materials will not be made available to any researchers for pur- poses of reproducing the results or replicating the procedure.
Study Design and Protocol
This study was a prospective, randomized, open-la- bel, multicenter study involving 5 hospitals. The ob- jective was to evaluate the effect of adding PUFAs to strong statin therapy on coronary atherosclerotic plaques using OCT. Patients were randomly as- signed to either rosuvastatin alone (control group, n=42), rosuvastatin+high-dose EPA (1800 mg/day) (EPA group, n=40), or rosuvastatin+EPA (930 mg/
day)+DHA (750 mg/day) (EPA+DHA group, n=48) after successful percutaneous coronary intervention (PCI) for ACS. PUFA therapy was initiated after randomiza- tion. The dose of rosuvastatin was increased to the maximum prescribed dose with a target LDL-C value of <100 mg/dL.11 Treatments lasted for 12 months after randomization. All patients underwent OCT-guided PCI for ACS caused by the culprit lesion. All patients also had OCT examination in the treated coronary ves- sel and untreated coronary vessels immediately after the index PCI. OCT examination at the 8-month fol- low-up was performed in the same vessels as during baseline OCT. All patients received aspirin (100 mg/
day) and clopidogrel (75 mg/day) for 12 months after PCI. Clinical follow-up visits to assess adverse events were scheduled every 6 months for up to 12 months.
Blood samples for fasting lipid profile and fatty acid fractions were obtained in the early morning at base- line and at the 8-month follow-up. The present study was approved by the institutional ethics committee of Nara Medical University. Written informed consent was given by all participants before enrollment. This study was registered with the University Hospital Medical Information Network (UMIN000012825).
CLINICAL PERSPECTIVE
What Is New?
• The present study is a prospective, multi- center, randomized controlled trial to examine the effect of eicosapentaenoic acid (EPA) or EPA+docosahexaenoic acid as an adjunct to strong statin therapy on coronary plaque using optical coherence tomography.
• EPA or EPA+docosahexaenoic acid therapy in addition to strong statin therapy did not sig- nificantly increase fibrous cap thickness in nonculprit plaques compared with strong sta- tin therapy alone, but significantly increased fibrous cap thickness in patients with thinner fibrous cap thickness.
What Are the Clinical Implications?
• In the present study, EPA or EPA+docosa- hexaenoic acid therapy in addition to strong statin therapy did not significantly affect coro- nary plaque regression in nonculprit plaques compared with strong statin therapy alone, but might provide a greater stabilizing effect on coronary plaques with thinner fibrous cap thick- ness or thin-cap fibroatheroma.
Nonstandard Abbreviations and Acronyms
ACS acute coronary syndrome DHA docosahexaenoic acid EPA eicosapentaenoic acid FCT fibrous cap thickness
LDL-C low-density lipoprotein cholesterol OCT optical coherence tomography PCI percutaneous coronary intervention PUFA polyunsaturated fatty acid
TCFA thin-cap fibroatheroma
Downloaded from http://ahajournals.org by on December 16, 2020
Patient Populations
Eligibility criteria were as follows: (1) successful PCI for ACS (ST-segment–elevation acute myocardial infarction) or non–ST-segment–elevation acute cor- onary syndrome, (2) nonculprit vessels suitable for OCT examination, (3) scheduled coronary catheteri- zation at 8 months after the index procedure, and (4) statin treatment before the onset of ACS or initiation of statin treatment immediately after PCI because of serum LDL-C levels >100 mg/dL. Patients with any of the following were excluded from the study: (1) hy- persensitivity to PUFAs, (2) current use of any PUFAs, (3) bleeding tendency, or (4) cardiogenic shock or congestive heart failure.
Randomization
Randomization was centralized at the independent center from investigators. After the investigator ob- tained the consent from the participant, the treatment assignment was informed to the investigator by the randomization center. All recruited patients were ran- domly allocated in a 1:1:1 ratio to the control group, EPA group, or EPA+DHA group. Randomization was performed by simple randomization using a random number table during a stable period of hospitalization when statin administration had been confirmed.
OCT Image Acquisition
OCT imaging was obtained using a frequency domain OCT system (C8 system, Dragonfly imaging catheter and ILUMIEN OPTIS; St. Jude Medical, St. Paul, MN).
Briefly, the OCT imaging catheter was advanced dis- tal to the target lesion over a conventional 0.014-inch angioplasty guidewire through a 6 or 7 Fr guiding catheter. After intracoronary administration of 1 mg of isosorbide dinitrate, pullbacks were performed during continuous injection of x-ray contrast media or lac- tated low-molecular-weight dextran at 2.5 to 3.5 mL/s through the guiding catheter using an injection pump to remove blood from the field of view and allow for clear visualization of the vessel wall. Images were ac- quired at 5 frames/mm and an automated pullback speed of 20 mm/s.12
OCT Image Analysis
For the OCT image acquisition of target lesions in non- culprit lesions, 1 pullback was performed from distal site as far as possible to the tip of guiding catheter in each of the treated coronary vessel and untreated coronary vessels immediately after the index PCI. OCT examination at the 8-month follow-up was performed within the same observation range as the baseline. OCT images at baseline and at the 8-month follow-up were centralized and analyzed in a blinded fashion using
a dedicated offline review system (St. Jude Medical) at the independent core laboratory (Department of Cardiovascular Medicine, Nara Medical University) after the end of clinical follow-up.
Plaque tissue characterization was performed using previously validated criteria.10,13 Lipid core was defined as a signal-poor region with diffuse borders.
Fibrous cap was identified as a signal-rich band overlying the lipid core. Plaque rupture was defined as an intimal interruption and cavity formation in the plaque. Macrophage infiltration was defined as bright spots with high OCT backscattering signal variances.
A microchannel was defined as a no-signal tubular structure without a connection to the vessel lumen recognized on ≥3 consecutive cross-sectional images.
Cholesterol crystals were defined as thin, linear regions of high signal intensity within the lipid plaque without backscattering.
For the selection of target lesions at baseline, de novo, a nonculprit lesion with lipid core detected by OCT examination was selected as the target lesion.
When there were 2 or more lesions with lipid core in a treated or untreated coronary vessel, the lesion that presented the thinnest FCT in lesions with lipid core was selected as the target lesion. The target lesion could be in a coronary artery that was treated or not treated with PCI. In a PCI-treated coronary artery, the target lesion had to be located >10 mm from the lesion treated with PCI.
Three candidate frames were selected to deter- mine the minimum FCT by visually screening for all contiguous frames.14 FCT was defined as the dis- tance from the arterial lumen to inner border of the underlying lipid core.15 FCT was measured 3 times at the thinnest part of the fibrous cap on each frame, and then the average value was calculated.10 Minimum FCT was defined as the smallest FCT in the candidate frames. Maximum lipid arc was deter- mined as the largest lipid arc in 3 candidate frames selected by visual screening within the target lesion.14 When lipid was present in ≥90° of any cross-sec- tional image within the plaque, it was considered a lipid-rich plaque. In lipid-rich plaques, the lipid arc was measured at 1-mm intervals throughout the en- tire length of the lesion, and measurements were averaged. Lipid length was calculated based on the number of frames with lipid-rich plaque. Lipid volume index was defined as average lipid arc multiplied by lipid length.16
To ensure reliable comparisons between baseline and 8-month follow-up, the target lesion or target frame at the 8-month follow-up was selected at the same location as the baseline based on the distance from landmarks such as branches and calcifications.
Serial OCT images at baseline and at the 8-month fol- low-up were reviewed side by side.
Downloaded from http://ahajournals.org by on December 16, 2020
Two observers who were blinded to each patient’s clinical characteristics and treatment allocation made OCT measurements independently. The intraob- server and interobserver reproducibility measured by Pearson coefficient were r=0.98 and r=0.88 for mini- mum FCT and r=0.96 and r=0.86 for maximal lipid arc, respectively.
Absolute change and percent change for OCT measurements (minimum FCT, maximal lipid arc, aver- age lipid arc, lipid length, and lipid volume index) during the observation period were calculated as follows:
In subgroup analysis, patients were divided into 2 groups according to the median minimum FCT (120 µm) (thinner FCT; patients with minimum FCT <120 µm, thicker FCT; patients with minimum FCT ≥120 µm). Thin- cap fibroatheroma (TCFA) was defined as a thickness of
≤65 μm in the thinnest fibrous cap in a lipid-rich plaque on a cross-sectional image.
Blood Sample Analysis
Serum levels of total cholesterol, high-density lipopro- tein cholesterol, triglycerides, glucose, hemoglobin A1c,
EPA, DHA, and arachidonic acid were measured in the early morning after an overnight fast. Serum levels of LDL-C were calculated using the following Friedewald formula: LDL-C (mg)=total cholesterol−high-density li- poprotein cholesterol−triglycerides/5.
End Points
The primary end point of the study was the change and the percent change for minimum FCT between baseline and 8-month follow-up. Secondary end points were the change and the percent change for maximum lipid arc, lipid length, and lipid volume index between baseline and 8-month follow-up as well as major cardiovascular events, which included all-cause death, cardiac death, nonfatal myocardial infarction, stroke, and coronary re- vascularization. During study protocol development, the change in minimum FCT, maximal lipid arc, average lipid arc, lipid length, and lipid volume index were prespecified as primary or secondary end point. During manuscript preparation, post hoc analyses about plaque rupture, macrophage infiltration, microchannel, and cholesterol crystals were added to further evaluate the effect of add- ing PUFA therapy to strong statin therapy.
Statistical Analysis
During study protocol development, no data about the ef- fects of PUFAs on FCT changes evaluated by OCT were Absolute change= (Value at 8−month follow−up)
− (Value at baseline).
Percent change=Absolute change∕Value at baseline×100.
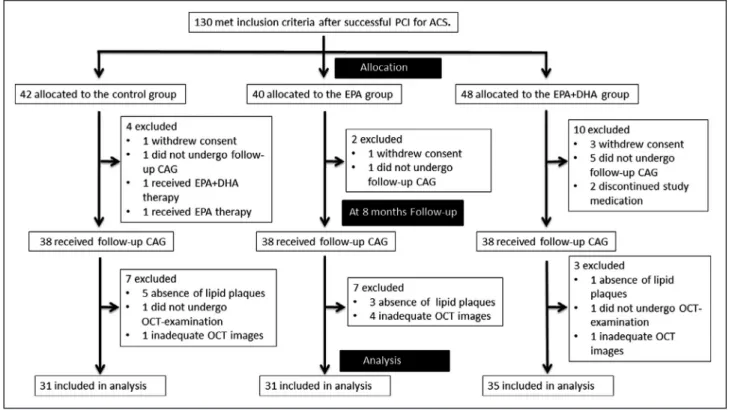
Figure 1. Study profile.
ACS indicates acute coronary syndrome; CAG, coronary angiography; DHA, docosahexaenoic acid; EPA, eicosapentaenoic acid;
OCT, optical coherence tomography; and PCI, percutaneous coronary intervention.
Downloaded from http://ahajournals.org by on December 16, 2020
available to guide sample size calculations. Therefore, it was impossible to calculate correctly the sample size for testing the assumption that PUFA therapy on top of the strong statin therapy significantly increase FCT com- pared with strong statin therapy alone. At development of the protocol of the present study, to determine the sample size, we referred to the previous study that evalu- ated the change in FCT by OCT.17 That study reported that FCT after statin therapy for 9 months increased by 130 µm because of LDL-C reduction of ≈36%. Therefore, referring these findings, we calculated the number of en- rolled patients with the assumption that the change in FCT after administration of statin was 100 µm, and the SD of the distribution was 200 µm. With a 2-sided α level of 0.05 and a power of 90%, 44 patients were required in each group. Considering a 25% rate for possible missing investigations or withdrawals, the sample size was set at 60 patients per group.
All analyses were performed using JMP statistics, version 11 (SAS Institute Inc., Cary, NC). All values are expressed as mean±SD or median with interquartile interval (25th–75th percentile) for continuous variables and counts and percentages for categorical variables.
Testing for significant differences in each parameter between baseline and 8-month follow-up was per- formed using the paired Student t test. Continuous variables were compared using the parametric statis- tical 1-way analysis of variance or the nonparametric Kruskal–Wallis test on the basis of the variable’s dis- tribution. When one-way analysis of variance or the Kruskal–Wallis test showed significant differences, continuous variables were compared between the con- trol group and other groups using post hoc Dunnett or Steel tests. Categorical data were compared using the Pearson chi-squared test. A P<0.05 was considered statistically significant.
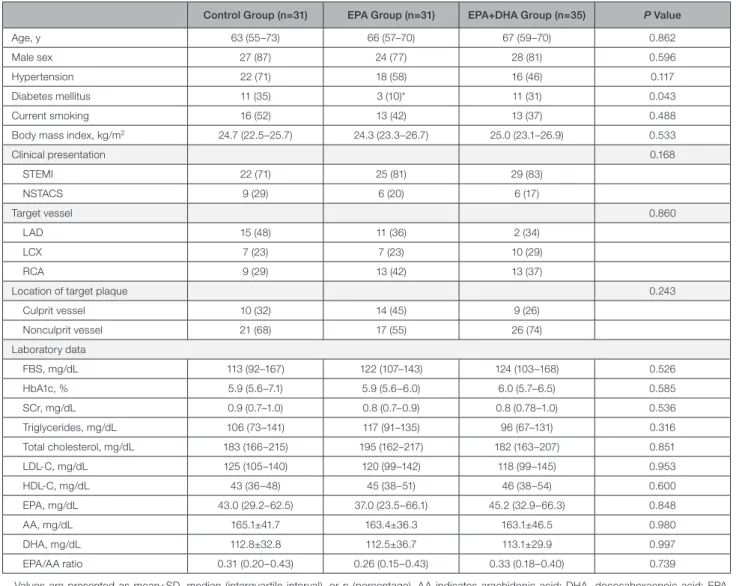
Table 1. Baseline Clinical Characteristics and Laboratory Data
Control Group (n=31) EPA Group (n=31) EPA+DHA Group (n=35) P Value
Age, y 63 (55–73) 66 (57–70) 67 (59–70) 0.862
Male sex 27 (87) 24 (77) 28 (81) 0.596
Hypertension 22 (71) 18 (58) 16 (46) 0.117
Diabetes mellitus 11 (35) 3 (10)* 11 (31) 0.043
Current smoking 16 (52) 13 (42) 13 (37) 0.488
Body mass index, kg/m2 24.7 (22.5–25.7) 24.3 (23.3–26.7) 25.0 (23.1–26.9) 0.533
Clinical presentation 0.168
STEMI 22 (71) 25 (81) 29 (83)
NSTACS 9 (29) 6 (20) 6 (17)
Target vessel 0.860
LAD 15 (48) 11 (36) 2 (34)
LCX 7 (23) 7 (23) 10 (29)
RCA 9 (29) 13 (42) 13 (37)
Location of target plaque 0.243
Culprit vessel 10 (32) 14 (45) 9 (26)
Nonculprit vessel 21 (68) 17 (55) 26 (74)
Laboratory data
FBS, mg/dL 113 (92–167) 122 (107–143) 124 (103–168) 0.526
HbA1c, % 5.9 (5.6–7.1) 5.9 (5.6–6.0) 6.0 (5.7–6.5) 0.585
SCr, mg/dL 0.9 (0.7–1.0) 0.8 (0.7–0.9) 0.8 (0.78–1.0) 0.536
Triglycerides, mg/dL 106 (73–141) 117 (91–135) 96 (67–131) 0.316
Total cholesterol, mg/dL 183 (166–215) 195 (162–217) 182 (163–207) 0.851
LDL-C, mg/dL 125 (105–140) 120 (99–142) 118 (99–145) 0.953
HDL-C, mg/dL 43 (36–48) 45 (38–51) 46 (38–54) 0.600
EPA, mg/dL 43.0 (29.2–62.5) 37.0 (23.5–66.1) 45.2 (32.9–66.3) 0.848
AA, mg/dL 165.1±41.7 163.4±36.3 163.1±46.5 0.980
DHA, mg/dL 112.8±32.8 112.5±36.7 113.1±29.9 0.997
EPA/AA ratio 0.31 (0.20–0.43) 0.26 (0.15–0.43) 0.33 (0.18–0.40) 0.739
Values are presented as mean±SD, median (interquartile interval), or n (percentage). AA indicates arachidonic acid; DHA, docosahexaenoic acid; EPA, eicosapentaenoic acid; FBS, fasting blood sugar; HbA1c, hemoglobin A1c; HDL-C, high-density lipoprotein cholesterol; LAD, left anterior descending artery;
LCx, left circumflex artery; LDL-C, low-density lipoprotein cholesterol; NSTACS, non–ST-elevation acute coronary syndrome; RCA, right coronary artery; RCA, right coronary artery; SCr, serum creatinine; and STEMI, ST-segment–elevation myocardial infarction.
*P<0.05 vs control group.
Downloaded from http://ahajournals.org by on December 16, 2020
RESULTS
Patient Populations
Figure 1 shows the study profile. Between May 2014 and March 2017, a total of 130 patients who were eligi- ble based on the inclusion criteria were enrolled in this study. During the 8-month follow-up period, 16 patients were excluded and 114 patients underwent follow- up coronary angiography. A total of 17 patients were excluded from OCT analysis because of (1) absence of lipid plaques at baseline (control group, 5 patients;
EPA group, 3 patients; EPA+DHA group, 1 patient), (2) no follow-up OCT examination (control group, 1 pa- tient; EPA+DHA group, 1 patient), and (3) inadequate OCT imaging (control group, 1 patient; EPA group, 4 patient; EPA+DHA group, 1 patient). Ultimately, 97 pa- tients were included in the analysis (control group, 31 patients; EPA group, 31 patients; EPA+DHA group, 35 patients).
Baseline Clinical Characteristics and Laboratory Data
Clinical characteristics, target lesions, and concomitant medications at baseline are shown in Tables 1 and 2.
Despite the randomized controlled trial study design, significant differences were observed in the preva- lence of diabetes mellitus between the control and EPA groups (P=0.015). There were no significant differences in laboratory data between the groups. Oral hypoglyce- mic agents were more frequently used in the EPA group compared with the control group (P=0.003).
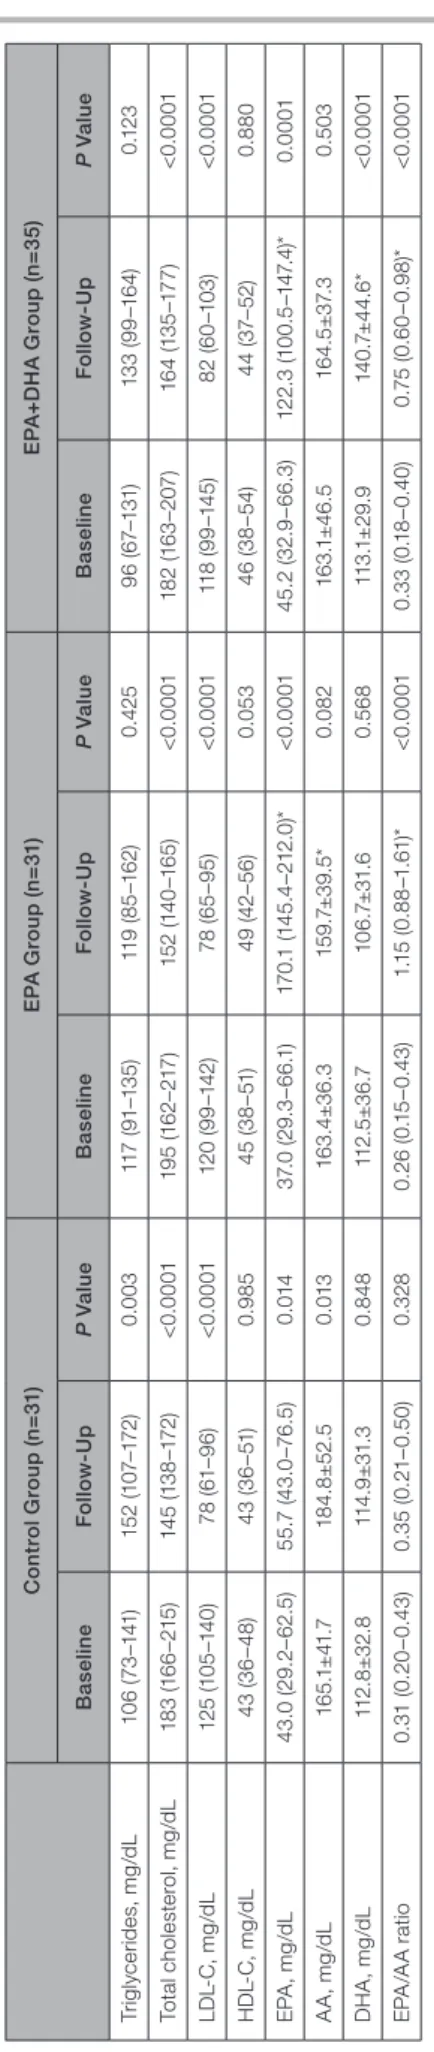
Table 3 shows changes in the lipid profile and fatty acid fractions. Serum total cholesterol and LDL-C levels significantly decreased between baseline and 8-month follow-up in all 3 groups. Serum EPA levels increased significantly between baseline and 8-month follow-up in all 3 groups. Serum DHA levels increased significantly in the EPA+DHA group only. Serum EPA levels and the EPA/arachidonic acid ratio at the 8-month follow-up were significantly higher in the EPA and EPA+DHA groups compared with the control group. Serum DHA levels at follow-up was significantly higher in the EPA+DHA group compared with the control group.
OCT Analysis
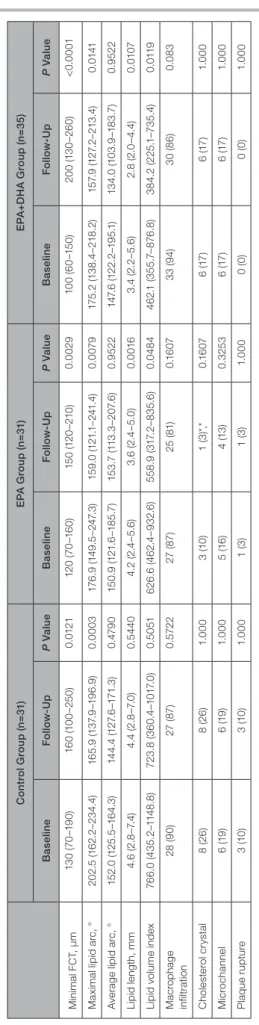
Figure 2 shows representative OCT images in each of the 3 groups. Table 4 shows change in OCT findings between baseline and 8-month follow-up. Minimum FCT increased significantly and maximal lipid arc de- creased significantly at the 8-month follow-up com- pared with baseline values in all 3 groups. Lipid length and lipid volume index decreased significantly at the 8-month follow-up compared with baseline values in the EPA and EPA+DHA groups. However, significant changes in those OCT measurements were not ob- served in the control group. Significant changes in the incidence of macrophage infiltration, cholesterol crys- tal, microchannel, and plaque rupture were not ob- served in each of the allocation groups. There was no significant difference in the incidence of macrophage infiltration, cholesterol crystal, microchannel, or plaque rupture at baseline among 3 groups, but significant
Table 2. Medications at Baseline and Follow-Up
Control Group (n=31) EPA Group (n=31) EPA+DHA Group (n=35) P Value Baseline
Strong statin 4 (13) 2 (6) 9 (26) 0.087
Standard statin 1 (3) 1 (3) 0 (0) 0.562
Aspirin 4 (13) 3 (10) 4 (11) 0.923
Calcium channel blocker 13 (42) 7 (23) 9 (26) 0.199
ACE inhibitor or ARB 10 (32) 8 (26) 8 (23) 0.683
Beta blocker 5 (16) 2 (6) 1 (3) 0.134
Insulin 0 (0) 0 (0) 1 (3) 0.409
Oral hypoglycemic agent 10 (32) 1 (3)* 7 (20) 0.013
Follow-up
Calcium channel blocker 6 (19) 8 (26) 4 (11) 0.322
ACE inhibitor or ARB 26 (84) 28 (90) 32 (91) 0.589
Beta blocker 23 (74) 25 (81) 23 (66) 0.389
Insulin 0 (0) 0 (0) 1 (2) 0.409
Oral hypoglycemic agent 10 (32) 2 (6)* 7 (20) 0.038
Values are n (percentage). ACE indicates angiotensin-converting enzyme; ARB, angiotensin II receptor blocker; DHA, docosahexaenoic acid; and EPA, eicosapentaenoic acid.
*P<0.05 vs control group.
Downloaded from http://ahajournals.org by on December 16, 2020
differences were observed in the incidence of cho- lesterol crystal at the 8-month follow-up between the control and EPA groups (P=0.0116). There was no sig- nificant difference in OCT measurements (minimum FCT, maximum lipid arc, average lipid arc, lipid length, and lipid volume index) at baseline between culprit vessel and nonculprit vessel in each of the allocation groups (Table S1).
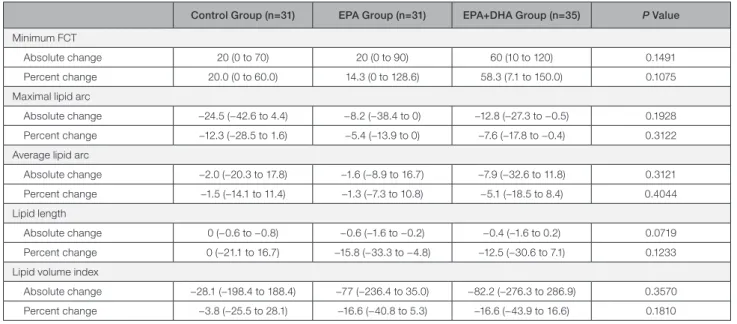
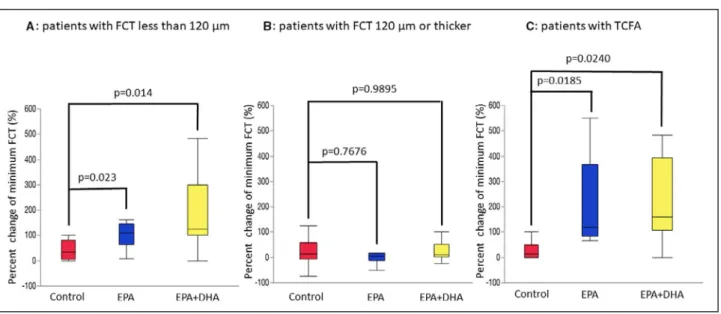
Table 5 shows the percent changes in OCT mea- surements. There were no significant differences in the percent change for minimum FCT, maximal lipid arc, average lipid arc, lipid length, and lipid volume index between the EPA or EPA+DHA group and the control group. Figure 3 shows correlations between minimum FCT at baseline and the percent change for minimum FCT. A significant negative correlation was found be- tween minimum FCT at baseline and the percent change for minimum FCT in the EPA and EPA+DHA groups, but not in the control group. Next, we evalu- ated the effect of treatment with EPA or EPA+DHA in subgroups by FCT severity. As shown in Figure 4, in the subgroup with minimum FCT <120 µm, the percent change for minimum FCT was significantly greater in the EPA group (P=0.0230) and the EPA+DHA group (P=0.0140) than in the control group (P=0.0102, Kruskal–Wallis test). However, in 51 patients with min- imum FCT ≥120 µm, there was no significant differ- ence in the percent change for minimum FCT between the control group and the other groups (P=0.1083, Kruskal–Wallis test). In 22 patients with TCFA, the percent change for minimum FCT was significantly higher in the EPA group (P=0.0185) and the EPA+DHA group (P=0.0240) than in the control group (P=0.0118, Kruskal–Wallis test).
Clinical Outcomes
During the follow-up period of 12 months, there were no significant differences in major cardiovascular events, all-cause death, cardiac death, nonfatal myo- cardial infarction, stroke, coronary revascularization, or target lesion revascularization between the control group and the other 2 groups (Table S2).
DISCUSSION
This prospective randomized study evaluated the vas- cular healing response in coronary atherosclerotic plaques in patients with ACS treated with a strong statin alone, EPA therapy in addition to strong statin therapy, or EPA and DHA therapy in addition to strong statin therapy using OCT. There were 3 principal find- ings of the present study. First, between baseline and the 8-month follow-up, minimum FCT significantly in- creased in all 3 groups. Second, a significant negative correlation was observed between baseline minimum
Table 3. Change in Lipid Profile and Fatty Acid Fractions Control Group (n=31)EPA Group (n=31)EPA+DHA Group (n=35) BaselineFollow-UpP ValueBaselineFollow-UpP ValueBaselineFollow-UpP Value Triglycerides, mg/dL106 (73–141)152 (107–172)0.003117 (91–135)119 (85–162)0.42596 (67–131)133 (99–164)0.123 Total cholesterol, mg/dL183 (166–215)145 (138–172)<0.0001195 (162–217)152 (140–165)<0.0001182 (163–207)164 (135–177)<0.0001 LDL-C, mg/dL125 (105–140)78 (61–96)<0.0001120 (99–142)78 (65–95)<0.0001118 (99–145)82 (60–103)<0.0001 HDL-C, mg/dL43 (36–48)43 (36–51)0.98545 (38–51)49 (42–56)0.05346 (38–54)44 (37–52)0.880 EPA, mg/dL43.0 (29.2–62.5)55.7 (43.0–76.5)0.01437.0 (29.3–66.1)170.1 (145.4–212.0)*<0.000145.2 (32.9–66.3)122.3 (100.5–147.4)*0.0001 AA, mg/dL165.1±41.7184.8±52.50.013163.4±36.3159.7±39.5*0.082163.1±46.5164.5±37.30.503 DHA, mg/dL112.8±32.8114.9±31.30.848112.5±36.7106.7±31.60.568113.1±29.9140.7±44.6*<0.0001 EPA/AA ratio0.31 (0.20–0.43)0.35 (0.21–0.50)0.3280.26 (0.15–0.43)1.15 (0.88–1.61)*<0.00010.33 (0.18–0.40)0.75 (0.60–0.98)*<0.0001 Values are presented as mean±SD or median (interquartile interval). AA indicates arachidonic acid; DHA, docosahexaenoic acid; EPA, eicosapentaenoic acid; HDL-C, high-density lipoprotein cholesterol; and LDL-C, low-density lipoprotein cholesterol. *P<0.05 vs control group.
Downloaded from http://ahajournals.org by on December 16, 2020
FCT and percent change for minimum FCT in the EPA and EPA+DHA groups, whereas no correlation was found with strong statin therapy alone. Third, there were no significant differences in the percent change for minimum FCT between the EPA or EPA+DHA group and the control group. However, in patients with thin- ner FCT, the percent change for minimum FCT was significantly higher in the EPA and EPA+DHA groups compared with strong statin therapy alone.
Current guidelines focus on LDL-C as the primary target of therapy, tailoring the level of optimal LDL-C reduction to the individual’s level of risk.18–20 However, cardiovascular risk in patients on statin therapy re- mains high; this risk has been called residual risk.
Results from a meta-analysis of statin trials involving 90 056 individuals found that the rate of major cardio- vascular events occurring during 5 years of follow-up among patients taking statins was 21.7% for those with prior cardiovascular disease and 9.5% for those without prior disease.21 Residual risk was lower after low LDL-C levels (70–100 mg/dL) were achieved, but remained high in the Treating to New Targets trial, with 8.7% of the group allocated to atorvastatin 80 mg experiencing a major event during a 5-year period.2 Therefore, treatments in addition to strong stains are necessary for reducing the residual risk for cardiovas- cular events.
Several epidemiological and clinical studies showed that long-term intake of PUFAs such as EPA and DHA
can reduce cardiovascular events.1,2 In the JELIS trial,3 18 645 patients with hypercholesterolemia were ran- domized to receive statin alone or statin plus highly purified EPA. At the end of 5 years, those random- ized to statin plus EPA had a 19% lower occurrence of major cardiovascular events. Recently, the Reduction of Cardiovascular Events with Icosapent Ethyl–
Intervention Trial,22 which enrolled 8179 patients with hyperglyceridemia randomized to receive EPA (total daily dose, 4 g) or placebo, demonstrated that EPA treatment reduced the risk of cardiovascular events by 25% compared with placebo with a median follow-up of 4.9 years and that EPA treatment even in patients receiving strong or moderate statin therapy at baseline was associated with a significant reduction in cardio- vascular events. As shown in both large-scale random- ized controlled trials, EPA in addition to statin treatment is considered an effective approach for reducing the residual risk for cardiovascular events. Regarding the effect of EPA+DHA therapy on cardiovascular events, the Gruppo Italiano per lo Studio della Sopravvivenza nell’Infarto miocardico-Prevenzione trial,23 a large, ran- domized controlled trial, demonstrated that EPA+DHA supplements are associated with a significant reduc- tion in cardiovascular events compared with placebo.
However, the effect of EPA+DHA therapy in addition to statin therapy on cardiovascular events has not been reported to date. Therefore, larger randomized controlled studies are needed to elucidate the effect
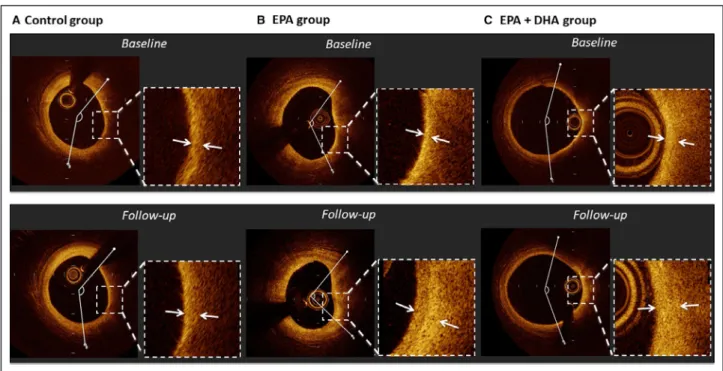
Figure 2. Representative cases of optical coherence tomography analysis.
A, In a case from the control group, fibrous cap thickness slightly increased (130–150 μm) and lipid arc changed very slightly (134.9–
145.0°) over 8 months. B, In a case from the EPA group, fibrous cap thickness increased (60–210 μm) and lipid arc decreased (118.3 to 95.1°) over 8 months. C, In a case from the EPA+DHA group, fibrous cap thickness increased (60–150 μm) and lipid arc decreased slightly (158.7 to 145.3°) over 8 months. DHA indicates docosahexaenoic acid; and EPA, eicosapentaenoic acid.
Downloaded from http://ahajournals.org by on December 16, 2020
of adjunctive EPA+DHA treatment in addition to strong statin treatment on cardiovascular events.
Vulnerable plaques, which contain a thin fibrous cap, large lipid or necrotic core, and increased num- ber of inflammatory cells such as macrophages, has been demonstrated to predispose patients to plaque rupture and subsequent ACS.6,7 Inflammation is now recognized to play an important role in atheroscle- rotic plaque progression.24,25 The anti-inflammatory actions of marine PUFAs may stabilize atherosclerotic plaques by decreasing inflammatory and immune cell infiltration and activity in the plaque.26 Matsumoto et al27 demonstrated that EPA treatment resulted in increased collagen content, more smooth muscle cells, and less macrophage infiltration. Wu et al28 showed that a diet rich in EPA or DHA reduces the levels of apoptosis induced by oxidized LDL and pre- vents atherosclerotic progression. Therefore, PUFAs including EPA and DHA stabilize vulnerable plaques through anti-inflammatory effects and antioxidant ef- fects in atherosclerotic lesions. In the present study, the association between anti-inflammatory effects of PUFAs and plaque stabilization was not clear be- cause macrophage accumulation was not evaluated with OCT. A recent optical frequency domain imaging study reported that minimum FCT is inversely cor- related with macrophage grade.29 Our study demon- strated a significant negative correlation between baseline minimum FCT and increased FCT in the EPA and EPA+DHA groups, whereas no correlation was found with strong statin therapy alone. These results suggest that PUFAs have a potential benefit on ath- erosclerotic plaque with substantial inflammatory cell infiltration.
Several intravascular imaging studies30–32 have demonstrated the effect of EPA treatment in addition to strong statin therapy on coronary atherosclerotic plaques. In a study using integrated backscatter in- travascular ultrasound, which can classify plaque components based on a color-coded map,33 Niki et al30 reported that lipid volume is significantly lower in patients treated with EPA in addition to strong statin therapy compared with patients treated with strong stain therapy alone. The change in lipid volume was significantly correlated with the change in pentraxin 3 or monocyte chemoattractant protein-1 levels in patients who received adjunctive EPA therapy. This study suggested that EPA plus strong statin therapy stabilizes plaque components better than strong sta- tin therapy alone through the suppression of coronary inflammation. Rupture of a vulnerable plaque, which consists of thin FCT, large lipid pools, and macro- phage infiltration around the fibrous cap, is consid- ered a major cause of ACS.6 OCT is a high-resolution intravascular imaging modality that can provide de- tailed vulnerable plaque visualization.10 In particular,
Table 4. Change in Optical Coherence Tomography Findings Control Group (n=31)EPA Group (n=31)EPA+DHA Group (n=35) BaselineFollow-UpP ValueBaselineFollow-UpP ValueBaselineFollow-UpP Value Minimal FCT, μm130 (70–190)160 (100–250)0.0121120 (70–160)150 (120–210)0.0029100 (60–150)200 (130–260)<0.0001 Maximal lipid arc, °202.5 (162.2–234.4)165.9 (137.9–196.9)0.0003176.9 (149.5–247.3)159.0 (121.1–241.4)0.0079175.2 (138.4–218.2)157.9 (127.2–213.4)0.0141 Average lipid arc, °152.0 (125.5–164.3)144.4 (127.6–171.3)0.4790150.9 (121.6–185.7)153.7 (113.3–207.6)0.9522147.6 (122.2–195.1)134.0 (103.9–183.7)0.9522 Lipid length, mm4.6 (2.8–7.4)4.4 (2.8–7.0)0.54404.2 (2.4–5.6)3.6 (2.4–5.0)0.00163.4 (2.2–5.6)2.8 (2.0–4.4)0.0107 Lipid volume index766.0 (435.2–1148.8)723.8 (360.4–1017.0)0.5051626.6 (462.4–932.6)558.9 (317.2–835.6)0.0484462.1 (355.7–876.8)384.2 (225.1–735.4)0.0119 Macrophage infiltration28 (90)27 (87)0.572227 (87)25 (81)0.160733 (94)30 (86)0.083 Cholesterol crystal8 (26)8 (26)1.0003 (10)1 (3)*,*0.16076 (17)6 (17)1.000 Microchannel6 (19)6 (19)1.0005 (16)4 (13)0.32536 (17)6 (17)1.000 Plaque rupture3 (10)3 (10)1.0001 (3)1 (3)1.0000 (0)0 (0)1.000 Values are presented as median (interquartile interval) or n (percentage). DHA indicates docosahexaenoic acid; EPA, eicosapentaenoic acid; and FCT, fibrous cap thickness. *P<0.05 vs control group at follow-up.
Downloaded from http://ahajournals.org by on December 16, 2020
OCT has the advantage of being able to accurately measure FCT and detect the accumulation of mac- rophages compared with intravascular ultrasound.
An OCT study targeting lesions with TCFA reported that the change in FCT is significantly higher and the incidence of macrophage accumulation at fol- low-up is significantly lower with combined EPA and strong statin treatment compared with strong statin treatment alone.32 In the present study, the percent change for minimum FCT was significantly higher in the EPA and EPA+DHA groups than in the control group among patients with thinner FCT (<120 µm) or TCFA. However, there was no significant difference in the percent change for minimum FCT in patients with thicker FCT (≥120 µm). These results suggest that ad- junctive EPA treatment might have a more favorable
benefit on atherosclerotic plaques with vulnerable features than those without vulnerable features.
The difference in anti-atherosclerotic effects be- tween EPA and DHA has not been clearly identified.
Erkkilä et al34 reported that higher plasma levels of DHA, but not EPA, are associated with less progres- sion of coronary atherosclerosis in postmenopausal women with coronary artery disease. In a virtual his- tology intravascular ultrasound study that evaluated the determinants of coronary plaque progression in patients with diabetes mellitus taking statins, Nozue et al35 reported that low-serum DHA, but not EPA, is an independent predictor of coronary plaque progres- sion. Takashima et al36 reported that EPA+DHA treat- ment more effectively reduces atherogenesis than EPA treatment alone in apolipoprotein E-deficient mice fed
Table 5. Absolute Change and Percent Change for optical coherence tomography Measurements
Control Group (n=31) EPA Group (n=31) EPA+DHA Group (n=35) P Value Minimum FCT
Absolute change 20 (0 to 70) 20 (0 to 90) 60 (10 to 120) 0.1491
Percent change 20.0 (0 to 60.0) 14.3 (0 to 128.6) 58.3 (7.1 to 150.0) 0.1075
Maximal lipid arc
Absolute change −24.5 (−42.6 to 4.4) −8.2 (−38.4 to 0) −12.8 (−27.3 to −0.5) 0.1928
Percent change −12.3 (−28.5 to 1.6) −5.4 (−13.9 to 0) −7.6 (−17.8 to −0.4) 0.3122
Average lipid arc
Absolute change −2.0 (−20.3 to 17.8) −1.6 (−8.9 to 16.7) −7.9 (−32.6 to 11.8) 0.3121
Percent change −1.5 (−14.1 to 11.4) −1.3 (−7.3 to 10.8) −5.1 (−18.5 to 8.4) 0.4044
Lipid length
Absolute change 0 (−0.6 to −0.8) −0.6 (−1.6 to −0.2) −0.4 (−1.6 to 0.2) 0.0719
Percent change 0 (−21.1 to 16.7) −15.8 (−33.3 to −4.8) −12.5 (−30.6 to 7.1) 0.1233
Lipid volume index
Absolute change −28.1 (−198.4 to 188.4) −77 (−236.4 to 35.0) −82.2 (−276.3 to 286.9) 0.3570
Percent change −3.8 (−25.5 to 28.1) −16.6 (−40.8 to 5.3) −16.6 (−43.9 to 16.6) 0.1810
Values are presented as median (interquartile interval). DHA indicates docosahexaeonic acid; EPA, eicosapentaenoic acid; and FCT, fibrous cap thickness.
Figure 3. Correlations between the percent change for minimum FCT and minimum FCT at baseline.
A, No correlation was found in the control group (r=−0.2718, P=0.1392). B, A significant negative correlation was found in the EPA group (r=−0.5368, P=0.0018). C, A significant negative correlation was found in the EPA+DHA group (r=−0.5193, P=0.0014). DHA indicates docosahexaenoic acid; EPA, eicosapentaenoic acid; and FCT, fibrous cap thickenss.
Downloaded from http://ahajournals.org by on December 16, 2020