Accuracy of ventricular volume and ejection fraction measured by gated myocardial SPECT:
Comparison of 4 software programs
著者 Nakajima Kenichi, Higuchi Takahiro, Taki Junichi, Kawano Masaya, Tonami Norihisa journal or
publication title
Journal of Nuclear Medicine
volume 42
number 10
page range 1571‑1578
year 2001‑10‑01
URL http://hdl.handle.net/2297/2797
Accuracy of Ventricular Volume and Ejection Fraction Measured by Gated Myocardial SPECT:
Comparison of 4 Software Programs
Kenichi Nakajima, Takahiro Higuchi, Junichi Taki, Masaya Kawano, and Norihisa Tonami
Department of Nuclear Medicine, Kanazawa University Hospital, Kanazawa, JapanGated myocardial perfusion SPECT has been used to calculate ejection fraction (EF) and end-diastolic volume (EDV) and has correlated well with conventional methods. However, the com- parative accuracy of and correlations across various types of gated SPECT software are not well understood. Methods:
Mathematic phantoms of cylindric– hemispheric hybrid models, ranging in volume from 34 to 266 mL, were generated. The clinical cases consisted of 30 patients who participated in a radionuclide angiography and gated blood-pool (GBP) study in addition to undergoing 99mTc-sestamibi gated SPECT. Four kinds of software, Quantitative Gated SPECT (QGS), the Emory Cardiac Toolbox (ECT), 4D-MSPECT, and Perfusion and Func- tional Analysis for Gated SPECT (pFAST) were used to compute EF and EDV, and the results were analyzed by multiple com- parisons tests. Patients were classified into 4 groups (i.e., no defect, small defect, large defect, and small heart) so that factors affecting variation could be analyzed.Results:In math- ematic models ⱖ 74 mL, volume error was within ⫾15%, whereas for a small volume (34 mL), QGS and 4D-MSPECT underestimated the volume and pFAST overestimated it. The respective intra- and interobserver reproducibility of the results was good for QGS (r⫽0.99 and 1.00), ECT (r⫽0.98 and 0.98), and 4D-MSPECT (r⫽0.98 and 0.98) and fair for pFAST (r⫽0.88 and 0.85). The correlation coefficient for EF between gated SPECT and the GBP study was 0.82, 0.78, 0.69, and 0.84 for QGS, ECT, 4D-MSPECT, and pFAST, respectively. The corre- lation coefficient for EDV between gated SPECT and the GBP study was 0.88, 0.89, 0.85, and 0.90, respectively. Although good correlation was observed among the 4 software pack- ages, QGS, ECT, and 4D-MSPECT overestimated EF in patients with small hearts, and pFAST overestimated the true volume in patients with large perfusion defects. Correlation coefficients among the 4 kinds of software were 0.80 – 0.95 for EF and 0.89 – 0.98 for EDV. Conclusion: All 4 software programs showed good correlation between EF or EDV and the GBP study. Good correlation was observed also between each pair of quantification methods. However, because each method has unique characteristics that depend on its specific algorithm and thus behaves differently in the various patient subgroups, the methods should not be used interchangeably.
Key Words: gated SPECT; ventricular volume; left ventricular ejection fraction; software; comparative study
J Nucl Med 2001; 42:1571–1578
E jection fraction (EF) and ventricular volume measure- ments have been used to evaluate various cardiac diseases.
These measurements have been considered important, par- ticularly in ischemic heart diseases, to determine functional status and predict prognosis. In nuclear cardiology, a classic but standard method has been the gated blood-pool (GBP) study, for which reproducibility and accuracy are well rec- ognized (1). Recent reports on gated SPECT studies have revealed that EF with gated SPECT is accurate and reliable (2–15). Conversely, some studies have shown limits on the use of gated SPECT for quantification (16). Although gated SPECT has become increasingly important to clinical stud- ies, whether it can replace the GBP study has not been confirmed.
Several kinds of gated SPECT software for quantification have been developed and applied to clinical practice. These include Quantitative Gated SPECT (QGS, Cedars-Sinai Medical Center, Los Angeles, CA) (1,2), the Emory Cardiac Toolbox (ECT; Emory University, Atlanta, GA) (6 – 8), 4D-MSPECT (University of Michigan Medical Center, Ann Arbor, MI) (9,10), and Perfusion and Functional Analysis for Gated SPECT (pFAST; Sapporo Medical University, Sapporo, Japan) (11). All these programs have correlated well with conventional methods for calculating EF (2–5,8 –
13). However, only a few studies have compared severalkinds of software using the same gated SPECT data. Thus, the purpose of this study was to validate the accuracy of EF and volume measurement in comparison with mathematic models and the standard GBP study and to evaluate corre- lations across the 4 software programs in computing gated SPECT parameters.
MATERIALS AND METHODS Mathematic Models
The mathematic model chosen was that used for the simulation study of ventricular volume calculation (12), because the true
Received Feb. 5, 2001; revision accepted Jun. 1, 2001.
For correspondence or reprints contact: Kenichi Nakajima, MD, Depart- ment of Nuclear Medicine, Kanazawa University Hospital, 13-1 Takara-machi, Kanazawa, 920-8641, Japan.
ventricular volume could be obtained easily. The shape of the heart was composed of a cylindric part in the base attached to a hemi- spheric part in the apex. Length and radius of the cylinder, radius of the hemisphere, wall thickness, count density (counts per voxel), and background count were arbitrarily changed. The myo- cardium was assumed to be located in the center of the cylindric torso. A set of 30 projection images of a 64⫻64 matrix over a 180° arc was generated with a 6° step. After blurring the image by a gaussian filter in which we assumed 15.7 mm in full width at half maximum, we then added Poisson noise corresponding to the count density of the projection images. Volumes of 263, 150, 74, and 34 mL were generated. Tomographic short-axis images were reconstructed with a ramp filter and with a Butterworth filter that had a cutoff frequency of 0.43 cycle per centimeter (order 8).
Because the quantification software could be operated only in gated studies, we artificially generated gated data by combining several types of volumes. We made 8-frame gated images with a symmetric volume curve in which the 2 halves were based on the same volume data. To simplify the models, we assumed that no attenuation or Compton scattering was present.
Patients
A total of 30 patients (20 males, 10 females; mean age⫾SD, 49⫾14 y) on whom both gated myocardial perfusion SPECT and a GBP study were performed within 2 wk of each other were analyzed retrospectively. The diagnoses for these patients con- sisted of old myocardial infarction (n⫽8), angina pectoris (n⫽ 9), subendocardial infarction (n⫽ 1), cardiomyopathy (n⫽ 3), diabetes mellitus (n⫽1), hyperlipidemia (n⫽1), systemic scle- rosis (n ⫽2), and congenital cardiac disease (n ⫽ 5) including pulmonary stenosis, atrial septal defect, and ventricular septal defect. Six patients were analyzed after coronary artery bypass grafting, and 1 patient, after left ventricular aneurysmectomy.
Three patients had associated congestive heart failure. Three pe- diatric patients were shown to be good candidates for gated per- fusion SPECT for evaluation of ventricular function and myocar- dial damage. No patients had valvular regurgitation.
The patients were classified into 4 groups. Group 1 comprised 9 patients for whom resting perfusion SPECT found no perfusion defect. The average EF measured by the GBP study was 57%⫾ 8%. Group 2 comprised 10 patients with a small defect. The defects were in the inferior (n⫽3), lateral (n⫽3), septal (n⫽2), inferolateral (n⫽1), and apical (n⫽1) walls. Group 3 comprised 6 patients with a large perfusion defect including the anterior wall, septum, and apex. Large defects were defined as more than one third of myocardial segments and were visually assessed by 2 nuclear medicine physicians, who reached a consensus. Mean ventricular volume and EF were 168⫾52 mL and 27%⫾10% on the basis of the GBP study. Group 4 comprised 5 patients with small hearts. Small hearts were defined as those with an end- diastolic volume (EDV)⬍60 mL as determined by the GBP study.
Average ventricular volume was 40⫾13 mL, and average ejection fraction was 55%⫾7%.
GBP Study
Radionuclide angiography and GBP scintigraphy were per- formed in the left anterior oblique projection with in vivo99mTc labeling of red blood cells using a pyrophosphate kit (Daiichi Radioisotope Laboratory, Tokyo, Japan). Radionuclide angiogra- phy was performed by bolus injection of 99mTc-pertechnetate flushed with 20 mL saline. The data were acquired using a 64⫻ 64 matrix at 1 s per frame for 60 s. An equilibrium image was
obtained 5 min later. The region of interest (ROI) was set over the left ventricle, and a time–activity curve was generated. After exponential fitting using the descending portion of the curve based on a Stewardt-Hamilton equation, cardiac output was measured by the standard program supplied by the manufacturer (Toshiba Corp., Tokyo, Japan).
A GBP study was performed in the left anterior oblique best septal projection, right anterior oblique projection, and left lateral projection. EF was calculated using a variable ROI method, with a background ROI set along the left ventricular border on the end- diastolic image.
Stroke volume was calculated as cardiac output divided by heart rate, and EDV was calculated as stroke volume divided by EF (1).
However, when EF is small, EDV may vary by a small change in EF. Thus, in the 3 patients whose EF was less than 30%, we used Simpson’s rule to calculate EDV in either the left anterior oblique projection or the left lateral projection, in which the longer axis was shown. The long axis and ventricular ROI were carefully drawn by viewing a cine-mode display, and a 55%– 60% threshold was used to delineate the ventricular contour.
Gated Myocardial Perfusion SPECT
A dose of 740 –1,000 MBq99mTc-methoxyisobutylisonitrile was injected while the patients were at rest. In children, a dose of 200 – 400 MBq was used. Sixty 64⫻64 matrix projection images were obtained with a 6° step over 360° using a 3-detector SPECT system (9300A/HG; Toshiba).
Electrocardiographic gating was performed with 12 frames per cardiac cycle. In children,⫻1.5 or⫻2 zooming was used for data acquisition. After transaxial images were reconstructed with a ramp filter and with a Butterworth filter having a cutoff frequency of 0.43 cycles per centimeter (order 8), short-axis images were generated. Gated projection images were added before SPECT reconstruction to produce a nongated image and were used for visually evaluating the perfusion defect.
Gated SPECT Analysis
Four gated SPECT quantification methods were used for com- puting left ventricular EDVs and EFs. The algorithm of each kind of software has been described elsewhere (2– 4,7–12). For com- puting the gated SPECT parameters, we used a UNIX system (GMS/UI; Toshiba) for QGS and ECT, e.soft (Toshiba/Siemens Medical Systems, Inc., Hoffman Estates, IL) on a Windows NT system (Microsoft, Redmond, WA) for 4D-MSPECT, and a Macintosh computer (Apple Computer, Inc., Cupertino, CA) with software that emulates Windows for a Macintosh user (Virtual PC 3.0; Connectix, San Mateo, CA) for pFAST.
We used version 2 of the QGS software (2– 4). After a full set of short-axis images was selected, fully automatic sampling of 3-dimensional data was performed, providing final results. Fitted to a 3-dimensional ellipsoid, gaussian function was applied to determine myocardial borders.
The model for the ECT software (7,8) applies a 3-dimensional hybrid sampling technique that uses cylindric coordinates to sam- ple from the basal wall to the distal wall and spheric coordinates to sample the apex. Because the program was designed to operate at only 8 frames per cardiac cycle, we extracted an initial 8 of 12 frames from the gated projection images. Although we excluded the last 4 frames, this processing did not alter the EDV and EF because the end-systolic frame was usually located at the fourth or fifth frame.
The 4D-MSPECT model (9,10) also uses a cylindric–spheric coordinate system, with cylindric coordinates to sample from the basal wall to the distal wall and spheric coordinates to sample the apex. Weighted spline and thresholding techniques were used to refine surface estimates. Fitted to a gaussian function, wall position and thickness were estimated.
We used version 2 of the pFAST software (11), which is designed to operate on Windows for personal computers and transfers data online from a SPECT system. After the myocardium was automatically extracted, an ROI was set using spline interpo- lation. When the myocardial perfusion defect was large and fitting was judged inappropriate, the shape was adjusted manually. The radial profile curves were generated from the center. The distance from the myocardial maximum point to the epicardial border was defined as 50% of the maximum count. The endocardial border was calculated as the distance from the center to the myocardial peak count plus k times wall thickness, where k is empirically determined to be 0.35.
Automatic processing was initially used for all software. When the wall tracing was visually judged inappropriate, the operator modified the ventricular border surrounding the ventricle and reprocessed the edge.
Intraobserver and interobserver reproducibility was examined in the first 20 patients. Intraobserver variability was tested 1 mo later by the same operator. Two nuclear medicine physicians indepen- dently processed each dataset, beginning with the projection im- ages and continuing through reconstruction and gated SPECT analysis.
Statistics
Values were expressed as mean⫾SD. The difference among the EF results was shown in absolute EF units (as a percentage), not by percentage of EFs. Linear regression analysis was per- formed by least squares fitting. The average values of 2 operators were used for calculating the regression line. The correlation coefficients of gated SPECT parameters among the 4 methods and GBP studies were calculated, as was the SE of the regression slope. The differences between the 2 selected groups were exam- ined by repeated-measures ANOVA with Fisher protected least significant difference (PLSD) and Scheffe´ tests (StatView, version 5.0J; SAS Institute, Inc., Cary, NC). These multiple comparisons were performed for all possible combinations. The differences in EF or EDV were plotted against the mean values according to the Bland–Altman method (17). P⬍0.05 was considered statistically significant.
RESULTS
Mathematic Model
The calculated volume from the ventricular simulation model is shown in Table 1. For QGS and ECT, automatic processing traced the ventricular edge well and was judged to be correct. For 4D-MSPECT, because the border of the basal region was placed slightly inside the basal end by automated setting, the cursor was manually moved slightly outward in the case of the model with the smallest volume (34 mL). For pFAST, because the values varied on the basis of the magnification rate during processing, we selected a processing zoom of
⫻1.8, which showed good fitting to the original myocardial border. The calculation errors were
within
⫾15% when the volume was
ⱖ74 mL. QGS deter- mined the correct volume in chambers
ⱖ150 mL. However, QGS underestimated the volume in small chambers. ECT slightly overestimated the theoretic volume by about 10%.
No underestimation was seen even in the 34-mL chamber.
4D-MSPECT showed
⬍10% error when the volume was
ⱖ74 mL but underestimated the 34-mL volume. On the other hand, pFAST overestimated the 34-mL volume.
Reproducibility of Results
Observers judged manual correction necessary to match their visual perception in 8%, 8%, 8%, and 40% of the cases for QGS, ECT, 4D-MSPECT, and pFAST, respectively.
The high rate of manual constraint by pFAST was caused by either a large perfusion defect or a small ventricular volume.
In patients with a large defect, the shape of the contour sometimes protruded from the true contour when measured by pFAST. Intraobserver (operator X
1, X
2) and interob- server (operators X and Y) reproducibility of EF (as a percentage) by QGS was calculated as X
1⫽1.00X
2⫹0.09 (r
⫽0.99; P
⬍0.0001) and Y
⫽0.99X
⫹0.83 (r
⫽1.00;
P ⬍
0.0001), respectively. Intra- and interobserver repro- ducibility by ECT was calculated as X
1 ⫽1.07X
2 ⫺1.3 (r
⫽0.98; P
⬍0.0001) and Y
⫽0.93X
⫹3.0 (r
⫽0.98;
P⬍
0.0001), respectively. By 4D-MSPECT, the respective calculations were X
1 ⫽0.90X
2 ⫹3.1 (r
⫽0.98; P
⬍0.0001) and Y
⫽0.90X
⫹3.1 (r
⫽0.98; P
⬍0.0001). By pFAST, the respective calculations were X
1 ⫽1.03X
2 ⫺0.72 (r
⫽0.88; P
⬍0.0001) and Y
⫽0.88X
⫹9.6 (r
⫽0.85; P
⬍0.0001).
Clinical Studies
Good correlations were found between the 4 gated SPECT methods and the standard GBP method for the EF and EDV calculations (Fig. 1). For EF, linear regression lines between gated SPECT (Y) and the GBP study (X) were calculated as Y
⫽1.06X
⫹2.3 (r
⫽0.82; P
⬍0.0001; SE
⫽0.14) for QGS, Y
⫽1.12X
⫹3.70 (r
⫽0.78; P
⬍0.0001; SE
⫽0.17) for ECT, Y
⫽0.99X
⫹6.6 (r
⫽0.69; P
⬍0.0001; SE
⫽0.20) for 4D-MSPECT, and Y
⫽1.14X
⫺4.80 (r
⫽0.84; P
⬍0.0001; SE
⫽1.14) for pFAST. All regression lines were near one another. For EDV, linear regression lines between gated SPECT and the GBP study were calculated as Y
⫽1.04X
⫺TABLE 1
Mathematic Phantom and Calculated Volumes by 4 Software Programs
True volume
(mL) QGS ECT
4D-
MSPECT pFAST 266 263 (99) 287 (108) 259 (97) 290 (109) 150 149 (99) 170 (113) 142 (95) 160 (107) 74 63 (85) 82 (111) 67 (91) 75 (101) 34 17 (50) 34 (100) 25 (74) 49 (144)
Data in parentheses are percentages.
8.5 (r
⫽0.88; P
⬍0.0001; SE
⫽0.11) for QGS, Y
⫽1.18X
⫺14.9 (r
⫽0.89; P
⬍0.0001; SE
⫽0.11) for ECT, Y
⫽1.00X
⫹0.39 (r
⫽0.85; P
⬍0.0001; SE
⫽0.12) for 4D-MSPECT, and Y
⫽1.61X
⫺35.9 (r
⫽0.90; P
⬍0.0001;
SE
⫽0.15) for pFAST. The slope of the regression line calculated from pFAST showed the highest value.
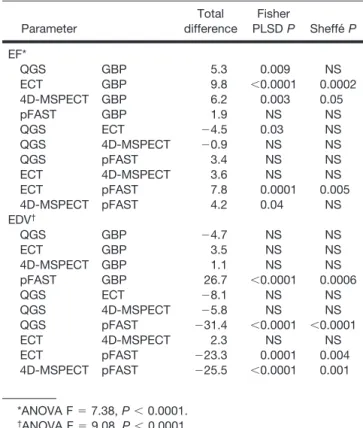
The values of EF and EDV in the 4 groups of patients are summarized in Table 2, and differences between each pair and statistical probability as determined by the Fisher PLSD and Scheffe´ tests are shown in Table 3. Both EF and EDV showed significant differences among the 4 methods by multiple com- parisons ANOVA (P
⬍0.0001). In the 30 patients as a whole, EF showed nearly identical values for all methods. ECT and 4D-MSPECT, however, showed slightly but significantly higher EFs— by 10% and 6%, respectively—than did the GBP study. For calculating EDV, the former 3 methods were nearly identical, but pFAST showed a higher volume by 27 mL (P
⫽0.0006). When pairs of software were compared for calculat- ing EF, EF with ECT was larger than EF with pFAST (a difference of 8%, P
⫽0.005). The pFAST volume was sig- nificantly larger than the volume shown by any other software program.
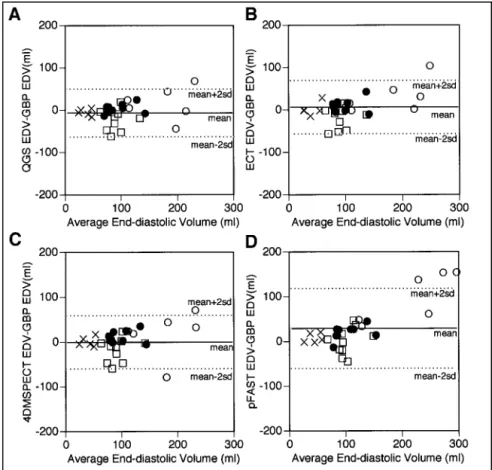
Differences between GBP and gated SPECT studies were plotted as the ordinate in a Bland–Altman plot, and the average
values were plotted as the abscissa. Figure 2 compares EFs calculated by the GBP study and EFs calculated by gated SPECT. For QGS, ECT, and 4D-MSPECT, EF calculated by gated SPECT was higher than that by the GBP study in small hearts, whereas with pFAST no significant difference was ob- served. Figure 3 compares EDVs calculated by the GBP study and EDVs calculated by gated SPECT. When the volume was
⬎150 mL, the variation in EDV became larger for all 4 software pro- grams. For pFAST, EDV calculated by gated SPECT was always larger than GBP volume in myocardium with large defects.
A correlation matrix for the 4 kinds of gated SPECT soft- ware and the GBP study is shown in Table 4. QGS, ECT, and pFAST correlated well with the GBP study (r
⫽0.82, 0.78, and 0.84, respectively), and 4D-MSPECT had a fair correlation coefficient (0.69). Generally high correlation coefficients (
⬎0.90) were observed among QGS, ECT, and 4D-MSPECT, whereas pFAST had a correlation coefficient of 0.80 – 0.89 compared with the other methods. For calculating EDV, GBP and gated SPECT had good correlation coefficients (0.85– 0.90).
DISCUSSION
All 4 quantification methods for gated SPECT correlated well with the conventional GBP study, which has been used
TABLE 2EF and EDV by 4 Software Programs
Parameter Total No defect Small defect Large defect Small heart
n 30 9 10 6 5
EF (%)
GBP 49⫾14 57⫾8 52⫾10 27⫾10 55⫾7
QGS 54⫾19 60⫾10 58⫾12 26⫾9 73⫾11
ECT 59⫾21 66⫾11 60⫾14 27⫾8 83⫾8
4D-MSPECT 55⫾21 60⫾15 55⫾14 28⫾8 81⫾12
pFAST 51⫾19 58⫾14 58⫾16 22⫾7 62⫾7
EDV (mL)
GBP 103⫾49 94⫾25 102⫾22 168⫾52 40⫾13
QGS 98⫾57 97⫾28 79⫾24 183⫾57 35⫾11
ECT 106⫾65 104⫾27 83⫾26 200⫾75 42⫾21
4D-MSPECT 104⫾58 105⫾26 84⫾28 186⫾63 41⫾15
pFAST 129⫾87 114⫾32 101⫾30 266⫾98 48⫾16
FIGURE 1. Correlation and regression lines between gated SPECT methods (QGS [䊐], ECT [E], 4D-MSPECT [‚], and pFAST [{]) and GBP study for calculating EF (A) and EDV (B).
as a standard for calculating EF. Although several quanti- fication methods are available, few studies have evaluated for a correlation across several types of software. Everaert et al. (12) compared QGS with the program of Stanford Med- ical School (Stanford, CA) in 40 patients. They observed an excellent correlation between the 2 methods for calculating EF (r
⫽0.93) and EDV (r
⫽0.97) but also found that the Stanford program calculated systematically larger volumes (of up to 48 mL) than did the QGS program. Nichols et al.
(13) compared QGS, ECT, and the program of St. Luke’s–
Roosevelt Hospital (New York, NY) in 33 patients. They found a good correlation between all methods and echocar- diographic findings but concluded that the gated SPECT methods for which underlying assumptions most closely resembled those used in echocardiography agreed best with echocardiographic measurements. Although the correlation among gated SPECT quantification methods seemed gener- ally good, some differences based on the algorithm did exist. Therefore, to better understand the results from vari- ous hospitals and different software types, we designed a comparative study of patients who underwent both the GBP study and gated SPECT. Subsequently, we found that each software program correlates well with the GBP study but has individual characteristics.
Based on the mathematic models, the calculated error of EDV was within 15% of the actual EDV when the volume was
ⱖ74 mL. However, a smaller, 37-mL, volume was significantly underestimated by QGS and 4D-MSPECT and
TABLE 3Comparison of EF and EDV Obtained by 4 Software Programs
Parameter
Total difference
Fisher
PLSDP Sheffe´P EF*
QGS GBP 5.3 0.009 NS
ECT GBP 9.8 ⬍0.0001 0.0002
4D-MSPECT GBP 6.2 0.003 0.05
pFAST GBP 1.9 NS NS
QGS ECT ⫺4.5 0.03 NS
QGS 4D-MSPECT ⫺0.9 NS NS
QGS pFAST 3.4 NS NS
ECT 4D-MSPECT 3.6 NS NS
ECT pFAST 7.8 0.0001 0.005
4D-MSPECT pFAST 4.2 0.04 NS
EDV†
QGS GBP ⫺4.7 NS NS
ECT GBP 3.5 NS NS
4D-MSPECT GBP 1.1 NS NS
pFAST GBP 26.7 ⬍0.0001 0.0006
QGS ECT ⫺8.1 NS NS
QGS 4D-MSPECT ⫺5.8 NS NS
QGS pFAST ⫺31.4 ⬍0.0001 ⬍0.0001
ECT 4D-MSPECT 2.3 NS NS
ECT pFAST ⫺23.3 0.0001 0.004
4D-MSPECT pFAST ⫺25.5 ⬍0.0001 0.001
*ANOVA F⫽7.38,P⬍0.0001.
†ANOVA F⫽9.08,P⬍0.0001.
NS⫽not statistically significant (P⬎0.05).
FIGURE 2. Comparison of gated SPECT methods and GBP study by Bland–Altman plot for calculating EF. Symbols denote pa- tients without defects (F), with small de- fects (䊐), with large defects (E), and with small hearts (⫻). Panels A, B, C, and D compare QGS, ECT, 4D-MSPECT, and pFAST, respectively. Lines indicate mean and mean⫾2 SD.
overestimated by pFAST. Underestimation of left ventricu- lar volume with QGS has been described previously (14,15), and our findings agree with those previous findings.
In a study using a simulation phantom, Achtert et al. (14) found that QGS slightly overestimated EF and underesti- mated EDV. 4D-MSPECT also underestimated EDV. On the other hand, because the results of pFAST varied by zooming factors during processing, we selected the best ventricular tracing by repeated trials. The pFAST algorithm overestimated the small volume, and this overestimation
may be attributed to the modified thresholding method used to detect the edge (11). In addition, the shape of the math- ematic model of our study was a cylindric– hemispheric hybrid and was similar to the ECT and 4D-MSPECT mod- els. This assumption may result in better fitting by the ECT and 4D-MSPECT models. Nichols et al. (13), in discussing clinical studies, also noted the similarity of the assumption in the model.
QGS showed the best reproducibility and was not signif- icantly influenced by variations in the setting of the cardiac long axis during SPECT. The cases requiring manual con- straint involved patients with large anteroseptal or apical perfusion defects. Edge detection methods worked well in patients with moderate or small perfusion defects. QGS, because correlating well with the GBP study and other gated SPECT software, is considered to be a convenient tool for quantification (2–5), although a canine MRI study showed the QGS method to have limitations (16). Underestimation of volume was observed in the current study and had also been reported previously (14,15). Our previous simulation study (15) indicated that underestimation was 75% for a 50-mL volume and 50% for a 37-mL volume. Zooming and depth-dependent filtering to overcome the underestimation in small hearts have been proposed (18). Because our pre- vious study (15) showed that hardware zooming during data acquisition was the simplest way to improve accuracy, we used zooming in small patients. Still, the underestimation
FIGURE 3. Comparison of gated SPECT methods and GBP study by Bland–Altman plot for calculating EDV. Symbols are same as in Figure 2. Panels A, B, C, and D com- pare QGS, ECT, 4D-MSPECT, and pFAST, respectively. Lines indicate mean and mean⫾2 SD.
TABLE 4
Correlation Matrix for 4 Software Programs
Parameter GBP QGS ECT
4D-
MSPECT pFAST EF
GBP 1 0.82 0.78 0.69 0.84
QGS 0.82 1 0.95 0.91 0.85
ECT 0.78 0.95 1 0.94 0.89
4D-MSPECT 0.69 0.91 0.94 1 0.80
pFAST 0.84 0.85 0.89 0.80 1
EDV
GBP 1 0.88 0.89 0.85 0.90
QGS 0.88 1 0.98 0.98 0.94
ECT 0.89 0.98 1 0.96 0.96
4D-MSPECT 0.85 0.98 0.96 1 0.89
pFAST 0.90 0.94 0.96 0.89 1
could not be avoided. Although underestimation of left ventricular EF in the presence of a large defect has been reported (19), our limited number of groups did not show a tendency toward such an underestimation.
ECT was also good in terms of reproducibility and cor- related well with the GBP study. The good correlation with theoretic values in the mathematic model may stem from the similarity in the assumption, as described above (6 – 8). In clinical studies on patients without a perfusion defect, EF was slightly higher as calculated by ECT than in the GBP study and was overestimated in small hearts, as occurred with QGS. Although a tracing of the ventricular contour was not displayed in the long-axis images, fitting was good in the short-axis images.
The EFs calculated by 4D-MSPECT correlated well with those calculated by the other 3 methods. Although slightly higher than found by the GBP study, EF did not differ significantly in each group for 4D-MSPECT compared with QGS. The fair correlation with the GBP study (r
⫽0.68) may be explained by the determination of the basal border.
In some patients, the basal border did not agree with visual assessment because it was determined by the single plane perpendicular to the long axis of the heart. In addition, because an apical border was detected slightly outside the apical wall in the small mathematic phantom, the problem of a small heart was again significant when this software was used.
pFAST correlated best with the GBP study. This algo- rithm used a modified thresholding method, which was essentially different from the other 3 methods. The volume can be modified by the setting of a k value (11), and because this k value was adjusted to give a good correlation with the GBP study, the good correlation may be a result of this method. The tendency to obtain a higher EDV by pFAST may also contribute to a relatively higher correlation. The algorithm failed to detect large defects and, in comparison with the GBP study and the 3 other methods, overestimated the volume. Because a minor modification was required for constrained tracing even when defects were moderate, this software required careful setting. The algorithm for com- pletely automatic processing without manual modification should be improved to increase reproducibility. Among the 4 methods, pFAST overestimated EF the least.
This study had some limitations. Because the GBP study has been used as a standard and reproducible method for evaluating ventricular contraction, we selected the GBP result as a “true” value. For calculating EDV, we used a combination of output measurements derived from radionu- clide angiography and EF from the GBP study. However, because EDV was calculated as cardiac output divided by heart rate (i.e., stroke volume) divided by EF, EDV may be affected by slight changes in EF when EF is small. Thus, in this study we used Simpson’s rule in a planar view that best showed the long axis of the heart. Although a count-based method may be used for computing volume, attenuation correction and blood sampling may be required (20,21), and
we did not perform these routinely. Moreover, true volume in patient studies could not be completely defined, because all conventional methods have specific assumptions and because calculated values may also reflect patient charac- teristics such as chamber size and extent of perfusion de- fects. Determination of reference values for gated SPECT technology is important in this respect (22). Another limi- tation is the small number of patients. Although further classification into the 4 groups left too few patients in each group for reliability, the purpose of classification into small groups was to evaluate the factors for variability in various settings. Because our patient population was heterogeneous with respect to ventricular size and extent of defect, we believed that the classification into groups would be better than the use of the Bland–Altman plot as a single group.
Finally, because all 4 software programs are still in revision, the purpose of this study was not to determine the best software package but to understand the characteristics and common features of the currently available software.
CONCLUSION
Four quantification methods for gated SPECT were com- pared with the GBP study for calculating EDV and EF. Each method correlated well with the GBP study, and close correlation was seen among the 4 methods. Because the characteristics of the algorithm influence the calculation of EDV and EF, one should keep these characteristics in mind when comparing results from the different kinds of soft- ware.
ACKNOWLEDGMENTS
The authors thank Masami Shimizu, MD (Second De- partment of Internal Medicine, Kanazawa University); Sa- toru Sakagami, MD (First Department of Internal Medicine, Kanazawa University); and Shinobu Sakazume, MD (De- partment of Pediatrics, Kanazawa University), for their help in preparing the clinical information and discussion. The authors also thank Ronald Belisle for the preparation of this manuscript.
REFERENCES
1. Ashburn WL, Shelbert HR, Verba JW. Left ventricular ejection fraction: a review of several radionuclide angiographic approaches using scintillation camera. Se- min Nucl Med. 1978;20:267–284.
2. Germano G, Kiat H, Kavanagh PB, et al. Automatic quantification of ejection fraction from gated myocardial perfusion SPECT. J Nucl Med. 1995;36:2138 – 2147.
3. Germano G, Erel J, Lewin H, Kavanagh PB, Berman DS. Automatic quantifica- tion of regional myocardial wall motion and thickening from gated technetium- 99m sestamibi myocardial perfusion single-photon emission computed tomogra- phy. J Am Coll Cardiol. 1997;30:1360 –1367.
4. Germano G, Kavanagh PB, Kavanagh JT, Wishner SH, Berman DS, Kavanagh GJ. Repeatability of automatic left ventricular cavity volume measurements from myocardial perfusion SPECT. J Nucl Cardiol. 1998;5:477– 483.
5. Yoshioka J, Hasegawa S, Yamaguchi H, et al. Left ventricular volume and ejection fraction calculated from quantitative electrocardiographic-gated99mTc- tetrofosmin myocardial SPECT. J Nucl Med. 1999;40:1693–1698.
6. Faber TL, Akers MS, Peshock RM, Corbett JR. Three-dimensional motion and perfusion quantification in gated single-photon emission computed tomograms.
J Nucl Med. 1991;32:2311–2317.
7. Cook CD, Vansant JP, Krawczynska EG, Faber TL, Garcia EV. Clinical valida- tion of three-dimensional color-modulated displays of myocardial perfusion.
J Nucl Cardiol. 1997;4:108 –116.
8. Faber TL, Cooke CD, Folks RD, et al. Left ventricular function and perfusion from gated perfusion images: an integrated method. J Nucl Med. 1999;40:650 – 659.
9. Kritzman JN, Ficaro EP, Corbett JR. Reproducibility of 3-D MSPECT for quantitative gated SPECT sestamibi perfusion analysis [abstract]. J Nucl Med.
2000;41(suppl):166P.
10. Ficaro EP, Kritzman JN, Corbett JR. Development and clinical validation of normal Tc-99m sestamibi database: comparison of 3D-MSPECT to Cequal [abstract]. J Nucl Med. 1999;40(suppl):125P.
11. Nakata T, Katagiri Y, Odawara Y, et al. Two- and three-dimensional assessments of myocardial perfusion and function by using technetium-99m sestamibi gated single-photon emission computed tomography with a combination of count- and image-based techniques. J Nucl Cardiol. 2000;7:623– 632.
12. Everaert H, Bossuyt A, Franken PR. Left ventricular ejection fraction and volumes from gated single-photon emission tomographic myocardial perfusion images: comparison between two algorithms working in three-dimensional space.
J Nucl Cardiol. 1997;4:472– 476.
13. Nichols K, Lefkowitz D, Faber T, et al. Echographic validation of gated SPECT ventricular function measurement. J Nucl Med. 2000;41:1308 –1314.
14. Achtert AD, King MA, Darlberg ST, et al. An investigation of the estimation of ejection fractions and cardiac volumes by a quantitative gated SPECT software package in simulated gated SPECT images. J Nucl Cardiol. 1998;5:144 –152.
15. Nakajima K, Taki J, Higuchi T, et al. Gated SPET quantification of small hearts:
mathematical simulation and clinical application. Eur J Nucl Med. 2000;27:
1372–1379.
16. Vallejo E, Dione DP, Bruni WL, et al. Reproducibility and accuracy of gated SPECT for determination of left ventricular volume and ejection fraction: exper- imental validation using MRI. J Nucl Med. 2000;41:874 – 882.
17. Bland JM, Altman DG. Statistical methods for assessing agreement between two methods of clinical measurement. Lancet. 1986;1:307–310.
18. Schwartz RG, Mixon L, Germano G, Chaudhary I, Armstron K, Mackin M.
Gated SPECT reconstruction with zoom dependent filter improves accuracy of volume and LVEF in small heart [abstract]. J Nucl Cardiol. 1999;6(suppl):S17.
19. Mannique A, Faraggi M, Ve´ra P, et al.201Tl and99mTc-MIBI gated SPECT in patients with large perfusion defects and left ventricular dysfunction: comparison with equilibrium radionuclide angiography. J Nucl Med. 1999;40:805– 809.
20. Starling MY, Dell’Italia LJ, Walsh RA, et al. Accurate estimates of absolute left ventricular volumes from equilibrium radionuclide angiographic count data using a simple geometric attenuation correction. J Am Coll Cardiol. 1984;3:789 –798.
21. Dehmmer GJ, Lewis SE, Hillis LD, et al. Nongeometric determination of left ventricular volumes from equilibrium blood pool scans. Am J Cardiol. 1980;45:
293–300.
22. Rozanski A, Nichols K, Yao SS, Malholtra S, Cohen R, DePuey EG. Develop- ment and application of normal limits for left ventricular ejection fraction and volume measurements from99mTc-sestamibi myocardial perfusion gated SPECT.
J Nucl Med. 2000;41:1445–1450.
![FIGURE 1. Correlation and regression lines between gated SPECT methods (QGS [ 䊐 ], ECT [ E ], 4D-MSPECT [ ‚ ], and pFAST [ { ]) and GBP study for calculating EF (A) and EDV (B).](https://thumb-ap.123doks.com/thumbv2/123deta/10143422.1977292/5.894.349.835.53.301/figure-correlation-regression-lines-spect-methods-mspect-calculating.webp)