Conductive microbead array detection by
high‑frequency eddy‑current testing technique with SV‑GMR sensor
著者 Yamada Sotoshi, Chomsuwan K., Hagino T., Tian H., Minamide K., Iwahara Masayoshi
journal or
publication title
IEEE Transactions on Magnetics
volume 41
number 10
page range 3622‑3624
year 2005‑01‑01
URL http://hdl.handle.net/2297/6901
doi: 10.1109/TMAG.2005.855172
3622 IEEE TRANSACTIONS ON MAGNETICS, VOL. 41, NO. 10, OCTOBER 2005
Conductive Microbead Array Detection by High-Frequency Eddy-Current Testing
Technique With SV-GMR Sensor
S. Yamada, Member, IEEE, K. Chomsuwan, Student Member, IEEE, T. Hagino, H. Tian, K. Minamide, and M. Iwahara, Member, IEEE
Institute of Nature and Environmental Technology, Kanazawa University, Ishikawa 920-8667, Japan
This paper describes the detection of conductive microbeads (PbSn) based on eddy-current testing (ECT) technique. High-frequency magnetic field applied to the conductive microbeads enables spin-valve giant magnetoresis-tance (SV-GMR) sensor to detect the mag- netic fields occurred from eddy currents flowing in the conductive microbeads. In this paper, analysis of these magnetic fields by an analytical method is discussed and compared with experimental results.
Index Terms—Conductive microbead, eddy-current testing, high-frequency, spin-valve giant magnetoresistance.
I. INTRODUCTION
A
PPLICATION of high-frequency eddy-current testing (ECT) probe with spin-valve type giant magnetoresis- tance (SV-GMR) sensor can be used to detect microdefects, such as the printed circuit board inspection [1]. Since SV-GMR sensor has many advantages, such as high-sensitivity to low magnetic field, high-spatial resolution, etc., it has been applied to various fields such as magnetic particle detection for bio- engineering [2] and can also be used in the detection of the conductive microbeads (PbSn) by ECT technique.Analysis of the magnetic field distribution created by the con- ductive microbeads by analytical method is proposed to study the parameters that effect the detection of the conductive mi- crobeads. Experimentally, the detection results of the conduc- tive microbeads with radius ranging from 125 to 300 m and of high-density conductive microbead array confirmed the fea- sibility of the proposed technique to recognize the conductive microbeads.
II. CONDUCTIVEMICROBEADDETECTION BY
EDDY-CURRENTTESTING
A. Structure of ECT Probe With SV-GMR Sensor
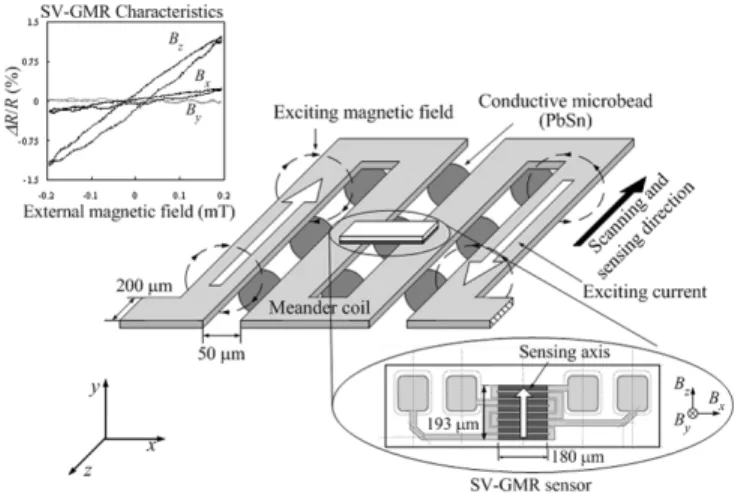
The structure of the proposed ECT probe is shown in Fig. 1.
The high-frequency exciting current is fed to the planar me- ander coil to generate a magnetic field only in and axis and to induce eddy currents flowing in the conductive microbeads.
The SV-GMR sensor with effective areas of 193 m 180 m has pattern, as shown in Fig. 1, and was mounted on the me- ander coil in the opposite side of the conductive microbeads.
The distance between the sensor and the conductive microbeads is around 162 m. The sensing axis of the SV-GMR sensor was set to detect magnetic field in scanning direction.
Digital Object Identifier 10.1109/TMAG.2005.855172
Fig. 1. ECT probe structure with conductive microbead (PbSn) array and SV-GMR characteristics.
Fig. 2. Analytical model.
B. Analysis of Microbead Magnetic Field by Analytical Method
A simple model, as shown in Fig. 2, was used to analyze the magnetic field created by the conductive microbead on the sensing level. Assuming that the conductive microbead is
0018-9464/$20.00 © 2005 IEEE
YAMADAet al.: CONDUCTIVE MICROBEAD ARRAY DETECTION BY HIGH-FREQUENCY EDDY-CURRENT TESTING TECHNIQUE 3623
Fig. 3. Eddy-current density distribution in the conductive microbead (PbSn) with 125m radius and 162m lift-off height.
Fig. 4. Magnetic fieldB over the sensing track obtained from analytical solution for a conductive microbead (PbSn) with 125m radius and a lift-off height of 162m.
placed under uniform magnetic field , the eddy-current den- sity flowing inside the microbead is expressed as
(1) where
;
;
conductivity of the bead (PbSn: S/m);
and permeability of air and the microbead;
and zero and first order Bessel function [3].
From (1), the eddy-current density flowing in the conduc- tive microbead is directly proportional with the frequency of the external magnetic field. Eddy-current density distributions in the conductive microbead with 125- m radius placed under the uniform magnetic fields at 100 T are shown in Fig. 3.
Eddy-current density concentrates near the surface of the con- ductive microbead because of the skin depth effect.
The magnetic field density at measurement point on the sensing level is, therefore, expressed as
(2)
Fig. 5. Maximum magnetic field variation vs. conductive microbead (PbSn) radius obtained from analytical solution where lift-off height is 162m.
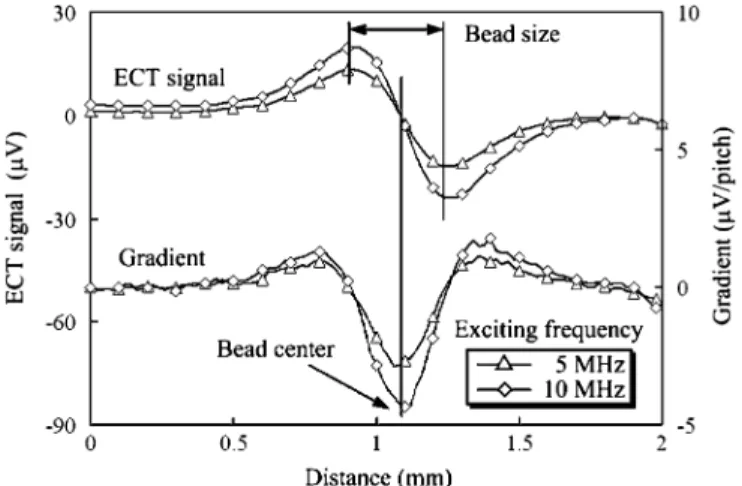
Fig. 6. ECT signal obtained from the detection of a conductive microbead (PbSn) with 125m radius and its signal gradient.
Fig. 7. Maximum signal variation vs. conductive microbead (PbSn) radius obtained from the experiment.
where
3624 IEEE TRANSACTIONS ON MAGNETICS, VOL. 41, NO. 10, OCTOBER 2005
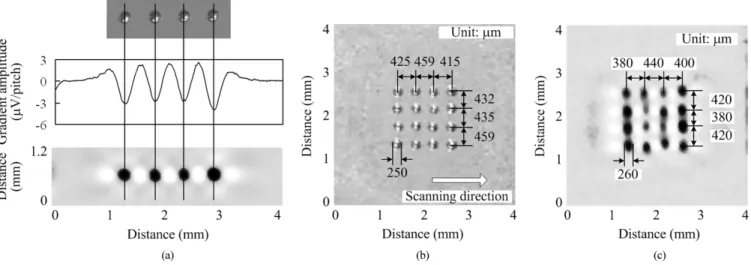
Fig. 8. Identification of the conductive microbead (PbSn) position, conductive microbead (PbSn) array model and its detection results. (a) Detection of bead position. (b) Conductive microbead array model. (c) Detection result.
When the exciting frequency approaches infinity, the mag- netic field on the sensing level can be determined by mag- netic dipole moment that is derived as in (3) where is the volume of the conductive microbead.
(3) Therefore, the magnetic field at measurement point when the exciting frequency approaches infinity is expressed as
(4) Figs. 4 and 5 show the frequency dependence of magnetic field variation obtained from eddy currents flowing in the con- ductive microbead placed under the uniform magnetic field of 100 T. The magnetic field varies at the position where the conductive microbead exists at the 0 mm displacement in Fig. 4.
Peaks of magnetic field occur at the outside diameter of the conductive microbead. Moreover, the maximum amplitude of magnetic field variation is also depended on the conductive mi- crobead radius, as shown in Fig. 5.
III. DETECTION OFCONDUCTIVEMICROBEAD
A. Characteristic of Conductive Microbead Detection
The ECT signal waveforms in Fig. 6 obtained from the de- tection of a conductive microbead with 125- m radius at the frequency of 5 and 10 MHz agree with the ECT signal wave- forms obtained from analytical solution. The determinations of the microbead diameter and its position are done by considering the peak of ECT signal and peak of signal gradient, respectively.
Fig. 7 shows the maximum variation of the ECT signal versus the radius of the conductive microbead, ranged from 125 to 300 m. The maximum signal variation at exciting frequency of 10 MHz decreases with the conductive microbead radius and it is lower than the signal variation at exciting frequency of 5 MHz when the conductive microbead radius is bigger than 200 m.
This is because the planer meander coil can not generate the uni- form magnetic field distribution. The experimental results also
showed that signal variations at the conductive microbead de- pend on the frequency of the exciting magnetic field and the conductive microbead radius.
B. Conductive Microbead Array Detection
The application of numerical gradient technique to ECT signal enables us to easily determine the conductive microbead position as shown in Fig. 8(a). In addition, the pitches of the conductive microbead are also measured by considering the peak of the signal gradient. The conductive microbead array model with 250- m diameter and 410–460- m microbeads pitches and its detection results are shown in Figs. 8(b) and (c), respectively. The conductive microbeads are clearly recognized and the pitches of the conductive microbead are also accurately specified with error within 50 m.
IV. CONCLUSION
The analytical and experimental results showed that the ECT technique can be used to detect high-density conductive mi- crobeads. The results also indicate that high-frequency ECT is useful and possible to use in physical measurement and bio- sensor applications.
ACKNOWLEDGMENT
This work was supported by the Japan Society for the Promo- tion of Science (Category B, 14 350 218) under a Grand-in-Aid for Scientific Research.
REFERENCES
[1] S. Yamada, K. Chomsuwan, Y. Fukuda, M. Iwahara, H. Wakiwaka, and S. Shoji, “Eddy-Current testing probe with spin-valve type GMR sensor for printed circuit board inspection,”IEEE Trans. Magn., vol. 40, no. 7, pp. 2676–2678, Jul. 2004.
[2] A. Anguelouch, D. H. Reich, C. L. Chien, and M. Tondra, “Detection of ferromagnetic nanowires using GMR sensors,”IEEE Trans. Magn., vol.
40, no. 7, pp. 2997–2999, Jul. 2004.
[3] T. Morisue and M. Fukumi, “3-D eddy current calculation using mag- netic vector potential,”IEEE Trans. Magn., vol. 24, no. 1, pp. 106–109, Jan. 1988.
Manuscript received February 1, 2005.