熊本大学学術リポジトリ
Relationship between an effective dose of imatinib, body surface area, and trough drug levels in patients with chronic myeloid
leukemia
journal or
publication title
International Journal of Hematology
volume 89
number 5
page range 642‑648
year 2009‑06‑02
URL http://hdl.handle.net/2298/12389
Relationship between an optimal dose of imatinib, body surface area, and trough drug levels in patients with chronic myeloid leukemia
Tatsuya Kawaguchi1,3, Akinobu Hamada2, 3, Chie Hirayama2, Reiko Nakashima2, Takeru Nambu2, Yuji Yamakawa2, Hiroshi Watanabe2, Kentaro Horikawa1, Hiroaki Mitsuya1, Hideyuki Saito2
Departments of 1Hematology and Infectious Diseases and 2Pharmacy, Kumamoto University Hospital, Japan
3These authors contributed equally to this study.
Running head: Optimal dose of imatinib in CML Type of manuscript: Original article
Main category: C. Hematological malignancies Subcategory: C. 3) Myeloproliferative disorders
Corresponding author:
Tatsuya Kawaguchi, MD, PhD
Departments of Hematology and Infectious Diseases,
Kumamoto University Graduate School of Medical Sciences, Honjo 1-1-1, Kumamoto 860-8556, Japan
Tel: 81-96-373-5156 Fax: 81-96-363-5265
E-mail: [email protected]
Abstract (194 words)
The standard dose of imatinib for treatment of chronic-phase chronic myeloid leukemia (CML) is 400 mg/day. Some patients receive reduced doses of imatinib because of serious adverse effects. Recently, the effective plasma threshold for trough imatinib levels was demonstrated to be 1,002 ng/ml. In this study, we evaluated the association of an imatinib dose with trough plasma concentrations and clinical outcomes in 31 patients with chronic-phase CML who were treated at Kumamoto University Hospital. Twenty-seven patients were optimally treated with various doses of imatinib. The mean (±SD) trough plasma concentrations of imatinib were 1.40 ± 0.57 µg/ml in 13 patients receiving 400 mg/day and 1.15 ± 0.44 µg/ml in 9 patients receiving 300 mg/day as an optimal dose. Mean trough levels of the two groups were not significantly different and exceeded the effective plasma threshold. Body surface area (BSA) was significantly smaller in patients receiving the reduced dose compared with those receiving the standard dose (p=0.001). The optimal imatinib dose was associated with age and gender as well as BSA. A reduced dose of 300 mg/day of imatinib may be sufficient for treatment of CML patients with smaller body size, particularly when intolerability arises.
Keywords: Chronic myeloid leukemia, imatinib, optimal dose, body surface area
1 Introduction
Imatinib mesylate, an inhibitor specific for the TK domain in the Abelson proto-oncogene, c-kit, and platelet-derived growth factor receptor, has been shown to be highly effective in the treatment of patients with chronic myeloid leukemia (CML) and gastrointestinal stromal tumors [1-4]. Based on the IRIS study [2, 3], the established standard dose of imatinib is 400 mg/day for patients with chronic-phase CML. This dose is well tolerated by most patients, and plasma trough levels are dose-proportional for the dose range of 25 to 1,000 mg/day [5]. The relationship between pharmacokinetics and pharmacodynamics of imatinib at steady state indicates that clinical response is highly dependent on the administered dose for patients with CML, and that a dose of 400 mg/day or higher is required for maximal clinical outcomes [1, 5, 6]. Recently, Picard et al demonstrated that trough imatinib plasma levels at steady-state must exceed 1,002 ng/ml to obtain the best sensitivity in CML patients, and that the plasma imatinib concentrations are associated with clinical response [7]. Similarly, Larson et al reported on the pharmacokinetics of imatinib and their correlation with clinical response during 5 years of follow-up in the IRIS study [8]. These authors indicated that maintaining plasma trough levels at or above 1,002 ng/ml may be important for achieving a complete cytogenetic response (CCR) and a major molecular response (MMR).
The recommended dose of 400 mg/day imatinib sometimes causes severe adverse effects such as mylelo-supression, edema, and skin rash, which in turn may lead to poor compliance, premature cessation of treatment, and failure of therapy. To avoid these unfavorable clinical situations, the daily dose of imatinib is often reduced from 400 to 200-300 mg/day in clinical practice [9-11], although maintaining a low dose of imatinib is not generally recommended. Recently, Ohnishi et al suggested that a reduced dose of 300 mg/day imatinib might be enough to achieve a CCR in some Japanese patients, and a weak inverse-correlation was observed between imatinib trough levels and body weight [12]. However, it is not known whether the plasma concentrations of imatinib reach the effective level (1,002 ng/ml) in such patients having a favorable response to a reduced dose of imatinib. Indeed, there are little data on the pharmacokinetics and pharmacodynamics of patients given a reduced dose of imatinib. To clarify the relationship of the optimal dose of imatinib with trough levels of imatinib at steady state, we measured plasma concentrations of imatinib in chronic-phase CML patients responding to a reduced dose of 300 mg/day as well as to a standard dose of 400 mg/day and analyzed differences in patient characteristics between these two patient groups.
2 Materials and Methods 2.1 Patients and treatment
Plasma concentrations of imatinib at steady state (on day 30 of treatment or later) were assessed in 31 patients with chronic-phase CML who were followed up at Kumamoto University Hospital during 2003 to 2007. All patients were initiated with the standard-dose of 400 mg/day imatinib. In case of severe adverse drug events (Grade 2 or more on the Common Toxicity Criteria of the National Cancer Institute), imatinib was reduced to 100 to 300 mg/day or temporally discontinued until adverse events were ceased, and resumed from a low dose and increased gradually up to a tolerable dose. When adverse events (≥ Grade 2) repeated, low dose imatinib (200 or 300 mg/day) was continued with carefull monitoring of imatinib response. In contrast, imatinib dose was escalated up to 800 mg/day if an optimal response (CCR) was not achieved after treatment with 400 mg/day imatinib for one year. Dose of imatinib that could achieve and maintain a CCR during the observation period was defined as “an optimal dose”
in this study. Approval from the ethics committee in Kumamoto University Hospital was obtained, and all patients provided informed consent to participate in this study, which was performed in accordance with the Declaration of Helsinki.
Cytogenetic responses to imatinib were assessed using a conventional cytogenetic analysis of bone marrow metaphases. CCR was defined as 0% of Philadelphia chromosome-positive cells in bone marrow aspirate. To assess molecular responses, total RNA was extracted from peripheral blood cells or bone marrow cells, and BCR-ABL transcript levels were quantified using
real-time quantitative PCR. Three or more log reduction in the transcript levels was determined to be a major molecular response (MMR).
2.2 Pharmacokinetic sample analysis
Blood samples were collected at steady state (day 30 of treatment or later) prior to the morning dose (trough plasma levels). Plasma levels of imatinib were determined using high performance liquid chromatography as described previously [13]. Briefly, EDTA-containing blood samples (5 ml) were collected from patients at steady state and were immediately centrifuged (1500 g, 5 min at 4ºC) to obtain the plasma fraction. The separated plasma was stored at -80°C until measurement of plasma imatinib concentrations.
2.3 Statistical analysis
Data on trough plasma levels of imatinib are presented as mean values with 95% confidence intervals (CI). The t test was used to determine differences in imatinib trough levels between different dose groups. Fisherʼs exact test was used to evaluate the association of an optimal dose at steady state with gender, age at starting treatment (below or above the median value of 53 years), body surface area (BSA; below or above the median value of 1.68 m2), and prior interferon (IFN) treatment. JMP ver. 7 (SAS Institute Inc., Cary, NC) was used for all statistical analyses. A p value <0.05 was considered statistically significant.
3 Results
3.1 Patient characteristics
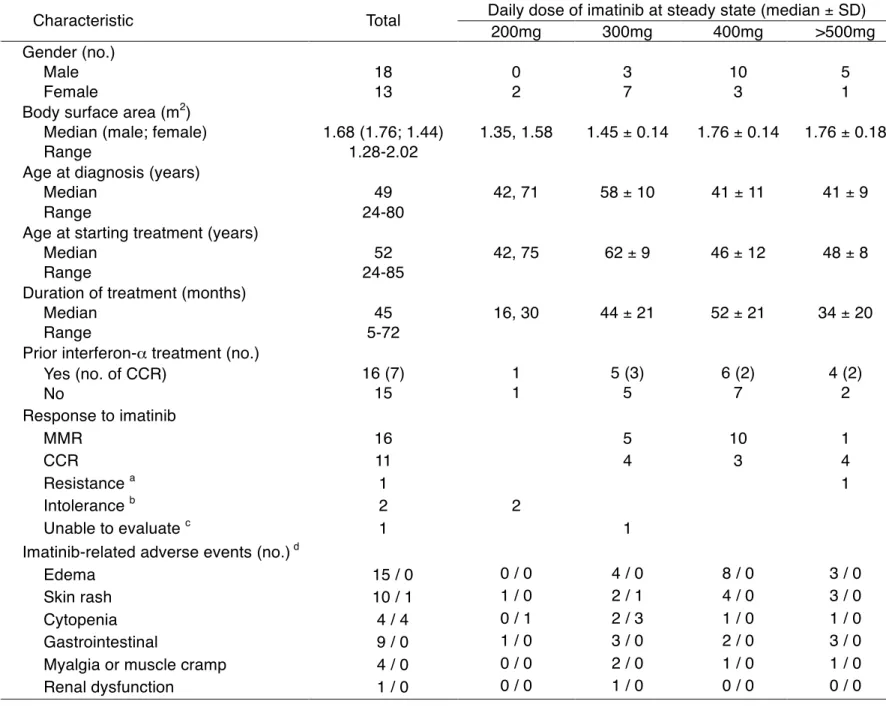
The characteristics of the 31 patients are shown in Table 1. The median age was 49 years (range, 24-80), with 18 males and 13 females. All patients showed adequate hepatic and renal functions: mean values (95% CIs) of ALT, AST, total bilirubin, BUN, serum creatinine, and serum albumin were 23 (20-26) IU/L, 24 (18-30) IU/L, 0.5 (0.5-0.6) mg/dL, 14.0 (12.6-15.4) mg/dL, 0.82 (0.74-0.91) mg/dL and 4.4 (4.3-4.5) g/dL, respectively. Each of the patients started with the standard recommended daily dose (400 mg) of imatinib. However, the daily dose was subsequently modified according to individual requirements. The main reasons for dose reduction were cytopenia, gastrointestinal symptoms, such as diarrhea and nausea, or development of a skin rash (Table 1). Of the 31 patients, 4 patients discontinued imatinib: 2 patients could not tolerate even 200 mg/day imatinib due to severe cytopenia; one patient developed a concomitant unrelated disease (lung cancer); one patient showed imatinib-resistance and was enrolled to a clinical trial for a second-generation tyrosine kinase inhibitor.
3.2 Imatinib dose and clinical outcome
Twenty-seven patients tolerated the drug well and showed clinical benefit: 13 patients were maintained with imatinib at a standard dose of 400 mg/day, 9 patients were treated at a reduced dose of 300 mg/day, and 5 patients received
a high dose of 500 or 600 mg/day. All of 27 patients achieved a CCR and sustained this favorable response during the follow-up period, indicating that the dosage of imatinib was considered optimal for individual patients. 16 (59%) of 27 patients with CCR achieved a MMR, but there was no significant difference in MMR rates between patients receiving 300 mg/day imatinib and those receiving 400 mg/day imatinib. None of the patients receiving 300 mg/day imatinib showed signs of disease progression.
3.3 Trough plasma concentrations of imatinib at different doses
The relationship between dose and plasma trough level at steady state is shown in Figure 1. The increase in mean plasma level was proportional to the dose of imatinib. Mean (± SD) trough plasma levels of imatinib at a standard dose of 400 mg/day were 1.40 ± 0.57 µg/ml (n=13, 95% CI 1.33-1.47 µg/ml). Trough levels at a reduced dose of 300 mg/day were 1.15 ± 0.44 µg/ml (n=9, 95% CI 1.05-1.25 µg/ml). There was no significant difference in plasma trough levels between patients receiving 300 mg/day and 400 mg/day (p=0.26). Both mean plasma concentrations exceeded the effective plasma threshold for trough imatinib levels (1,002 ng/ml), which was proposed by Picard et al to give a favorable response [7]. In contrast, a dose of 200 mg/day did not reach the effective plasma concentration. Five patients achieved a CCR at a dose of 500 or 600 mg/day without developing serious adverse effects. There was no relationship between trough plasma levels and severity of adverse events (data not shown:
see supplement Figure). Interestingly, mean trough levels of imatinib tended to be higher in patients with MMR (1.642 ± 0.709 µg/mL) than those with CCR (1.467 ± 0.494 µg/mL).
3.4 Relationship between optimal dose of imatinib and BSA
It is clinically important to clarify the reason why low-dose imatinib was sufficient in a proportion of our patients to reach the effective plasma trough concentration.
Recently, a weak correlation between steady-state trough levels of imatinib and BSA was identified and imatinib exposure (area under the curve or plasma concentration) was dose proportional in a subanalysis of the IRIS study [8].
Considering the lower median BSA in the present study (male, 1.76 m2; female 1.44 m2) as compared with that in the IRIS study (male, 2.0; female, 1.75 m2), the optimal dose of imatinib may be correlated with BSA. Thus we evaluated the relationship of BSA with optimal dose (300 mg/day vs. 400 mg/day) of imatinib.
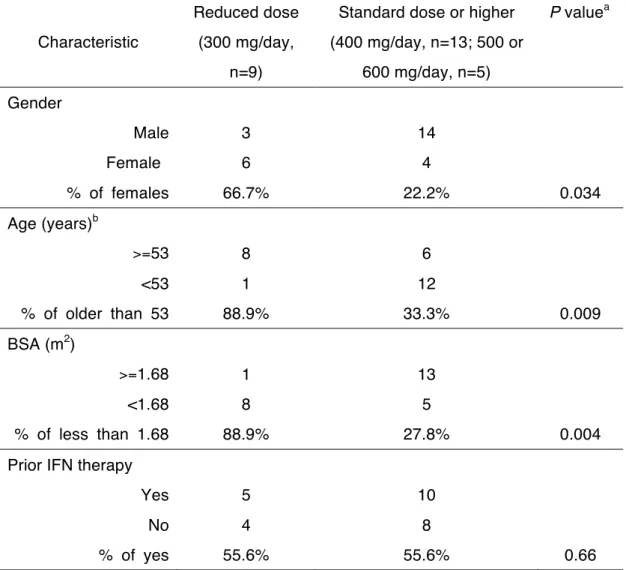
As shown in Figure 2, the median (±SD) BSA of patients receiving 300 mg/day was significantly smaller than that of patients receiving 400 mg/day (1.46 ± 0.16 vs. 1.76 ± 0.15 m2, p=0.001). Because older and/or female Japanese individuals generally have a small body size [9], we further evaluated the associations of an optimal dose (300 vs. 400, 500, and 600 mg/day) with age, gender, prior treatment with IFN, and BSA (Table 2). An optimal dose of imatinib was significantly associated with age (p=0.009), gender (p=0.034), and BSA
(p=0.004), but not with prior IFN therapy. Thus, the present data suggest that an optimal dose of imatinib can be set lower than the standard dose of 400 mg/day in smaller or older female patients.
Discussion
The standard 400 mg/day dose of imatinib is well tolerated for chronic-phase CML patients. Despite its favorable efficacy, reduced doses of imatinib are sometimes used because of severe toxicity issues [9]. In fact, 8% of patients received less than 400 mg/day during the 5-year follow-up in the IRIS study [3].
The mean daily dose for Japanese patients with early chronic-phase CML was reported to be relatively lower: 300 mg in 27% and 200 mg or lower in 20% [12].
In the present study, 9 (33.3%) out of 27 patients who achieved a CCR had been treated with imatinib at 300 mg/day. Importantly, the mean trough level of imatinib of the patients exceeded the effective plasma threshold (1,002 ng/ml), suggesting that monitoring of imatinib plasma concentrations may be beneficial to predict a clinical outcome when a reduced dose of imatinib is considered in a clinical setting.
The correlation of imatinib dose with trough imatinib concentrations was comparable to the IRIS study [8]; however, the mean (± SD) trough plasma concentration of imatinib at 400 mg/day was much higher in our study (1.40 ±
0.57 µg/ml) than in the IRIS study (0.98 ± 0.53 µg/ml). This difference is partly explained by smaller BSA of our cohort as compared with that of the IRIS study, because a weak inverse-correlation was observed between trough concentrations of imatinib and BSA in the large-scale study [8]. Racial disparities of BSA may be related with a disparity in trough concentrations of imatinib between Asian and American or European subjects.
Our study indicated that BSA was significantly lower in patients receiving 300 mg/day imatinib as an effective dose than 400 mg/day. By considering BSA with trough concentrations, a dose of 300 mg/day seems to be enough to obtain the therapeutic efficacy equivalent to the standard dose of 400 mg/day in patients with small body size, because the plasma trough level of imatinib would exceed the therapeutic concentration (1,002 ng/ml). Similar results have been reported from Asian countries: a lower dose of imatinib (200-300 mg/day) led to clinical benefits in five Japanese CML patients with low BSA (median value, 1.46 m2) [9]; Korean CML patients with low BSA (median value, 1.55 m2) benefited from 300 mg/day imatinib [10]. Taken together, these observations suggest that the standard dose of 400 mg/day imatinib may be too high as an optimal dose for a proportion of patients with chronic phase CML having low BSA and that such patients can be optimally managed with reduces doses of imatinib if the effective imatinib trough levels are sustained. Thus, individualized dose optimization
based on plasma imatinib concentrations is considered a key feature of imatinib therapy in patients with CML, particularly when intolerability arises [14].
We did not evaluate the association between an optimal dose of imatinib with drug-metabolizing enzymes and drug transporter genotypes. Previous reports demonstrated an association between the pharmacokinetics of imatinib and ABC transporters (ABCB1, ABCC1, ABCG2), human organic cation transporter (OCT1), and cytochrome P450 isoenzymes, such as CYP2C9 and CYP3A4/5 [15-18]. The role of the genetic variants and race differences in inter-individual variability in imatinib pharmacokinetics remains controversial, and further investigations are needed to determine the relative role of genetic variation and BSA variability on the optimal dose and pharmacokinetics of imatinib.
In summary, the imatinib dose that could give an optimal response with tolerable adverse effects was significantly associated with BSA, age or gender in our cohort. A reduced dose of 300 mg/day imatinib may be sufficient for the treatment of CML patients with small body size. To avoid insufficient efficacy at reduced doses, monitoring of plasma imatinib levels is recommended. A proposed algorithm for management of CML patients on the basis of therapeutic drug monitoring of imatinib may help to make a proper clinical decision, when imatinib dose modification is required in the clinical setting (Figure 3). Further
studies on a larger cohort of CML patients for a longer follow-up period are needed to confirm the relationship of the optimal dose with BSA and trough plasma concentrations of imatinib.
Acknowledgments
This work was supported in part by a Grant-in-Aid for Scientific Research from the Japan Society for the Promotion of Science (JSPS).
References
1. Druker BJ, Talpaz M, Resta DJ, Peng B, Buchdunger E, Ford JM et al.
Efficacy and safety of a specific inhibitor of the BCR-ABL tyrosine kinase in chronic myeloid leukemia. N Engl J Med. 2001; 344: 1031-37.
2. O'Brien SG, Guilhot F, Larson RA, Gathmann I, Baccarani M, Cervantes F et al. Imatinib compared with interferon and low-dose cytarabine for newly diagnosed chronic-phase chronic myeloid leukemia. N Engl J Med. 2003; 348:
994-1004.
3. Druker BJ, Guilhot F, O'Brien SG, Gathmann I, Kantarjian H, Gattermann N et al. Five-year follow-up of patients receiving imatinib for chronic myeloid leukemia.
N Engl J Med. 2006; 355: 2408-17.
4. Demetri GD, von Mehren M, Blanke CD, Van den Abbeele AD, Eisenberg B, Roberts PJ et al. Efficacy and safety of imatinib mesylate in advanced gastrointestinal stromal tumors. N Engl J Med. 2002; 347: 472-80.
5. Peng B, Hayes M, Resta D, Racine-Poon A, Druker BJ, Talpaz M et al.
Pharmacokinetics and pharmacodynamics of imatinib in a phase I trial with chronic myeloid leukemia patients. J Clin Oncol. 2004; 22: 935-42.
6. Peng B, Lloyd P, Schran H. Clinical pharmacokinetics of imatinib. Clin Pharmacokinet. 2005; 44: 879-94.
7. Picard S, Titier K, Etienne G, Teilhet E, Ducint D, Bernard MA et al. Trough imatinib plasma levels are associated with both cytogenetic and molecular responses to standard-dose imatinib in chronic myeloid leukemia. Blood. 2007;
109: 3496-99.
8. Larson RA, Druker BJ, Guilhot FA, O'Brien SG, Riviere GJ, Krahnke T et al.
Imatinib pharmacokinetics and its correlation with response and safety in chronic phase chronic myeloid leukemia: a subanalysis of the IRIS study. Blood. 2008;
9. Horikoshi A, Takei K, Sawada S. Effects of lower dose of imatinib to CML patients. Leuk Res. 2003; 27: 1167.
10. Park SJ, Choi IK, Seo HY, Sung HJ, Park KH, Kim SJ et al. Reduced dose of imatinib for patients with chronic myeloid leukemia and low body surface area.
Acta Haematol. 2007; 118, 219-21.
11. Kanda Y, Okamoto S, Tauchi T, Kizaki M, Inokuchi K, Yabe M et al.
Multicenter prospective trial evaluating the tolerability of imatinib for Japanese patients with chronic myelogenous leukemia in the chronic phase: Dose body weight matter? Am J Hematol. 2008; 83, 835-39.
12. Ohnishi K, Nishimura M, Takeuchi J, Fujisawa S, Nagai T, Miyamura K et al.
Lower dose of imatinib provides outcomes similar to the standard dose imatinib in Japanese patients with early chronic-phase CML: The interim analyses of JALSG CML202 Study. Blood. 2007; 110: 316a.
13. Hamada A, Miyano H, Watanabe H, Saito H. Interaction of imatinib mesilate with human P-glycoprotein. J Pharmacol Exp Ther. 2003; 30: 824-28.
14. Blasdel C, Egorin MJ, Lagattuta TF, Druker BJ, Deininger MW. Therapeutic drug monitoring in CML patients on imatinib. Blood. 2007; 110: 1699-1701.
15. Dulucq S, Bouchet S, Turcq B, Lippert E, Etienne G, Reiffers J et al.
Multidrug resistance gene (MDR1) polymorphisms are associated with major molecular responses to standard-dose imatinib in chronic myeloid leukemia.
Blood. 2008; 112: 2024-27.
16. Hu S, Franke RM, Filipski KK, Hu C, Orwick SJ, de Bruijn EA et al.
Interaction of imatinib with human organic ion carriers. Clin Cancer Res. 2008;
14: 3141-48.
17. Gurney H, Wong M, Balleine RL, Rivory LP, McLachlan AJ, Hoskins JM et al.
Imatinib disposition and ABCB1 (MDR1, P-glycoprotein) genotype. Clin Pharmacol Ther. 2007; 82: 33-40.
18. Gardner ER, Burger H, van Schaik RH, van Oosterom AT, de Bruijn EA, Guetens G et al. Association of enzyme and transporter genotypes with the pharmacokinetics of imatinib. Clin Pharmacol Ther. 2006; 80: 192-201.
Titles and legends to figures
Figure 1. Relationship of trough plasma concentrations of imatinib at steady state with administered dose
Each point represents the mean (± SD) plasma imatinib trough concentration.
Figure 2. Comparison of body surface area (BSA) between patients receiving 300 mg/day vs 400 mg/day imatinib as an optimal dose
Boxes represent the distribution of the 25th and 75th percentiles; lines within boxes represent median values. Bars represent ranges.
Figure 3. A proposed model of CML patient management on the basis of
therapeutic drug monitoring (TDM) of imatinib
*Patients who are unable to maintain the initial dose of 400 mg daily due to
persistant adverse effects (usually ≥ Grade 2).
**Number of patients examined in the present study is indicated in parenthesis for reference. One patient discontinued 300 mg imatinib before the sixth month
evaluation for cytogenetic response due to chemotherapy for concomitant lung cancer.
*** Target Cmin: Target trough concentration of imatinib. 1,002 ng/mL is
recommended as target Cmin according to reference no.7 and no.8.
Table 1. Characteristics of the 31 patients treated with imatinib
Daily dose of imatinib at steady state (median ± SD)
Characteristic Total
200mg 300mg 400mg >500mg
Gender (no.) Male Female
18 13
0 2
3 7
10 3
5 1 Body surface area (m2)
Median (male; female) Range
1.68 (1.76; 1.44) 1.28-2.02
1.35, 1.58 1.45 ± 0.14 1.76 ± 0.14 1.76 ± 0.18 Age at diagnosis (years)
Median Range
49 24-80
42, 71 58 ± 10 41 ± 11 41 ± 9
Age at starting treatment (years) Median
Range
52 24-85
42, 75 62 ± 9 46 ± 12 48 ± 8
Duration of treatment (months) Median
Range
45 5-72
16, 30 44 ± 21 52 ± 21 34 ± 20 Prior interferon-α treatment (no.)
Yes (no. of CCR) No
16 (7) 15
1 1
5 (3) 5
6 (2) 7
4 (2) 2 Response to imatinib
MMR CCR
Resistance a Intolerance b
Unable to evaluate c
16 11 1 2 1
2
5 4
1
10 3
1 4 1
Imatinib-related adverse events (no.) d Edema
Skin rash Cytopenia
15 / 0 10 / 1 4 / 4
0 / 0 1 / 0 0 / 1 1 / 0
4 / 0 2 / 1 2 / 3 3 / 0
8 / 0 4 / 0 1 / 0 2 / 0
3 / 0 3 / 0 1 / 0 3 / 0
a One patient with no cytogenetic response after 12 months of 800 mg/day imatinib.
b Two patients had intolerable side effects despite a reduced imatinib dose of 200 mg/day. These 3 patients (2 with intolerable side effects and 1 with no response) ceased imatinib therapy.
c A patient discontinued 300 mg/day imatinib before the sixth month evaluation for cytogenetic response due to chemotherapy for concomitant lung cancer.
d Values represent grade 1 or 2 / grade 3 or 4
Table 2. Correlation of an optimal dose of imatinib with gender, age, body surface area (BSA), and prior interferon (IFN) treatment
Characteristic
Reduced dose (300 mg/day,
n=9)
Standard dose or higher (400 mg/day, n=13; 500 or
600 mg/day, n=5)
P valuea
Gender
Male Female
% of females
3 6 66.7%
14 4
22.2% 0.034
Age (years)b
>=53
<53
% of older than 53
8 1 88.9%
6 12
33.3% 0.009
BSA (m2)
>=1.68
<1.68
% of less than 1.68
1 8 88.9%
13 5
27.8% 0.004
Prior IFN therapy Yes
No
% of yes
5 4 55.6%
10 8
55.6% 0.66
All patients at reduced dose (300 mg/day), standard dose (400 mg/day), and higher dose (500 or 600 mg/day) achieved a CCR or a MMR without developing severe adverse events during treatment with imatinib.
aFisherʼs exact test was used to evaluate the association of an optimal dose with gender, age, BSA, and prior IFN treatment.
bMedian age at starting imatinib treatment was 53 years olds.
Figure 1
Dose (mg)
Plasma concentra5on of ima5nib (µg/ml)
200 300 400 500 600
0 1 2 3 4
300 mg
(n=9)
400 mg (n=13)
1.25
1.50
1.75
2.00
2.25
Body surface area (m2 )
Op5mal dose of ima5nib
p=0.001
Figure 2
Ini5al dose
400 mg daily
Responder Non-responder
TDM of imatinib
≥ Target Cmin*** < Target Cmin
Continue reduced dose
≥ Target Cmin
Intolerance
< Target Cmin
TDM of imatinib
Dose escalation Continue the
same dose
Continue high dose 500mg or more
(n=5)
CCR Non-CCR
Acquired resistance
(n=1) (n=9)
CCR Non-CCR
(n=31)**
(n=13)
(n=2)
Figure 3
Acquired resistance
Dose reduction
Non- or tolerable toxicity
Intolerable toxicity*
Toxicity grade
NS
Plasma concentra5on of ima5nib (µg/ml)
0 1 or 2 3
0 1 2 3
Supplemental Figure A.
Imatinib trough concentrations in CML patients who develop toxicity
Supplemental Figure B.
Relationship of imatinib trough levels with BSA
There is no statistically significant relationship between imatinib trough levels and BSA
BSA/Imatinib trough conc
1.25 1.50 1.75 2.00
0 1 2 3
300 400
500 or 600
BSA(m2)
Supplemental Figure C.
Comparison of imatinib trough levels between MMR and no MMR for patients with CCyR
CCR vs MMR
MMR CCR
0 1 2 3
Clinical outcomes
The mean (±SD) plasma imatinib trough concentration:
1.642 ± 0.709 µg/mL in patients with CCR who achieved a MMR (n=16, left),