Impact of the Transformation of Built
Environment on Personal Travel Behavior in Historic Urban District
著者 曾 芬
著者別表示 ZENG FEN journal or
publication title
博士論文本文Full 学位授与番号 13301甲第1927号
学位名 博士(工学)
学位授与年月日 2020‑09‑28
URL http://hdl.handle.net/2297/00061361
Creative Commons : 表示 ‑ 非営利 ‑ 改変禁止 http://creativecommons.org/licenses/by‑nc‑nd/3.0/deed.ja
Dissertation
Impact of the Transformation of Built Environment on Personal Travel Behavior in Historic Urban District
Graduate School of Natural Science and Technology Kanazawa University
Division: Environmental Design
Student ID No: 1724052008 Name: ZENG FEN (曾 芬)
Chief advisor: Prof. Zhenjiang SHEN June, 2020
I
Abstract
1 Introduction
This PhD research aims to evaluate the impact of historic district built environment (HDBE) on the primary end-users experience and travel behavior based on the framework of HDBE indicators and personal travel indicators under the intervention of regeneration project (RP). This research is conducive to further promoting research on the correlation between built environment (BE) and travel behavior in China's high-density and compact neighborhood context. The report can help decision-makers further optimize strategies and improve environmental quality, impact planning, health and public policy.
2 Case Selection, Research Design, and Methods
There is a lack of research on the correlation between BE and travel behavior in the existing research based on the neighborhood environment in Asia cities, including China. The empirical study on a comprehensive assessment of BE impact on various transport modes also needs to be supplemented. Based on this, we select the case of Zhangzhou historic district in Fujian Province, China, which has been affected by implementation of RP, focus on personal travel behavior in the historic district and their experience feedback on HDBE. Research data includes department report data, measurement data and social survey data. The end-users of HDRP implementation are residents and visitors. For residents, we study their active travel (walking) in the historic district; for visitors, we study their motorized travel (using the automobile) behavior.
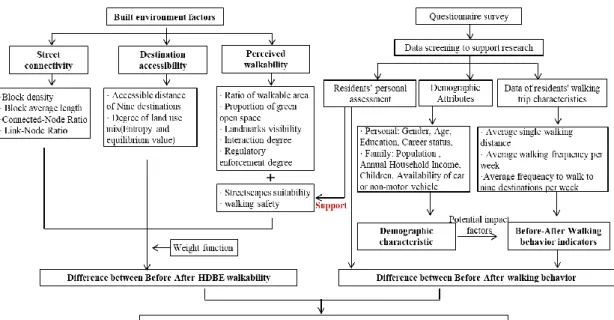
For walking travel, we set up an index system to measure the HDBE walkability, including physical indicators and perception indicators before and after RP implementation, to assess the difference of HDBE before-after walkability. By introducing a quasi-longitudinal method, we investigate residents' before-after walking behavior to evaluate the change of residents' walking behavior and its correlation with HDBE change. The report may help government agency of the
II
historic area to purposefully optimize the quality of walking environment and supplement facilities.
For automobile travel, firstly, we establish a quantitative indicator framework of HDBE traffic system under RP intervention, identify the physical changes of the HDBE related to automobile access and evaluate the driving environment and parking environment. The HDBE indicator framework includes three groups of indicators:
before-after related urban road loading capability, usage of parking lots, and bus accessibility. Road loading capability is measured by traffic Saturation and level of service; parking lot usage is measured by real-time parking space usage through continuous measurement method; bus accessibility is measured by the bus stop and bus line indicator. Secondly, through an oriented sample survey, we investigate drivers' parking characteristics and activity behavior in the historic district and assess the impact of HDBE's change on automobile visits. The report may help the government agency of historic district to purposefully optimize the quality of walking environment, and supplement relevant facilities for specific pedestrian groups.
In addition to travel behavior, the HDBE changes also can affect end-users experience in the historic district. Therefore, we introduce the cross-sectional and longitudinal ex-post evaluation (EPE) system. Through the comprehensive HDBE physical and community-based indicators, quantify the implementation content of HDRP. Then, we carry out factor analysis to investigate the main components of users' agreement preferences and differences. The cross-sectional and longitudinal t -tests are used to compare attitudes between end-users and before-after residents' attitudes to identify the contents of regenerated built environment recognized by end-users. The report may help policymakers in government agency and urban planning professionals to improve their strategies before the next phase of HDRP.
3 Conclusions
As proved by published and submitted research papers, HDBE change under RP's intervention has a positive effect on personal active travel and motorized travel.
Besides, through bottom-up feedback of end-users, we confirm the positive effect of RP implementation in promoting a walking-friendly environment and protecting
III
historical features. These reports can provide targeted improvement strategies and environment supporting suggestions for the next phase of HDRP implementation.
Keywords: urban regeneration in historic district, index system of built environment, walkability, walking behavior, traffic system optimization, automobile travel behavior, parking and activity characteristic, cross-sectional and longitudinal EPE system, sustainability
IV
Acknowledgments
The three-year doctoral study in the Urban Planning Laboratory of Kanazawa University is unforgettable and meaningful for me. I met not only many excellent researchers of integrity but also learned plentiful scientific knowledge.
Firstly, the sincere thanks must go to my supervisor Prof. Zhenjiang Shen.
During my study period, he always patient taught me what the real research is. The dissertation cannot be finished without his patient guidance and suggestion. His guidance will benefit me all my life.
Then, I am very grateful to the dissertation review panel members, Prof. Satoru ITOH, Prof. Chikata, Prof. Masashi Ohashi, Prof. Jente PAI, their valuable comments and advice on the dissertation help me to improve my research. Without their help, I would not finish the research works smoothly.
I also want to acknowledge Fuzhou University and the International Joint SPSD Lab of Fuzhou University and Kanazawa University. It was them that gave me the chance to pursue advanced study. I learned so much and promoted my academic ability over the past three years.
Furthermore, thanks to all the teachers, classmates and friends in Kanazawa University, especially companions in urban planning laboratory. I gained precious friendships and useful knowledge from communications with them.
Finally, I am particularly thankful to my family: parents, husband and grandma.
You give me strong power and support in my three years' doctoral study. I will continue to improve myself in the future with your encouragement.
V
Table of Contents
Abstract ... ... I Acknowledgments ...IV Table of Contents ... V
Chapter 1 . Introduction ... 1
1.1. Research Background ... 1
1.2. Research Purpose ... 3
1.3. Literature Review ... 4
1.3.1.Sustainable urban regeneration and evaluation ... 4
1.3.2.Correlation between BE and personal walking travel ... 7
1.3.3.Correlation between BE and personal automobile travel ... 8
1.4. Research method and Organization ... 9
Chapter 2 . Study area and regeneration practice ... 12
2.1. A brief overview of the study area ... 12
2.2. Citizens' travel mode in Zhangzhou city ... 13
2.3. Regeneration practices in the research historic district ... 14
2.3.1.History of renovation action in Zhangzhou urban area ... 14
2.3.2.Phase I regeneration project and its implementation content ... 17
Chapter 3 . Impact of the HDBE's transformation on residents' walking travel behavior ... .…..……..…..…..…..…..……..…..…..….…..……..…..…..……….23
3.1. Introduction ... 23
3.2. Methods ... 24
3.2.1.Research design and data collection ... 24
3.2.2.Data calculation rules ... 27
3.2.3.The framework of analysis methods ... 29
3.3. Results ... 30
3.3.1.Interpretation of HDBE walkability baseline level... 30
3.3.2.HDBE walkability analysis before-after RP implementation ... 32
3.3.3.Analysis of residents' walking behavior before-after RP implementation .... 33
3.4. Discussion and conclusion ... 37
VI
Chapter 4 . Impact of the HDBE's transformation on visitors' automobile travel
behavior ... …..…..……..…..…..…..……..…..…....…..……..…..….…..……....…....40
4.1. Introduction ... 40
4.2. Methods ... 42
4.2.1.Construction research framework ... 42
4.2.2.Data collection and calculation ... 43
4.3. Results ... 47
4.3.1.Analysis of before-after urban road loading capability ... 47
4.3.2.Analysis of before-after bus accessibility ... 49
4.3.3.Parking characteristics analysis after RP implementation RP ... 50
4.4. Discussion and conclusion ... 54
Chapter 5 . Ex-post impact evaluation of regenerated HDBE from personal perspective ... .…..……..…..…..…..…..……..…..…..…..…….…..……..…..…..…..….56
5.1. Introduction ... 56
5.2. Methods ... 58
5.3. Results ... 61
5.3.1.Factor analysis and interpretation of HDBE improvement indicators under RP intervention ... 61
5.3.2.The cross-sectional and quasi-longitudinal evaluation of HDBE improvement indicators .…..……..…..…..…..….…..……..…..…..…………..……..…..…..….65
5.4. Discussion and conclusion ... 67
Chapter 6 . Conclusions ... 70
6.1. Conclusions ... 70
6.2. Future work ... 72
References ... 73
VII
1
Chapter 1 Introduction
1.1.Research Background
Since the last century, cities have experienced the development of extraordinary centralization and motorization. The central area of historic cities faced challenges from a declining economy, society, and environment (Tiesdell, 1996); some destructive constructions also have appeared (Steinberg, 1996; Shin, 2010; Versaci, 2016). As one of the available means of built environment (BE)'s redesign and reconstruction, urban regeneration language in the 21st century has changed.
Sustainability is continuously explored in urban regeneration practice with increasing attention to environment and social impact. In many countries, the practice for promoting declining historic areas through urban regeneration is increasing rapidly.
Positive regeneration practice has been recognized for improving comprehensive benefits in historic regions by official agencies like UNESCO and UN-Habitat.
Neighborhood is an initiatory spatial scale of most development projects, and the impact of urban regeneration on neighborhood's BE is the most sensitive. Urban regeneration in a historic area is always more complex and uncertain than general urban regeneration. It needs to consider and try to concurrent balance several potentially contradictory goals: historical resources' protection and modernizing development, social network preserving and improving the structure of industrial structure and economy. The BE of a historic area can transform multi-aspects under the intervention of urban regeneration, including contents of physical (tangible) and non-physical (intangible). Generally, the transformation of physical environment factors impact non-physical factors, and they get together to improve sustainability.
For example, the support of high-quality physical environment for urban services helps to improve neighborhood interaction; the support of streetscape and green space for neighborhood comfort helps health and urban ecosystem service; historical architecture and its surrounding environment as a special public place, meet the cultural and social needs of the region; urban form, including street layout, mixed land use and compactness, is considered to affect the degree of community integration
2
(Jennings et al, 2016; Tam, 2016; Eizenberg and Jabareen, 2017; Lim et al, 2017).
According to different research purposes, scholars have quantified BE's elements to determine the impact of its changes. By quantifying comprehensive BE transformation content, we can determine the contribution of urban regeneration to regional sustainability. As one of BE's theme factors, travel environment can form multi BE transformation content related to travel according to different travel groups and modes. For active travel, BE's support degree for active travel can be measured by quantifying BE's indicators related to walking or cycling. For motorized travel, BE's support degree for motorized travel can be measured by quantifying BE's indicators related to automobile travel or public transportation.
Researches on active travel (mainly walking) occupy the majority of existing research on the topic of personal active travel and motorized travel. Many scholars measure different areas' walkability from a cross-sectional perspective and investigate the relationship between walking and health, built environment and walking. However, a cross-sectional study is easily raised causal attribution (Ewing and Cervero, 2010).
Furthermore, most current longitudinal studies focus on life events' impacts such as residential location or family status changes. Longitudinal studies on correlation between built environment and walking based under the intervention of renewal measures or environment improvement measures in same site are insufficient. These studies are also lack of consideration on walking perception and experience. In addition, a large number of walking studies are carried out in the context of western countries' cases (Bauman and Bull, 2007). China's high-density neighborhood environmental context is different from the sprawling western context, which brings great significance in longitudinal studies on correlation between neighborhood environment and walking behavior.
As for researches on personal mobile travel, based on consideration of sustainability, most of research purposes focus on alternative transportation to reduce car dependency. In other words, these studies try to achieve the purpose of turning to TOD travel or introducing car restriction policies instead of automobile travel through surveys of personal subjective attitude towards automobile travel or cross-sectional
3
survey of car ownership (Mackett, 2003). Some existing studies on the correlation between BE and motorized travel have shown that the transformation of BE has a certain impact on personal travel mode. However the choice of automobile travel is more influenced by attitude and personal circumstances (He and Thøgersen, 2017).
However, there is also less work in the exploration of causality, especially in the research topic that neighborhood regeneration measures affect personal automobile travel.
Whether active travel or motorized travel, current single empirical researches on the impact of BE on travel are still based on a single mode of transport, lacking integration of multiple transport modes to provide a more comprehensive assessment.
Therefore, the longitudinal study in neighborhood-scale built environment on pedestrian and vehicle travel is an important research topic, which is good for helping government agencies optimize sustainable environment and strategies to support users' travel.
1.2.Research Purpose
Positive regeneration practice in historic districts can improve space, environment, and social structure; promote the place as a space for public gatherings and exchange; ensure local residents are willing to live in their neighborhood for a long time and generate interaction and identity. Besides, it can also increase public understanding of city characteristics, attracts both native and global visitors, improve city influence, further promote cultural influence, social influence and economic benefits. As a key role of multi-stakeholders in historic district regeneration projects, end-users represent the actual user and experiencer after implementation of a regeneration project, which mainly involve residents, visitors, shopkeepers in the environment (In this research district, some residents are both house owners and shopkeepers). This dissertation focuses on those end-users who are affected by the transformation of built environment. Travel behaviors discussed in this dissertation are the residents' active travel behavior (walking) in the historic district and visitors' motorized travel behavior (using automobile) access to the historic district.
4
The purpose of this dissertation is to investigate the impact of regenerated BE on personal travel by measuring the BE's transformation content under the intervention of urban regeneration. First of all, we build an index system to measure the historic district built environment (HDBE) walkability and analyze the walkability changes before and after RP implementation. According to a quasi-longitudinal design, we evaluate residents' before-after walking travel behavior and its correlation with the BE.
In the second part, we construct a quantitative index system of HDBE traffic system under RP intervention and follow longitudinal analysis and continuous measurement method to investigate indexes change. Then, we assess HDBE impact on personal automobile accesses through visitors' travel reports. Finally, through the construction of physical and community-based HDBE comprehensive index systems under RP intervention, we extract main factors to interpret and cross-sectional. Longitudinal examine residents and visitors' feedbacks to evaluate the HDRP practice degree in sustainability comprehensively. The research will help decision-makers improve their strategies and further optimize the sustainable environment to support users' travel.
1.3.Literature Review
1.3.1.Sustainable urban regeneration and evaluation
Historic city carries culture and charm in a long process of city development. Its adaptation to modern life and sustainable development has always been the focus all over the world. Cities have experienced rapid and centralized development over the last century, but the renewal strategy focusing on economy has led to divided cities and further decay in surrounding areas (Berry, 1985; Fainstein et al., 1992; Healey et al., 1993). Urban regeneration language in the 21st century has changed, along with increasing attention to the principle of sustainable development has gradually affected urban regeneration agenda, the relationship between sustainability and urban regeneration has become increasingly close, especially in historic cities. As an area with concentrated historical and cultural distribution, historic district mutualized with a central area, it is a place not only preserves citizens and cities' traditional memory but also a community where aboriginals live for a long time (Steven et al., 1996).
5
Therefore, a regeneration plan in historic district is generally more complicated.
Sustainable HDBE regeneration needs to consider a comprehensive strategy to realize the sustainable improvement of the economy, community, and environment by balancing historical resources' protection and modernizing development, social network preservation, and improving industrial structure and economy (Zhou et al., 2017a). Just like many fast-growing cities all over the world, Chinese cities have undergone unprecedented urbanization development. China's urban regeneration is synchronized with urban expansion, forming a more complex environment than regeneration practice in western countries (Wu et al., 2011). China's land reform, which brought about dramatic development effects in the last century, was almost on the same development timeline as the promulgation of national historic city's legal protection. In the context of an acute clash, the sustainability of early urban regeneration has been questioned (Chen and Ma, 2004). Despite all this, China's regeneration in recent years has experienced a rapid transformation from being economy-oriented to a sustainable culture-led mode and spring up many sustainable practices (Yung et al., 2014; Zhong, 2016; Zhou et al., 2017b).
The evaluation of sustainable urban regeneration has been paid more and more attention. The complexity of urban regeneration highlights the importance of providing comprehensive evaluation tools for decision-makers (Roberts, 2000). These tools are proposed because they can reflect stakeholders' needs and regeneration objectives. Existing evaluations are mainly conducted on basis of economy, society, and environment. Comprehensive evaluation generally uses qualitative or quantitative methods or a combination of these two methods, including ex-ante, in- itinerary and ex-post evaluation according to the entire life cycle of regeneration (Marta et al., 2020). To investigate a comprehensive evaluation in different RP types, Hemphill et al. (2004) constructed an extensive evaluation index framework, including 52 indexes in five aspects of economy, resource use, land use, transport, mobility and community benefits. Ng (2005) focused on Hong Kong's stakeholders (sectors) in potential urban regeneration and assesses the planning stage before RP implementation. In order to guide a formulation of sustainable regeneration strategy in the future, he assessed
6
cognitive differences among three sectors (civil society, private sector, and public sector) through indicator system of five aspects (including participation, community characteristic, equity, environment, and local economy) totally 27 indicators related to the quality of life. Yu and Kwon (2011) were also assessed based on the whole project life cycle. In addition to success factors, their indicator framework also took into account factors that possible to lead failure. Through regeneration practice in South Korea, they revealed that reducing stakeholder conflict was the most critical element.
Zhou et al. (2017a) also started from the overall framework of all phases of the project, but he focused on HDRP, which was more complicated than general RP. They established a link between each critical success factor (CSF), trying to find a common path to success. Finally, they extracted six dimensions 29 indicators of six dimensions, including project implementation, project characteristics, organization governance, external environment, participants, and the conservation of historic and cultural values.
They explored a network relationship between indicators and provided a CSP framework applicable to any type of RP. Beyond that, some scholars measure the impact of sustainable regeneration from perspective of a single factor like environmental impact, economic impact, or public participation (Jon, 2003; collier, 2011; Ploegmakers and Beckers, 2015). For example, Ploegmakers and Beckers (2015) focused on the implementation effect evaluation of physical regeneration of dilapidated urban industrial places funded by the Dutch government. After analyzing the economic development indexes of different time from the start to a certain period after completion of the regeneration project, they found that the physical regeneration of industrial land had no significant impact on the economic results. The research of Yu (2011) and Zhou et al. (2017) represents most of the contents of this kind of assessment, namely, overall strategy assessment from the whole life cycle of project planning to implementation. These assessments seem to establish comprehensive indicators and frameworks, but there is no consensus in practical application (Zheng et al., 2014).
In terms of the complexity of regeneration strategy's intervention effect and some spillover effect, it can lead to results that are difficult to evaluate (Ploegmakers and
7
Beckers, 2015). Despite all this, from the evaluation and report of scholars, we can still summarize the elements of BE design in sustainable urban regeneration, mainly including spatial form elements (like street, form, land use, architecture, public space, amenities and facilities), social elements (like civil service, interaction, participation, cultural demand, satisfaction, fairness, safety), and environmental elements (like transportation, natural resources supply, eco, and energy-saving) (Jennings et al., 2016;
Marsal-Llacuna, 2016; Cherry, 2017; Tin and Lee, 2017; Eizenberg and Jabareen, 2017).
As Yu and Kwon (2011) revealed, the conflict of stakeholders is also the key factor that leads a failure. In a regeneration project, it is crucial to implement people-based and place-based strategies (Mcdonald et al., 2009). As an essential participant affecting strategy implementation's effectiveness, end-users' perception of their environment of sojourn plays a core role in determining how urban regeneration initiatives should be conducted. The ex-post evaluation's circular feedback and promotion of continuous improvement have been widely recognized. Through an appropriate evaluation of regenerated BE by end-users, effective content of regeneration plans that address local preferences and location-specific responses can be given useful feedback to a certain extent, to improve strategy and application environment further, and increase sustainability.
1.3.2.Correlation between BE and personal walking travel
As a time-honored transport mode, walking has great advantages in a short-distance trip. Many scholars have reported that walking unfriendly environments makes pedestrians frustrated, while a friendly environment makes people interact more closely with their neighbors (Handy et al, 2002; Saelens et al, 2003; Lee and Moudon, 2004; Ewing and Handy, 2009). Review the previous researches, there is enough evidence to prove the correlation of BE and walking behavior (Wang and Yang, 2019). The measurement method of BE walkability has experienced continuous development and improvement, from the begin with 3Ds theory of Cervero and Kockelman (1997), to NEWS theory developed by Pikora et al.
(2003), four classic walkability indexes of Frank et al. (2006), 5D theory of Ewing et
8
al. (2009), and recently 7C theory of Moura(2017). The development of measurement theory model changed from physical indicators' calculation to comprehensive measurement of physical indicators combined with aesthetics, security, and interaction. Perception represents the extent to which people feel comfortable and safe for walking (Su et al., 2019). Though individuals have various perceptions, there are also ways to follow. Walking safety and experience indicators were also proved to be necessary and useful in measuring walkability (Rzotkiewicz et al., 2018).
Most correlation researches between BE and walking are cross-sectional and easily raised causal attribution (Ewing and Cervero, 2010). Existing longitudinal research focuses on life events' impact on transport modes, such as residential location or family status changes (Gao, 2019), or bases on a longitudinal timeline of cross-section comparison research (Hirsch et al., 2014). There are still a few longitudinal studies based on impact of improvement measures. Based on the change of BE and population characteristics under the influence of a natural experiment on a campus in Hong Kong, Sun et al. (2004) measured the change of students' walking behavior and reported that BE change had a significant impact on walking, students' walking distance and walking travel increased. Carlson et al. (2019) reported the impact of a fast street view improvement project on pedestrian activities. He recorded the pedestrian activities’ amount before and after the project in the same place and revealed an increase in pedestrians’ number. We can note that these longitudinal reports do not consider the factors influencing pedestrian perception and experience.
Most current research on the relationship between adult walking behavior and BE is based on the case backgrounds of the United States, Europe, or Australia. On a neighborhood BE scale, Asian cities have a higher density context, which western research reports may not apply to China (Koohsari et al., 2020).In summary, longitudinal researches based on the Chinese neighborhood built environment and walking behavior needs to be further supplemented.
1.3.3.Correlation between BE and personal automobile travel
Current researches on the correlation between BE and personal automobile travel focuses on improving location's BE to reduce car dependence and promote walking or
9
cycling. No studies have reported direct evidence of BE changes impact on personal automobile accesses. However, BE changes impact personal recreational travel attitude and travel demand directly related (Mouratidis, 2019), which indirectly impacts personal choose to visit by automobile.
For this indirect impact, Forward (1999) found in his interview research that the main reason why respondents prefer to use cars in short trips was convenience. This convenience reflects the advantages of an automobile in carrying goods, giving lifts or saving time, and this advantage has also become the main reason for individual using car for short trip. These advantages that make travel convenient were discussed separately by scholars (Cullinane and Cullinane, 2003; Mackett, 2003; Walton and Sunseri, 2010). Sylvia and John (2017) also confirmed that the choice of personal travel mode (especially automobile travel) still depends on the influence of personal and situational factors. Lee et al. (2017) found that travelers are more likely to drive when destinations involve shopping trips or connecting two or more destinations.
Flexibility and comfort make an automobile has a more significant advantage in these two types of travel. Their report supports a significant correlation between built environment and travel demand. Wooller et al. (2012) revealed that, when a destination's BE with condition of an optimized transportation system, diversified commercial types, and walking-friendly, it will improve visitors' number and satisfaction degree, increase commercial activities. In fact, the above research proves an indirect causal relationship between the improvement of a particular aspect of destination BE and promotion of personal automobile travel.
1.4.Research method and Organization
This PhD research assumes that the regenerated HDBE under RP intervention has a certain degree impact on the historic district personal travel activities and experiences. To confirm the hypothesis, we construct a quantitative index system of regenerated HDBE, measure personal behavioral activity characteristics from two transport modes of residents' walking behavior and visitors' automobile visit behavior, and investigate the HDBE impact on personal travel through longitudinal analysis.
We also introduce cross-sectional and longitudinal EPE system based on the
10
summarization of comprehensive HDBE indicators, to achieve the sustainable contents of regenerated HDBE recognized by these users' feedback. This research focuses on identifying the positive causal relationship between HDBE and personal comprehensive travel behavior, which can help historic districts and surrounding central urban areas further optimize the sustainable environmental quality and strategy to support visit or travel in future development.
The dissertation consists of six chapters. As this dissertation is an empirical study based on the case, Chapter 2 introduces research area selection and the research area's regeneration project. The main content of the dissertation is organized into three parts. In Chapter 3, we investigate HDBE's change influence on residents' walking behavior. Firstly, we set up an index system to measure the HDBE walkability, which including physical index and perception index, in order to assess the difference of HDBE before-after walkability. Then, we investigate the measurement indicators of residents' walking behavior through a quasi-longitudinal method and identify the difference in before-after walking behavior. Finally, the correlation between HDBE's change and walking behavior's change was tested by correlation test, and we identify the specific content of walking behavior affected by regenerated HDBE. This work has been published on the International Journal of Environmental Research and Public Health (SSCI, SCIE) in June 2020. This part of report may help the government agency of historic district to purposefully optimize the quality of walking environment and supplement relevant facilities for specific pedestrian groups.
Following chapter3, Chapter 4 investigates the historic district as a recreational destination and how the change of HDBE impacts visitors' automobile travel and visit.
Firstly, we have established a longitudinal HDBE traffic system index system, consisting of three components of traffic flow, parking lot usage, and public transport (bus) accessibility. Then, we perform an oriented sample survey to investigate drivers' parking characteristics and activity behavior in the historic district and assess the impact of HDBE's change on automobile accesses. For this chapter, we have published two papers. One paper is published on the Proceeding of the 2018 International Workshop on Urban Planning and Management; the other paper has
11
been accepted by the International Journal of Sustainable Design in May 2020. This part of report may help the government optimize the traffic management of surrounding urban roads and the facilities in the historic district.
Following the assessment of travel behavior, in Chapter 5, we have established respective 19 improvement index systems of HDBE hard (physical) and soft (community-based) under RP intervention according to different user roles of resident and visitor, and carry out factor analysis to investigate the main components of users' agreement preferences and differences among them. We introduce a cross-sectional and longitudinal EPE system to identify residents' evaluation before-after change of HDBE and the different experiences of regenerated HDBE between residents and visitors. This part of report will help policymakers in government agencies and urban planning professionals improve their strategies before the next phase of RP in the historic district.
Finally, in Chapter 6, we will make conclusions for this PhD research, pointing out the deficiencies of current work and additional research content that are needed to supplement in the future.
12
Chapter 2 Study area and regeneration practice
2.1. A brief overview of the study area
This PhD study area is the Zhangzhou ancient city historic district. Zhangzhou is a mid-sized coastal city of Fujian Province in Southeast China. Economically, it is the fourth city after Fuzhou, Xiamen, and Quanzhou. Internationally, it is famous for the world heritage ―Tulou‖ in the countryside. It was added to the list of National historical and cultural city in 1986, because of its particular state of preservation. Like many other mid-sized coastal cities in China, Zhangzhou, which was influenced by the rapid development of large cities, struggled to achieve continuous growth and prosperity. Historically, the ancient city historic district referred to Tang-Song inner town, a core part of Zhangzhou ancient city. The current historic district is a neighborhood with about 0.5 square kilometers, which boundary goes through appropriate adjustments based on the urban road network and government administration. According to administrative division in Zhangzhou, the historic district's administrative jurisdiction belongs to the Xiqiao subdistrict, which includes four residential communities. Although the historic district has gone through several adjustments with a change of dynasties, the retained basic morphology and street texture inherit the initial layout of the Republic of China.
The historic district also is a traditional living settlement in the city apart from a core part of Zhangzhou old city. The neighborhood has a high built footprint, low and continuous buildings, mixed land use, and dense street network, which is significantly different from the Western community context. The plane morphology of the historic district is basically a structured grid square. The straight line distance from its geometric center point to the boundary is 300-500 meters, which is in accord with the comfortable walking distance range and suitable for research.
13
a) b)
c) d)
Figure 2.1 Location and scope of the study area: (a) Location of Zhangzhou municipality in China and in Hokkien Golden Triangle; (b) Study area in Zhangzhou downtown area; c) Historical scope of
Zhangzhou ancient city and the historic district; d) Scope of study area (2017 Google image)
2.2.Citizens' travel mode in Zhangzhou city
Through the traffic subject plan report of Zhangzhou planning department in 2014, we can achieve the composition of citizens' daily travel mode (some data was supplemented in 2016). The main travel mode of Zhangzhou citizens are non-motorized travel (including walking, cycling and electric bicycles), and reach 54%
of all travel modes (in 2014). In recent years, bicycles are gradually replaced by electric vehicles in Zhangzhou, so the main non-motorized travel mainly includes walking (21.17%) and electric bicycles (25.5%). In terms of motorized travel, citizens'
14
main travel modes are personal automobile and bus. The proportion of bus travel increased from 6.08% in 2014 to 12.25% in 2016, but the proportion was still low, especially in the old town areas. The proportion of personal automobile travel accounts for 13.46% (in 2014) of all travel modes and has a continuous increasing trend with the increase of car ownership. The growth rate of personal automobile ownership in the whole city reaches 16.3% from 2003 to 2016; growth rate in downtown area reaches 9.7% from 2003 to 2016, and is still in growth (Figure 2.2).
Figure 2.2 Personal car ownership in Zhangzhou downtown area from 2003 to 2016
2.3.Regeneration practices in the research historic district 2.3.1. History of renovation action in Zhangzhou urban area
As a historic city, Zhangzhou's protection and renovation action began in 1988.
The government's Committee of Municipal and Rural Construction (CMRC) formulated the first conservation plan of Zhangzhou historic city as the government's initial response to heritage protection, which also indicates the origin of conflict between historic preservation and urban expansion. At that time, the city's historic urban district involves four parts: ancient city historic district in the core area and three smaller historic districts in the east, which connected in history. Roads have been widened and urban landscape has been changed for the sake of progress and fast modernization. Demolition and reconstruction of historic buildings in those three
15
districts continuously occurred. Historic areas were shrinking, and community integrity was destroyed, modern architectures mushroomed without any respect to the local context, thus replacing old buildings (Figure 2.3). However, in order to keep some ties with the past, unlike the fragments of the historic districts on the east side, the government is devoting its protection efforts to the ancient city historic district.
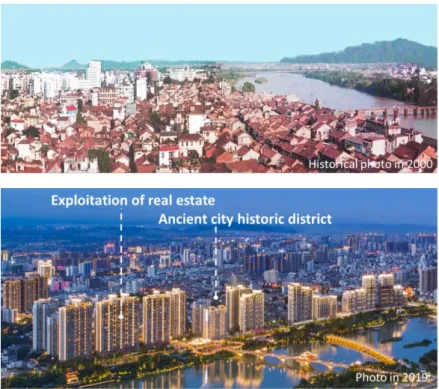
With the investment of special conversation funds for national historic city, the government has carried out local protection and repair measures in several core streets, including environmental improvement, repair and renovation of building facades and street pavements. The implementation achievements of conversation plan obtained UNESCO Asia Pacific Heritage Awards for cultural heritage conservation in 2004 (Figure 2.4). Unfortunately, the government, which has invested in urban motorized vehicle lanes construction and real estate exploitation since 2000, has made the ancient city historic district shrink in the following ten years, and remaining areas severe decay (Figure 2.5, Figure 2.6).
a) b)
Figure 2.3 Review on the preservation scope's change of Zhangzhou ancient city. a) In yellow; four historic districts in 1988; b) protection scope of fragments of the remaining historic districts in the
urban area in 2001
16
Figure 2.4 Renovation action's outcome in 2003 (won the UNESCO awards for cultural heritage conservation)
Figure 2.5 Change of urban landscape around the study area from 2000 to 2010.
17
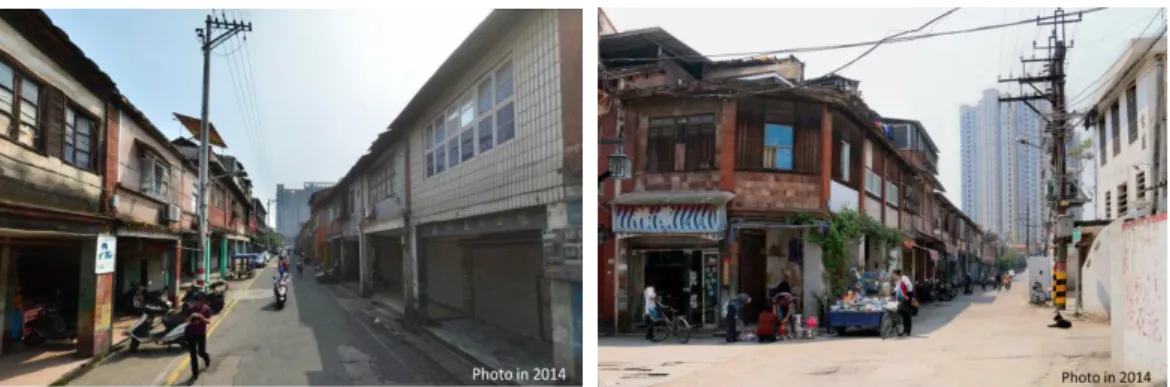
Figure 2.6 Declining areas in the historic district
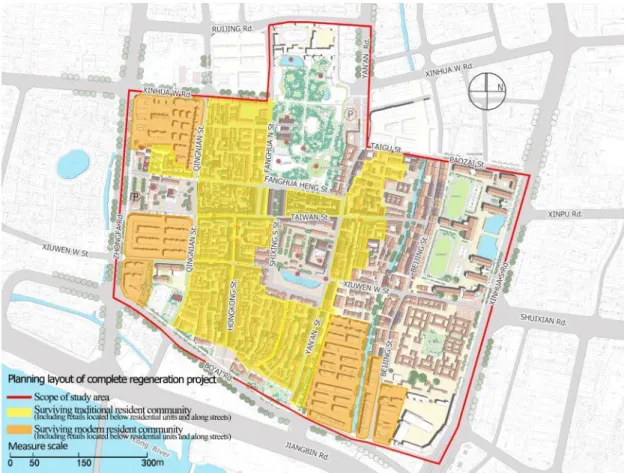
2.3.2. Phase I regeneration project and its implementation content As mentioned above, the ancient city historic district has implemented several local renovations since 1988, such as the restoration and renewal of local building facades and some street pavements. Different from the previous small-scale renovation actions, the regeneration project started in 2015 is a comprehensive integration vision and action for the entire historic district (Figure 2.7). It aims to improve the district's economic, social, and environmental conditions and create a comprehensive community for life, culture and tourism. Ancient city historic district reopened to the public at the end of 2016 after mainly areas accomplished implementation of Phase Ⅰ regeneration project. As a small part of restoration and construction has not completed at that time, small-scale implementation remains in progress in the next two years. By the beginning of 2019, there are four traditional residential communities survive, with more than 10,000 residents in the in the whole study area. The main streets retain the commercial function along streets in history and last the arcade building form (Figure 2.8, Figure 2.9).
18
Figure 2.7 Planning layout of complete regeneration project
19
Figure 2.8 Regeneration outcomes after phase I implementation
a) b)
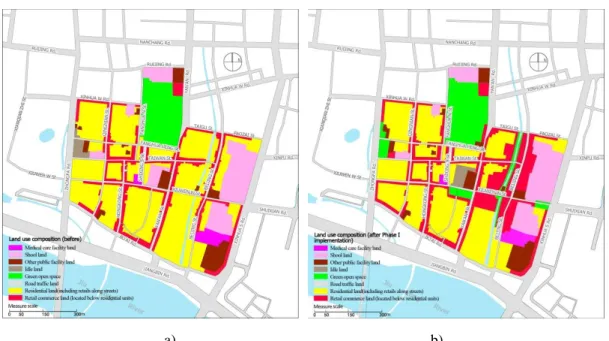
Figure 2.9 Land-use composition. a) Before; b) After phase I implementation
The phase I project's physical intervention mainly includes: traffic system optimization, environmental design, commercial planning and architectural renovation.
·Optimization of traffic system. RP adjusted the internal traffic mode based on preserving original streets' morphology and width. Before RP implementation, the traffic system in the historic district was a mixture of pedestrians and automobiles.
The original width of three north-south inner vehicle lanes was narrowed, especially Yan'an Street and Beijing Street, and bore a lot of automobile traffic across historic districts. Therefore, previous vehicle lanes in the area were almost adjusted to non-motorized for pedestrian and non-motor vehicle access after RP intervention (Qingnian Street was temporarily retained) (Figure 2.10). At the same time, as a tourist destination, the historic district was set up special bus lines, and bus stops in the surrounding.
20
a) b)
Figure 2.10 Street layout of vehicle rejection in the historic district. a) Before; b) After
On the premise of protecting streets' morphology and avoid demolishing, idle land on the west entrance, the idle land and existing underground space in the Park Corner on the north entrance provide the possibility for construction of parking lots.
The renewed district provides two underground parking lots at the West and North entrances, respectively. Combined with the construction of entrance squares, restricted lanes for cars to enter underground and special facilities for pedestrians to connect with underground parking were set simultaneously. The parking lot was equipped with intelligent parking guidance and real-time electronic display facilities for vacant parking spaces. The north parking lot combines the design of open space at the north entrance, providing 121 parking spaces (a small number of ground parking spaces combined with access to underground); the west parking lot combines open space (square) design at the west entrance, providing a total of 169 parking spaces (Figure 2.11, Figure 2.12).
21
a) b)
Figure 2.11 Entrance design of the project. a) Entrance layout of pedestrian and automobile (after phase I implementation); b) Before-after landscape of west and north entrance
Figure 2.12 Entrance space and underground space of parking lots
· Environmental design. The content includes improvement of district infrastructure (such as pavement, municipal pipe network, and some facilities) and green space, allocation of street furniture, an arrangement of three entrance squares, and restoration of historical open space. The arrangement of open space provides more leisure and exercise places for residents and visitors.
22
·Surrounding vacant lands are designed as retail stores after the restoration of historical open space, and some style conflict and declining buildings are renovated or rebuilt together.
23
Chapter 3 Impact of the HDBE's transformation on residents' walking travel behavior
3.1.Introduction
Before the major transformations in transport mode of human society, walking as a simple and ancient transport mode was always used by human beings. Compared with other modes of transport like cycling, driving, or riding, walking is very simple and achieved a global consensus on the benefits to human's physical and psychological health. Generally, factors that determine or influence people to choose to walk travel mainly include personal attitude and preference, population characteristics, and built environment. Much evidence shows that an unfriendly walking environment frustrate pedestrians, while a friendly environment makes people prefer to interact with their neighbors. In order to measure the specific impact of BE, walkability index has been developed to determine the extent to which the BE is beneficial to walking. A development axis on measurement of BE walkability in the past decade was formed. These measurement frameworks started from the 3Ds theory of Cervero and Kockelman (1997) and were gradually developed by Ewing et al.
(2009), until the 7C layout proposed by Moura (Pikora et al., 2003; Frank et al., 2006;
Ewing et al., 2009; Moura, 2017). The measurement standard has changed from the calculation of only physical indicators (such as density, land structure, street layout) to increased consideration to the interaction between mankind and environment, like aesthetic, safety, and perception indicators. Especially for those residents in traditional living community, the neighborhood social network is more closely connected with the community environment (Jun and Hur, 2015). It is also necessary to measure perception indicators related to walking safety and experience (Rzotkiewicz et al., 2018). BE walkability score has measured how friendly different areas' environment is to pedestrians. Therefore, many cities began to improve BE in order to create more livable and walkable places. Numbers of studies also support the hypothesis that some improvement measures can positively affect pedestrians (Sun, 2014; Ewing et al., 2015). However, most quantitative researches on the topic related to BE and walking
24
are cross-sectional and easily raised causal attribution (Ewing and Cervero, 2010).
Besides, the majority of current research is based on the case backgrounds of the United States, Europe, or Australia. On urban neighborhood BE scale, Asian cities, including China, with a high density and compact context, which are different from sprawling western context, and urgently need to supplement Asian cases.
We summarized and absorbed the experience and shortcomings of previous studies on the correlation between BE and walking, and put forward a more comprehensive measurement index and longitudinal framework. First of all, the BE walkability index we set up includes the developed physical index and community-based index, namely, perception and interaction index to the environment.
Secondly, the longitudinal BE walkability index and residents walking index were captured to confirm the difference between before and after. We carried out a correlation test to examine the correlation between them. Some information for planners and managers via the report is intended to optimized pedestrian environment quality and promoted a more attractive, inclusive, and walking-oriented healthy city.
3.2.Methods
According to physical indicators of developed BE walkability, indexes of street connectivity, land use structure, and destination accessibility are generally recognized.
In order to solve the problem that physical calculation indexes are incomprehensive capturing BE walkability, we supplement the perception indicators in Moura's 7C layout to set up a comprehensive HDBE indicator system (Moura, 2017). Seven indicators in Moura's 7C layout were weighted to get the results by weight function of adult's utilitarian walking.
3.2.1.Research design and data collection
The data used in this study include the collection of HDBE walkability indicators and residents' walking travel indicators.
25
Figure 3.1 Research framework
·HDBE walkability. Combined with physical indicators of developed BE walkability and perception indicators of 7C layout, three groups of indicators are formed here for calculation: street connectivity, destination accessibility and perceived walkability. Our classification of destinations references the experience of Chinese scholars in the classification of daily destinations because residents' lifestyles in china are different from western. Yintao (2013) divided neighborhood destinations of Shanghai communities into 20 classes for measurement. Weng et al. (2019) divided into six categories and 15 subcategories, including commercial service, medical care, municipal administration, education, finance and telecommunication, and elderly care.
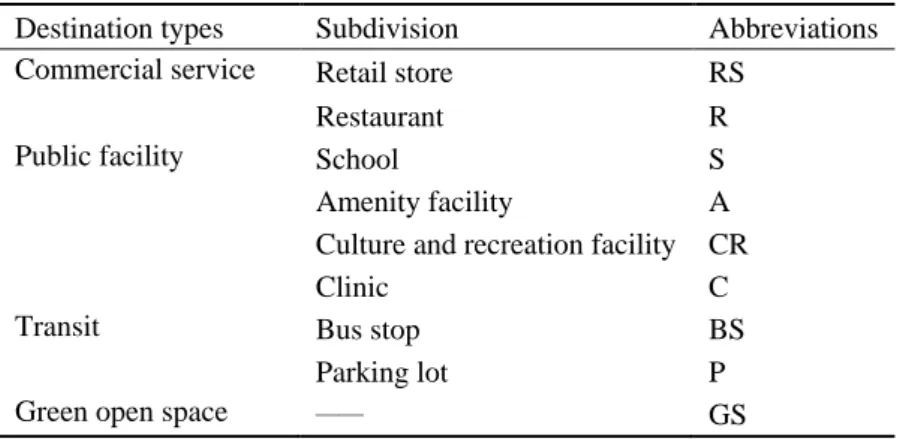
Considering the whole population of all ages, we divided destinations into four categories and nine subdivisions.
26
Table 3.1 Classification of daily life destinations
Destination types Subdivision Abbreviations
Commercial service Retail store RS
Restaurant R
Public facility School S
Amenity facility A
Culture and recreation facility CR
Clinic C
Transit Bus stop BS
Parking lot P
Green open space —— GS
Walkability index measurement was based on three kinds of documents:
Zhangzhou planning department's status investigation files before RP implementation, the 1:2000 topographic file in 2012 provided by surveying department, delay images of Tencent and Baidu online street view. Since the RP implementation does not change the overall pattern and street network in the historic district, measurement contents after RP implementation were supplemented by field surveys based on the aforementioned documents. The measurement of perception indicators involved subjective attitudes, so some indicators were combined with the report acquisition of sample survey.
·Indicators of resident walking travel were obtained through a sample survey. To implement longitudinal research, we needed to settle the difficulty of achieving previous data, so we followed a quasi-longitudinal method. Interviewees were requested to report previous and current walking behaviors, and the previous walking behaviors were reported in the way of review. This method is considered an effective way to improve causality BE and travel, and can control the influence of variables like attitudes over time (Handy et al., 2005; Milakis et al., 2017). Except for walking frequency per week and average single walking distance, interviewees need to report a self-assessment of project implementation influence degree on the change of personal walking behavior and a multiple response assessment of subjective evaluation to destinations on improved or reduced accessibility.
In addition, demographic information was collected as covariates. We divided them into two types: individual and household, including age, gender, education,
27
career status, children in household, annual household income, automobile ownership, and electric bicycle ownership.
The sampling survey was conducted from November 16 to 26, 2018, with the help of subdistrict agency staff. We conducted a random interview with families of community residents to ensure respondents were evenly distributed. Residents who relocated after the project implementation were not eligible to participate, and all respondents anonymously used their data for academic purposes.
3.2.2.Data calculation rules
HDBE walkability index is mainly obtained by calculation. The calculation rules are as follows:
Group1: Street connectivity index. (1) Block density (N/km2): Number of blocks per unit area, indirect data used to detect street connectivity; (2) Average length of street segments (km): Average length of street segments between adjacent two intersections; (3) Street network density (km/km2): Street length on neighborhood unit area; (4) Connected Node Ratio (CNR) (Dill, 2004): The ratio of street intersections number and the street intersections number plus cul-de-sacs number. The index was measured in a 0-1 scale; (5) Link-Node Ratio (LNR) (Dill, 2004): The ratio of road sections number connecting two nodes and nodes number. When the LNR is higher, the connectivity is better. On a block with good connectivity, LNR value should be greater than 1.4.
Group2: Destination accessibility index. (1) Count the average walking distances to the aforementioned nine destinations. Due to the research district is regular and square, walking distance between the geometric center and the boundary is within 300-500 meters. Therefore, the average shortest walking distances from four community geometric centers to the nearest three of nine classes' destination in the historic district is calculated to measure the average distance to a destination. The equation is:
∑
(3.1)
28
Where j is the category of destination, Dj is the average mean value of the shortest walking distance from four community geometric centers to the nearest three destinations.
(2) Count the proportion of each type of land area in district unit area (square kilometer), including Residential land, commercial land, Service facility land, road traffic land, and green open space land. Shannon's information entropy theory was used for reference to express land use structure and equilibrium degree by the results of entropy value (H) and equilibrium value (J). The equations are:
E= ∑ (3.2)
Ed= E/Emax= ∑ (3.3) Where E is the entropy value, Ed is the equilibrium value, pi is the proportion of class i land area, and n is the calculated land number.
Group3: Perceived walkability index. (1) Ratio of street walkable area: the ratio of walkable area to total neighborhood area; (2) Proportion of green open space: the ratio between the area of green open space and total neighborhood area; (3) Streetscapes suitability and walking safety: Evaluation results of respondents (from 1 point being ―very dissatisfied‖ to 5 points indicating ―very satisfied‖) are used to qualitatively measure the index before and after project implementation; (4) Landmarks visibility: we use 0-2 points to measure the visibility of landmarks like historic sites, characteristic buildings, squares or parks, where 1 point is given to street segments that have a view of a landmark, 2 points are given to a situation where landmarks are located in street segments, otherwise, 0 points are given; (5) Interaction degree: the ratio of street segments with communication space to all street segments.
The communication space here refers to open shops, restaurants, activity rooms, and other buildings that can initiate an interaction at night; The index was measured in the 0-1 scale; (6) Regulatory enforcement degree: the ratio of street segments that have implemented current pedestrian-friendly regulations to all street segments, such as street segments with vehicle control, pavement arrangement, or crossing guidance intervention. The index was measured in the 0-1 scale.
29
Finally, the final comprehensive BE's walkability score (W) is calculated by weight function and is converted to measure on a scale of 0-100 points. The equation is:
Walkability score = [(0.17* Connected node ratio)+(0.06* Equilibrium degree)+(0.17* Suitability of streetscape)+(0.17* Interaction degree)+(0.11*
Landmarks visibility)+(0.22* Walking safety)+(0.11* Regulatory enforcement degree).
3.2.3.The framework of analysis methods
The analysis is divided into two steps. Firstly, primary calculation of descriptive statistics was introduced to examine the basic distribution of data, valid skewness and kurtosis thresholds were set -2 to 2. We performed a paired sample t-test to examine whether there is a significant difference between before and after groups of walkability indexes. Analysis of covariance (ANCOVA) was used to test the difference between the three groups' variables' effects on before-after HDBE.
Secondly, we performed a paired sample t-test to examine variables of before-after walking behaviors of all samples' reports to confirm the significance of change. On this basis, we take the residents' self-assessment result of RP implementation influence degree on the change in personal walking behavior (self-assessment result) as an independent variable, demographic data as covariates, and performed Spearman correlation analysis to examine the statistical correlation between self-assessment results and demographic characteristics. The purpose is to enable respondents to actively exclude possible subjective walking changes, so as to confirm that changes are caused by RP implementation. Furthermore, the Chi-square test was used to determine the subgroups with significant differences in demographic variables.
Finally, subgroups that changed significantly were separately compared with the walking behavior variables before and after. We performed a paired sample t-test for walking behavior variables with a normal distribution and Mann-Whitney-Wilcoxon test for walking behavior variables with an abnormal distribution. After comparing the visit frequency to destinations, walking frequency, and walking distance of subgroups with significant difference separately, the final results are used to explain the effective
30
intervention of the BE change on residents' walking trips. All statistical analyses of HDBE walkability variables and residents' sample survey indicators were conducted in SPSS 22, and the significance level was set at p< 0.05.
3.3.Results
3.3.1. Interpretation of HDBE walkability baseline level
Table 3.2 shows the HDBE walkability calculation results of 23 indicators in 3 groups. Firstly, three groups of walkability indexes before RP implementation were interpreted to measure the walking environment's baseline level in the historic district.
Table 3.2 Calculation result of HDBE walkability variable
Components Variable Value(before) Value(after)
Street connectivity C1 Block density 52 54
C2 Average length of blocks 0.13 0.12 C3 Density of street network 16.82 18.02 C4 Connected node ratio(CNR) 0.98 1.00
C5 Link-Node ratio(LNR) 1.51 1.56
Destination accessibility A1 Distance to RS 0.06 0.08
A2 Distance to R 0.16 0.13
A3 Distance to S 0.32 0.37
A4 Distance to A 0.24 0.25
A5 Distance to CR 0.45 0.45
A6 Distance to C 0.29 0.29
A7 Distance to BS 0.52 0.41
A8 Distance to P 0.00 0.42
A9 Distance to GS 0.38 0.24
A10 Entropy 1.46 1.55
A11 Equilibrium degree 0.91 0.96
Perceived walkability P1 Ratio of street walkable area 0.05 0.11 P2 Ratio of green open space 0.10 0.15 P3 Suitability of streetscape 2.86 4.07
P4 Walking safety 2.30 4.22
P5 Landmarks visibility 0.58 1.00
P6 Interaction degree 0.67 0.81
P7 Regulatory enforcement degree 0.25 0.62
Walkability score W —— 59.3 81.2
31
From the street connectivity index, we can judge the overall layout of the street network in the district. Block density average length of blocks indicate the block size information between intersections in the historic district. According to Jacobs (1993), the eligible dimension range of street segment length is 0.12-0.15 kilometer, which reveals that the district's street segment length is suitable. The value of CNR (C4=0.98) revealed that there was almost no cul-de-sac in district. Combined with the value of LNR (C5=1.51), it showed that the district was composed of many small blocks, and intersections with various paths between each block and consequently form desirable connectivity of the street network.
Accessible walking distance to destination can reflect whether it is convenient for residents to walk to destinations, and indirectly reflects the distribution density of destinations. According to the international standard walking speed, the range that adults can reach in 5 minutes is 0.25 miles (about 0.4 kilometer), which shows that neighbourhood has ideal walking accessibility of facilities (Atash,1994; Aultman Hall,1997; Randall T A,2001).
Previous studies have pointed out that mixed use of land is the critical component of high walkability, which link with health, traffic and environment, and convenient for people to access on foot (Frank et al., 2010). The Equilibrium degree value (A11=0.91) indicates a high baseline of mixed land use in the district, which belongs to a high-density residential neighborhood.
Perceived walkability reflects pedestrians' experience of a walking environment, namely, pedestrians' subjective sense of environmental friendliness. Benefitting from the large area of an urban historical park (about 0.05 square kilometers) inside its north side, the historic district had a high ratio of green open space. However, the walkable area outside the park was not desirable, and the engagement of local authorities in the pedestrian environment (P7=0.25) was insufficient. Therefore, the residents' evaluation of streetscape suitability and walking safety (P3 = 2.86, P4 = 2.30) tended to be negative. A large number of street segments with visible landmarks can improve street attractiveness and discrimination. The visibility of landmarks (P5 = 0.58) in the study area was unsatisfactory. Otherwise, as a traditional district with a long history, the baseline level of interaction (P6 = 0.67) is acceptable.