東南極における南極沿岸流の絶対流速場と地形に拘束された循環構造
山崎 開平1,2、青木 茂1、嶋田 啓資3、北出 裕二郎3
1北海道大学 低温科学研究所、2北海道大学 環境科学院、3東京海洋大学
Absolute velocity field of Antarctic Slope Current and topographically constrained gyre-like structures, in East Antarctica.
Kaihe Yamazaki 1, 2, Shigeru Aoki 1, Keishi Shimada 3, Yujiro Kitade 3
1 Institute of Low Temperature Science, Hokkaido University,
2 Graduate School of Environmental Science, Hokkaido University,
3 Tokyo University of Marine Science and Technology.
Antarctic Slope Current (ASC) is a westward current, which exists on the continental slope region around Antarctica. By definition, ASC means a geostrophic flow which results from shoreward Ekman convergence due to easterlies, while the barotropic structure to the depth observed and the westward current is influenced by the geostrophic adjustment related to the plume of downslope Shelf Water at some locations. Establishing a dynamical model of the density front accompanied by the westward current (Antarctic Slope Front: ASF) is substantial to understand the cross shelf-slope exchange processes.
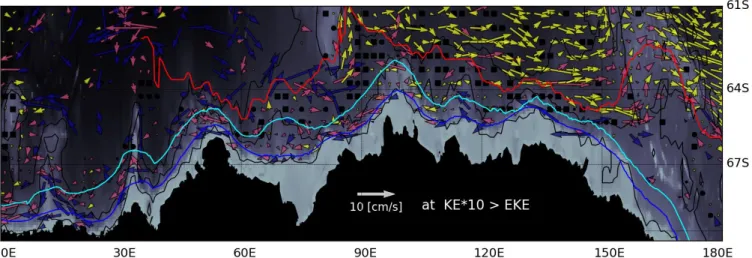
We estimated the mean velocity field of ASC in East Antarctica, using trajectory data of autonomous profiling floats (Argo) over the past decade. Trajectories of floats approximately correspond to the flow at 1000dbar. Averaged velocity vectors were obtained on 2°×0.5° grid points south of 61°S (Fig. 1). For the data in freezing season whose position information are not available (malpositioned data), especially on the continental shelf (Fig. 2), we derived the velocity field with an interpolation procedure using bathymetric data under assumption of potential vorticity conservation. In order to focus on the region where mean flow is significant compared to eddy activity, Fig. 1 shows vectors only for grids where kinetic energy of mean flow (KE) is greater than 10% of eddy kinetic energy (EKE), which is sum of variances of velocity. In EKE calculation, velocity variance was calculated by observed velocity anomaly from the combined (original and interpolated) data. Grids where EKE is 10 times greater than KE are dotted by black in Fig.1.
Estimated positions of the westward current along the continental slope and the eastward current of the Southern Boundary (SB) of Antarctic Circumpolar Current respectively agree with positions of ASF and SB estimated from temperature structure of surface layer (Shimada et al., 2017; Fig. 1). Black dots are obtained between ASF and SB and are distributed approximately along the Antarctic Divergence, which is defined by surface wind stress curl (about 64°S). Moreover, the cyclonic structures are influenced by topography and westward current near the shelf, likely encircling a group of black dots. This result indicates a possibility that detailed cyclonic structures associated with the Antarctic Divergence are localized by topography. Given the proximity of ASF and SB, the localized features above strongly define the cross shelf-slope water mass exchange in this region. In addition, there is no evidence for northward current in 90°E presented by Bindoff et al. (2000), while consistent with the picture by Aoki et al. (2010), which suggests the western limb of cyclonic gyre reaches the Princess Elizabeth Trough.
南極沿岸流は、南極海の陸棚斜面に存在する西向きの海流である。南極沿岸流とは東風による沿岸でのエクマン 収束により生じる地衡流を指す名称だが、順圧的な構造が深層まで及ぶことが確認されており、西向きの流れに は、陸棚水がプルームとして陸棚斜面を下るときの地衡流調節が影響している海域もある。西向き流を伴う密度 フロント(ASF)の力学モデルは、陸棚と沖合の間の水塊交換過程の理解のために不可欠である。
本研究では東南極の南極沿岸流の平均的な流速場を、自動プロファイリングフロートArgoの過去10年以上にわ たる軌跡データを用いて推定した。フロートの軌跡は1000dbarでの流れに対応する。Fig. 1は61°以南における、
位置推定の品質の良いフロートデータ から求めた2°×0.5°の格子点での流速ベクトルの平均場である。ここで、平 均流が渦活動に比べて顕著な領域だけに着目するため、平均流の運動エネルギーの大きさが渦運動エネルギー
(流速の分散の和)の10%以上となる格子点に限ってベクトルを示してある。位置の実測データが少ない陸棚域 で渦運動エネルギーと平均流の運動エネルギーの比を推定するために、冬季海氷下にあるなどしてGPSで位置を 取得できなかったフロートについて、渦位保存を仮定した地形データによる位置の内挿を施した(Fig. 2)。運動 エネルギーは、この地形内挿データを含めた結合データにより計算した。渦運動エネルギーの計算では、流速の
分散を、観測された流速の結合データからの偏差により求めた。渦運動エネルギーが平均流のエネルギーの10倍 以上となった格子点を黒点で示した。
Fig. 1をみると、陸棚斜面の西向き流の位置と南極周極流の南限(SB)の東向き流の位置は、表層の水温構造から
推定されるASFとSBの位置(Shimada et al., 2017)にほぼ一致している。それらの間に位置する黒点は、海面の 風応力場で定義される南極発散線に対応する緯度(64°S付近)におおよそ分布しながらも、詳細には地形による 影響を受けており、陸棚域の西向きの流れが黒点の集まりを取り巻くように流れていることがわかる。これは、
発散線に伴う低気圧性循環が地形によって局在化している可能性を示唆している。ASFとACCが近接しているこ ともあり、これらの局所的な構造が、大陸棚-陸棚斜面の水塊交換を強く規定していることが予想される。ま た、Bindoff et al. (2000)が提案した90°E付近での北上流は、Fig. 1では表れておらず、低気圧性循環の西端が Princes Elizabeth Troughまで達する循環像(Aoki et al., 2010)を裏付けるものである。
Fig. 1. Observed velocity where KE is greater than 10% of EKE (vector) and grid points EKE is significant (black dot). Shape of black dots and color of vectors expresses the number of observed data, respectively, n ≥ 10 (square, yellow), 10 > n ≥ 3 (circle, pink), and n < 3 (small circle, navy). The position of ASF estimated from Shimada et al. (2017) is blue (the center of current) and cyan (its northern limb) contour, and the position of SB is red contour. Bathymetric contours are 1000, 3000, and 4000 m.
Fig. 2. Estimated position for malpositioned data, using bathymetric data. Scatters are colored by estimated zonal velocity.
References
Shimada, K., Aoki, S., Ohshima, K. I., Shimada, K., Aoki, S., & Ohshima, K. I., Creation of a Gridded Dataset for the Southern Ocean with a Topographic Constraint Scheme. Journal of Atmospheric and Oceanic Technology, 34(3), 511–532, 2017.
Bindoff, N. L., Rosenberg, M. A., & Warner, M. J., On the circulation and water masses over the Antarctic continental slope and rise between 80 and 150°E. Deep Sea Research Part II: Topical Studies in Oceanography, 47(12–13), 2299–2326, 2000.
Aoki, S., Sasai, Y., Sasaki, H., Mitsudera, H., & Williams, G. D., The cyclonic circulation in the Australian-Antarctic basin simulated by an eddy-resolving general circulation model. Ocean Dynamics, 60(3), 743–757, 2010.