J-PARC
MLF
ANNUAL
REPORT
A N N U A L
R E P O R T
2
O
1
6
Vol.2: Materials and Life Science
J-PARC 17-07
Research Organization (KEK) and the Japan Atomic Energy Agency (JAEA).
Preface
In 2016, the operation of the Material and Life Science Experimental Facility (MLF) was rather stable, thanks to the dedicated work of all the scientists and engineers involved in the facility. The availability of the scheduled beam time reached over 90 percent. The stable operation was very important for conducting the user programs. However, in 2016, the power of the delivered beam was not as high as in the previous years, because of the following problems. In November 2015, the neutron target vessel (#7) had a water leak as reported in MLF Annual Report 2015. In January 2016, a target vessel (#2) was installed, which has an older design without helium bubbling system. As a resul, the beam power was reduced to 200 kW, and later in the autumn period of 2016 - to 150 kW. In addition, before the sum-mer of 2016, the neutron source had a problem with the helium refrigerator of the cryogenic hydrogen circulation system. We were forced to shut it down for 6 days for helium puriication after a 3-week operation of the beam. The operation of the muon production target, replaced by a target with a rotating design in 2014, continued without a major problem. The scientiic results from the delivered beam of neutrons and muons, as well as the status report of the beamlines, spectrometers and the research environment will be found in this Annual Report. In the coming years, we will make eforts to achieve the beam power of 1 MW, while keeping the operations stable.
Many scientiic and collaborating meetings were held at MLF in 2016. An important one was the European Spallation Source (ESS) - J-PARC collaboration meeting, held at the J-PARC Center on June 1 and 2, 2016. The meeting was carried out under the agreement on cooperation in the ield of spallation neutron related development between ESS and J-PARC. Sixteen delegates from ESS visited the J-PARC Center and we exchanged information about the man-agement of the organization, radiation and general safety issues, accelerator technology, neutron sources, and neu-tron instruments. A complete list of the meetings can be found in this Annual Report.
The education of a new generation and invitation of new users are crucial for the sustainable development and research activities of the facility in the future. The Neutron and Muon School was held from November 22 to 26. Ten host organizations and societies took part in organizing the school. Twenty nine young researchers and graduate stu-dents from Japan, Korea, Australia, Indonesia, India, Hong Kong, Taiwan, and the United Kingdom, participated in the school. They enjoyed nine neutron and four muon lectures, a site tour to J-PARC and JRR-3, hands-experiments with eight neutron beamlines and one muon instrument at MLF, and a science seminar.
I would like to introduce the reader to the research highlights and status reports of MLF in iscal year 2016. A new framework of collaboration may be found in the national projects, such as the Element Strategy Initiative and the Photon and Quantum Basic Research Coordinated Development Program, in addition to the individual research programs.
Materials and Life Science Division, Japan Proton Accelerator Research Complex
http://j-parc.jp/MatLife/en/
Toshiji Kanaya
Preface
CROSS has served as a Registered Institution of speciic neutron beam Facilities of J-PARC, appointed by the Government in 2011. We have been supporting the appropriate user program operations of the Public Beamlines at Materials and Life Science Experimental Facility (MLF). We have also been engaged in facility promotion activities, such as operating a fair and open proposal selection system for the MLF Public Beamlines, providing high-quality user support and promoting facility utilization for both academic and industrial researchers. CROSS increased the number of science coordinators in order to encourage the industrial use and to help the management of the Industrial Users Society for Neutron Application, so, we have three science coordinators in 2016.
CROSS supported the user programs at seven fully-operational Public Beamlines: BL01 4SEASONS, BL02 DNA, BL11 PLANET, BL15 TAIKAN, BL17 SHARAKU, BL18 SENJU and BL22 RADEN. In 2016, we accomplished a stable and highly reli-able machine operation, which reached over 90% of the original operation plan. However, the beam power had to be reduced to 150-200 kW, because we used a spare target vessel, which had no protection from the pitting damage on the beam window.
A special program for new user promotion (NUP) started in 2016 to invite scientists new to the neutron research. NUP has a preferential beam time allocation and provides courteous support to irst-time or novice users from both the industrial and academic sectors. NUP is expected to create a new science by conducting the cooperative research between industrial and academic scientists. The special program of Element Strategy Initiative has also proceeded suc-cessfully this year. Element Strategy Initiative is an integrated strategic research program of the Japanese Government that promotes the development of innovative materials and alternative technologies in the research areas of perma-nent magnets, catalysis and batteries, and electronic and structural materials. Complementary Use is a program that encourages and facilitates the complementary and collaborative use of pulsed neutrons (J-PARC MLF), synchrotron radiation (SPring-8), and supercomputer (K computer).
I hope this Annual Report would serve as a useful information source for anyone wishing to know more about the current status of MLF, its recent scientiic achievements, the technical R&D projects that support the science program, and the operational details of our facility.
On behalf of the team at Neutron Science and Technology Center, CROSS, I extend a warm welcome to all research-ers who wish to use the Public Beamlines at J-PARC MLF.
Neutron Science and Technology Center, Comprehensive Research Organization for Science and Society www.cross-tokai.jp/en
Hideaki Yokomizo
Organization Chart J-PARC Map
Muon and Neutron Instruments
Research and Development Highlights
Reconsidering Partially Ordered States of Ice XV ··· 2
Composite Behavior of Lath-Martensite Steels Induced by Plastic Deformation, a New Paradigm for the Elastic-Plastic Response of Martensitic Steels ··· 5
Crystal Structure and Electrode Performance of Li1.2−xTi0.4Mn0.4O2 ··· 9
Nanometer-Size Efect on Hydrogen Sites in Palladium Lattice ··· 11
Deicient 5 Coordination Li+ in Solvate Ionic Liquid toward Electrolytes for Next Generation Li Batteries ··· 13
Contrast Variation by Dynamic Nuclear Polarization and Time-of-Flight Small-Angle Neutron Scattering ··· 16
A Contrast Variation Study of Nanogels by Small-Angle Neutron Scattering ··· 19
Neutron Brillouin Scattering of Liquid Methanol ··· 21
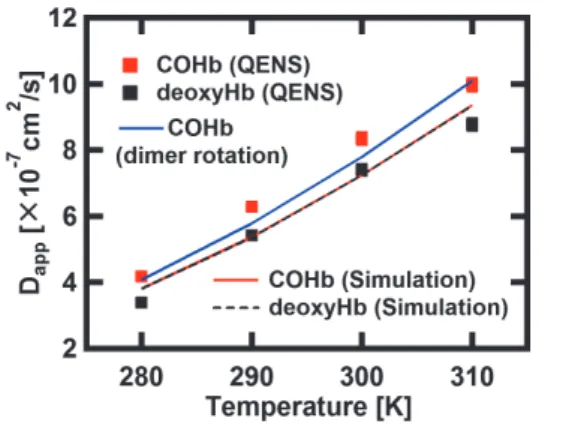
Dynamics Changes of Human Hemoglobin Detected by Quasielastic Neutron Scattering ··· 23
Magnetic Structure and Excitations in La5Mo4O16 ··· 25
Structure of the Magnetic Excitations in the Spin-1/2 Triangular-Lattice Heisenberg Antiferromagnet Ba3CoSb2O9 ··· 27
Rotational Modes and Phonons of CH3NH3PbI3 ··· 30
Development of the Spin-Wave-Like Dispersive Excitations below the Pseudogap Temperature in the High-Temperature Superconductor La2−xSrxCuO4 ··· 33
Spin-Orbital Correlated Dynamics in the Spinel-Type Vanadium Oxide MnV2O4 ··· 35
Crystal Field Excitations on NdFe3(BO3)4 Investigated by Inelastic Neutron Scattering ··· 38
Damped Spin-Wave Excitations in the Itinerant Antiferromagnet g−Fe0.7Mn0.3 ··· 40
Large Magnetovolume Efect Induced by Embedding Ferromagnetic Clusters into Antiferromagnetic Matrix of Cobaltite Perovskite ··· 42
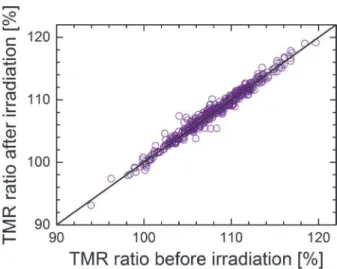
Neutron Tolerance Evaluation of Perpendicular-Anisotropy CoFeB-MgO Magnetic Tunnel Junctions using NOBORU at J-PARC ··· 44
Two-Dimensional Microstructure Visualization in Engineering Materials using Bragg-Edge Imaging ··· 46
Neutron Study on the Nanoscale Structures and Dynamics of Rubber Materials for Tires ··· 49
Hydrogen/Deuterium Dynamics in Kagome Hydroxyl Salts Co2(OH)3Cl/Co2(OD)3Cl ··· 53
Behavior of Hydrogen as Simulated by m+ in Conductive and Functional Cement C12A7 ··· 55
Chemical Environmental Efect on Negative Muon Capture by an Atom Targeted to Gaseous Simple Carbon Oxides: CO, CO2 ··· 57
Metastable Hydrogen Conigurations in the BaTiO3−xHx Oxyhydride Associated with Hydrogen Exchange and Transport ··· 60
The Status of the Cryogenic Hydrogen System ··· 72
Present Status of the Spare Decoupled Moderator Fabrication ··· 74
Progress of the Proton Beam Transport (3NBT)··· 76
Neutron Science
Neutron Science Section ··· 80BL01: 4D-Space Access Neutron Spectrometer 4SEASONS ··· 82
BL02: Current Status of the Broadband micro-eV Quasielastic and Inelastic Neutron Spectrometer DNA ··· 84
BL03: IBARAKI Biological Crystal Difractometer iBIX ··· 86
Measurement of the 133Cs(n,g) Cross-Section Using a New DAQ System at ANNRI ··· 88
Status of Fundamental Physics Beamline BL05 (NOP) 2016 ··· 90
BL06: Commissioning Status of VIllage of Neutron ResOnance Spin Echo Spectrometers (VIN ROSE) ··· 92
Status Report on Super High Resolution Powder Difractometer, SuperHRPD ··· 94
BL09: Current Status of the Special Environment Powder Difractometer, SPICA ··· 96
BL10: NOBORU ··· 98
BL11: in-situ Difraction above 20 GPa with Diamond Anvil Cell ··· 99
HRC and Neutron Brillouin Scattering ··· 101
YUI and HANA: Control and Visualization Programs for HRC ··· 103
BL14 AMATERAS ··· 106
Upgrading TAIKAN ··· 108
Detector Development for the SOFIA Relectometer ··· 109
BL17: Current Status of the Polarized Neutron Relectometer, SHARAKU ··· 111
Status of SENJU 2016 ··· 113
BL19: 2D Detectors Installed to the Back-Scattering Bank of TAKUMI ··· 115
The Current Status of the Versatile Neutron Difractometer, iMATERIA ··· 117
Status of the High Intensity Total Difractometer (BL21, NOVA) ··· 119
Energy-Resolved Neutron Imaging System, BL22: RADEN ··· 120
Recent Progress on the Polarized Neutron Spectrometer POLANO ··· 122
Development of an in-situ Polarized 3He Neutron Spin Filter for POLANO ··· 124
The Current Status of the Computing Environment on POLANO ··· 125
Development of Proton Filter for POLANO ··· 127
Sample Environment at MLF ··· 128
Present Status of IROHA2 ··· 130
A Large Area, Position-Sensitive Scintillation Neutron Detector ··· 132
Recent Developments of Monitoring Systems and Remote Handling Devices for Muon Production Target
at J-PARC MLF MUSE ··· 137
Present Status of D-line ··· 139
The Status of the U-line ··· 141
Experimental Area S1: from Beam Commissioning to Sample Environment and Autorun of ARTEMIS Spectrometer ··· 143
Present Status of the H-line ··· 146
MLF Safety
Research Safety ··· 150MLF Operations in 2016
Beam Operation Status at MLF ··· 154Users at the MLF ··· 155
MLF Proposals Summary – FY2016 ··· 156
MLF Division Staf 2016 ··· 158
CROSS Staf 2016 ··· 161
Proposals Review System, Committees and Meetings ··· 163
Workshops, Conferences, Seminars and Schools in 2016 ··· 168
Award List ··· 171
MLF Publication 2016 ··· 172
Organization Chart
The Role of CROSS
Under the terms of the legislation that supports the Public Neutron Beam Facility, CROSS is entrusted with specific responsibilities. In practical terms, the core functions of CROSS can be summarized as follows:
•
Proposal Selection and Beamtime Allocation on thePublic Beamlines
•
User Support on the Public Beamlines•
Establishment of an Information Resource for Facility Users•
Outreach and Facility Utilization Promotion•
Contract Beamline Assessment and SelectionDirector, J-PARC Center
Organizaon Chart of
J-PARC Center
Deputy Director (JAEA, KEK, Safety)
Safety Division
Accelerator Division
Parcle & Nuclear Physics Division
Organizaon Chart of
CROSS
Cryogenics Secon
Informaon System Secon
Administraon Division
Users Office
Neutron Source Secon
Neutron Science Secon
Neutron Instrumentaon
Secon
Muon Science Secon
Technology Development
Secon
Materials & Life Science Division
Nuclear Transmutaon Division
CROSS Head Office
Research center for Science and Society
Director,
CROSS
Science Coordinators
Safety Division
Administraon Division
Ulizaon Promoon
Division
Neutron R&D Division
President
J-PARC Map
50 GeV Synchrotron
3 GeV Synchrotron HENDEL R&D Building
R245
CROSS
(Ibaraki Quantum Beam Research Center)
Main Gate
R245
J-PARC Center Users Office
Linac KEK Tokai Campus
MLF
on I
nstrumen
ts
MLF Annual R
epor
t 2016
S Line
S Line
U Line
U Line
D Line
D Line
BL22 RADEN
BL22 RADEN
1 m
25 m
1. Introduction
Water freezes below 0°C. This is considered a com-mon fact, but it is valid only in our world at a pressure of 1 atm. The melting temperature of ice drops when pres-sure increases, and reaches its minimum at 0.21 GPa (Fig. 1). This fact was discovered by G. Tammann in 1900 [1], he also found two new high pressure poly-morphs, ice II and III, after observing the melting point and density of ice. Even over 100 years after the after the discovery of the ice polymorphs, the exploration of new polymorphs of ice still continues, leading to the re-cent discovery of ice XVII [2].
Why do the ice structures display such rich variet-ies? One of the reasons could be the order-disorder phenomena of the hydrogen bonds in ices. Even a sin-gle water molecule in an ice structure has four hydro-gen bonds to the adjacent water molecules, yielding 4C2= 6 diferent hydrogen positions and the number of possible configurations will be exponentially in-creased with multiplying the number of molecules. The degree of freedom for these hydrogen conigurations contributes to the rich variety of ice structures, and in fact, most ice polymorphs have disorder-order “pairs” in terms of hydrogen positions. Ice VI-XV, which is one of the “pairs”, is the target of our study.
Ice XV, the ordered form of ice VI, was identiied by Salzmann et al. [3], from their observation of neutron difraction for sample prepared from ice VI by slow cool-ing from 250 to 80 K. Prior to the identiication of ice XV
by Salzmann et al., the phenomena suggesting hydro-gen ordering in ice VI had been reported in a number of studies (see references in [4]). However, as Salzmann et al., noted in their review paper [5], there was an inconsis-tency among the various experiments and calculations for ice XV, i.e., neutron difraction observations suggest-ed antiferroelectrically ordersuggest-ed structures, which dis-agreed with the dielectric measurement and theoretical studies, implying ferroelectrically ordered structures. Here we re-investigate the in-situ neutron difraction measurements and density’s functional theory calcula-tions to revisit the structure and stability of ice XV.
2. Stability of ice XV
In a previous neutron study, detailed structure and stability investigations were carried out on a sample recovered at ambient pressure; they showed that the phase boundary between ice VI and ice XV is about 130 K, regardless of the pressure, because the volume change (ΔV) accompanying the transition was so small
that the phase boundary could be lat in terms of pres-sure based on the Clausius-Clapeyron relation (dT/dP=
ΔV/ΔS). We noted that the entropy change (ΔS) would
also be rather small; it should be less than the Pauling entropy (Rln (3/2) ≅ 3.37 J mol−1 K−1) as the hydrogen ordering is incomplete and occurs only partially.
In our neutron study, the ordering process from ice VI to ice XV was clearly observed as appearing addition-al peaks (e.g., 003) or a c/a axiaddition-al ratio (Fig. 2), and the
Reconsidering Partially Ordered States of Ice XV
Ordered (ref. 3) & Peak broadening (this study)
Ordering
Liquid
Ih II V III VI XV VII VIII Disordering
0.0 0.5 1.0 1.5 2.0 2.5
0 50 100 150 200 250 300 350 T / K
p / GPa
−250 −200 −150 −100 −50 0 50 t / °C
Figure 1. Phase boundary between ice VI and XV, proposed in [4]. The phase boundary of ice VI and XV has a slightly negative slope, which is constrained by the results from our neutron difraction experiments denoted as blue (ordering) and red (disordering) circles.
additional peak intensities or c/a ratio were still being grown after nearly 10 h at a constant temperature of 128 K. The corresponding run at approximately 0.4 GPa shows the disappearing of the additional peaks and a decreasing c/a ratio, displaying a trend toward disor-dering. These observations clearly showed that the phase boundary between ice VI and XV has a slightly negative slope, as shown in Fig. 1.
3. Partially ordered structure of ice XV
A neutron diffraction pattern, which was regis-tered at 80 K and ambient pressure after recovering at 80 K from high pressure, and subsequently annealed at 130 K, was analyzed by the Rietveld reinement. We irst analyzed it through 45 completely ordered struc-ture models derived from ice VI by using graph and group theories, and found that none of the complete-ly ordered conigurations was particularcomplete-ly favored. In other words, several conigurations, for example four conigurations 39-42, shown in Fig. 3, have the lowest R factors with quite similar consistency among the 45 symmetry distinct configurations. Our DFT calcula-tions also support the phenomenon that a particular single completely ordered coniguration is not favor-ably established, but several conigurations may coex-ist at inite temperatures, as our investigations have shown.
Next, we tried to refine the structure based on partially ordered Pmmn model (Fig. 3b), which was
de-rived from the relection conditions and had been al-ready proposed as the hydrogen ordered form of ice VI, called ice VI’, by Kamb more than 40 years ago [6]. The result shows good consistency in the observed data, especially the better it compared to all completely or-dered models. Although we do not insist that the noted consistency shows the Pmmn partial ordered model as the true structure of ice XV, i.e., other possibilities like
Pm21n, P21mn or even lower symmetry could not be excluded from our observations, but we can at least conclude that a completely ordered structure could not be established and the mixture of locally ordered motifs apparently produces the relection conditions. Although the space group Pmmn itself suggests an an-tiferroelectrically ordered state because of the presence of a center of symmetry, this does not mean that the crystal physically possesses antiferroelectricity. Even ferroelectricity may appear due to the locally ordered motifs and its presence does not conlict with the previ-ous dielectric measurement.
4. The issue is still debated
Finally, we should note that the structure of ice XV is still under debate; a more recent neutron difraction study [7] stated that the ice XV structure should be de-rived from a completely ordered structure model. The key issue to recognize, is how we treat the partially or-dered structure model, which may also be related to a more fundamental problem in physics, that is how neutrons located apart can interact coherently. Further experimental and theoretical approaches describing partially ordered structure will be required for a com-plete understanding.
References
[1] G. Tammann, Annaleu der Physik, 2, 1 (1900). [2] L. del Rosso, M. Celli and L. Ulivi, Nature
Communications, 7, 13394 (2016).
[3] C. G. Salzmann, P. G. Radaelli, E. Mayer and J. L.
Figure 3. Structure models of (a) ice VI, (b) ice XV, and (c) four seamlessly adjacent ordered conigurations 39-42 formed without breaking ice rules. Of the 45 sym-metry distinct conigurations, the four conigura-tions shown here have the lowest R factors and the highest phase fractions obtained from Rietveld analysis of the neutron difraction pattern.
P
4
2/
nmc
Pmmn
D2 D1 D2’ D1’ D3 D3’ D4’ D4 D3 D3’ D2 D1 1 D 2D
Finney, Physical Review Letters, 103, 105701 (2009). [4] K. Komatsu, F. Noritake, S. Machida, A. Sano-Furukawa, T. Hattori, R. Yamane and H. Kagi, Scientiic Reports, 6, 28920 (2016).
[5] C. G. Salzmann, P. G. Radaelli, B. Slater and J. L. Finney, Physical Chemistry Chemical Physics, 13, 18468-18480 (2011).
[6] B. Kamb, in Physics and chemistry of ice, edited by E. Whalley, S. J. Jones and L. W. Gold (Royal Society of Canada, Ottawa, 1973), pp. 28-41.
[7] C. G. Salzmann, B. Slater, P. G. Radaelli, J. L. Finney, J. J. Shephard, M. Rosillo-Lopez and J. Hindley, The Journal of Chemical Physics, 145, 204501 (2016).
K. Komatsu1, F. Noritake1,†, S. Machida2, A. Sano-Furukawa3, T. Hattori3, R. Yamane1, and H. Kagi1
1
Geochemical Research Center, Graduate School of Science, The University of Tokyo; 2
CROSS, Research Center for Neutron Science and Technology; 3
J-PARC Center, Japan Atomic Energy Agency; †Present address: Faculty of Engineering, Graduate Faculty of Interdisciplinary
1. Introduction
Lath martensite steels are widely used iron base alloys with outstanding mechanical properties. Their strength is due to phase transformation of fcc structure into lamellar bcc plates during fast cooling. Coherency strains induce large dislocation densities which are the source of the alloy’s strength. Though this alloy has been used since the existence of steel, the way its mi-crostructure functions is still unclariied. High resolution neutron difraction peak proiles revealed that there is a load redistribution between martensitic laths oriented diferently relative to the applied stress direction. Based on characteristically asymmetric neutron diffraction profiles, we showed that the initially homogeneous microstructure becomes heterogeneous during plastic deformation [1-3]. We also showed that lath packets soften when the active Burgers vectors are parallel to the lath planes, but harden when they are not parallel. We found that in lath packets that soften, the annihila-tion distance and the mean free path of active disloca-tions are two orders of magnitude larger than in those which harden. Knowledge of load partitioning during plastic deformation in martensitic steels will open new options for developing iron base structural materials with several improved mechanical properties. Typical martensite steels consists of blocks of lamellar plates, where the blocks are forming packets [4]. The blocks are subdivided into sub-blocks, where the smallest
constituents are lamellar plates called martensite-laths. The hierarchy of packets, blocks, sub-blocks and laths is shown schematically in Fig. 1. Within the packets the crystallographic orientation is the same. The 110 ori-ented lath planes align coherently with one of the 111 type planes of prior austenite. Within the prior austen-ite grain boundary several packets of diferent crystal-lographic orientations can coexist, as shown in Fig. 1a.
2. Experimental
Neutron difraction patterns were collected in-situ during tensile deformation of a martensitic steel speci-men with a small amount of retained austenite at the TAKUMI beamline of the Materials and Life Science Facility of the Japan Proton Accelerator Research Complex, J-PARC [1-3]. The beamline was operated with the high resolution and medium intensity time-of-light (TOF) method. The schematic outline of the TOF difrac-tometer and the specimen geometry is shown in Fig. 2. The instrumental peak width was tuned to 0.3% and the strain rate was 10−5 s−1. The loading direction and the difraction vectors are parallel or perpendicular for the +90° or the −90° detector, i.e. for the 'axial' or the 'side' directions, relative to the applied stress, s. In order to improve the counting statistics the deformation was in-terrupted at 9 consecutive strain values as shown in the stress-strain curve in Fig. 3.
Composite Behavior of Lath-Martensite Steels Induced
by Plastic Deformation, a New Paradigm for the
Elastic-Plastic Response of Martensitic Steels
3. Results and discussion
A typical axial difraction pattern is shown in Fig. 4 for the e= 0.042 tensile deformed state. In the initial state the difraction peaks were perfectly symmetric, whereas they have become asymmetric in the tensile deformed states, as shown for the 200 axial and side diffraction peak profiles in Fig. 5. The figure shows that the asymmetries of the axial and side case peaks are in opposite direction. The difraction patterns were evaluated by the Convolutional-Multiple-Whole-Proile (CMWP) itting procedure based on physically modelled proile functions for dislocations, crystallite size and planar defects [5]. The CMWP itting was performed for all difraction peaks from 110 to 330 simultaneously, as shown in Fig. 4. The asymmetric proiles were handled by the sum of two dislocation proile functions shifted to smaller or larger K values around the center of gravity of the measured peaks, where K is the reciprocal space coordinate. The shifts, Dd* =DK, are evaluated in terms
of residual internal stresses, Ds, corresponding to the forward and backward stresses acting in the hard-ori-entation (HO) or soft-orihard-ori-entation (SO) packets, respec-tively. The two shifted dislocation proile functions were evaluated for the dislocation densities in the HO and SO packet components and the results are shown in Fig. 6a as a function of strain.
The average low stress, sav or tav, and the local low stress values acting in the HO and SO packets, sHO or tHO and sSO or tSO, were calculated by the Taylor equation:
si=s0+aGMTb√ρi , ti=t0+aGb√ρi , (1)
where i stands for, HO or SO, a is a free parameter usu-ally between zero and unity, G is the shear modulus, b is the absolute value of the Burgers vector of disloca-tions and ρi is the total average dislocation density or the local average dislocation density in the hard or soft packets, respectively. The low stress values, si, calcu-lated by equation (1) are shown in Fig. 6b. vs. the mea-sured applied stress, sapplied. The schematic microscopic model of stress redistribution is based on the compos-ite model [6, 7] and is shown in Fig. 7. After unloading forward and backward residual stresses will remain in the HO and SO packets respectively. Stress and strain compatibility between the SO and HO packets is guar-anteed by the geometrically necessary dislocations (GNDs) lined up along the interfaces of the diferently oriented packets shown schematically in Fig. 7a. The forward and backward local residual stresses are shown schematically in Fig. 7b. During loading the weighted spatial average of the local stresses are adding up for the applied stress:
Figure 3. Stress-strain curve with step by step loading fol-lowed by unloading at several strain values to im-prove counting statistics.
Figure 4. Typical difraction pattern of observed (black-cir-cles) and CMWP evaluated (red line) neutron dif-fraction patterns for ε = 0.042 tensiled state.
Figure 5. (a) The CMWP calculated sub-proiles corresponding to the HO (dark green line) and the SO (blue line) packets in the axial direction, along with the measured data (open circles) and the CMWP calculated total proile (red line). The center of gravity of the measured proile and the positions of the sub-peaks are indicated as dotted, dashed and dash-dot lines, respectively. (b) The measured (open circle), the CMWP calculated total proile (red line) and the CMWP calculated sub-proiles corresponding to the HO (dark green line) and the SO (blue line) packets in the side direction.
Figure 6. (a) Dislocation densities in the HO (red symbols) and the SO packets (blue symbols), and the volume fraction weighted average dislocation densities (black symbols). (b) Local stresses in the HO (red symbols) and the SO packets (blue symbols) calculated from the dislocation densities according to Taylor's equation.
tapplied=fHOtHO+ (1 −fHO)tSO . (2)
After unloading the residual internal stresses in the HO and SO packets are:
DtHO=tHO−tapplied , DtSO=tSO−tapplied ,
where fHODtHO+ (1 −fHO)DtSO= 0. (3)
During plastic deformation the backward stresses in the SO and the forward stresses in the HO packets hamper and assist dislocation motion in such a manner that the entire material lows simultaneously. The back-ward and forback-ward stresses ensure that macroscopic low takes place irrespective of the packet being soft or hard. The experiments in [1-3] proved the existence of the long range internal stresses between the softened and hardened lath packets and indicate the evolution of load redistribution between the diferently oriented packets in lath martensite.
4. Future plans
The recognition of load redistribution in low-alloy high-strength ferritic steels opens new perspectives to
develop new ferritic steel base structural materials for various applications. The beamline TAKUMI will be used to reveal the mechanical elastic-plastic response along with the load partitioning microstructure in many dif-ferent ferritic steels for developing new high perfor-mance structural materials.
References
[1] T. Ungár, S. Harjo, T. Kawasaki, Y. Tomota, G. Ribárik, Z. Shi, Met. Mat. Transact., A48, 159-167 (2017). [2] S. Harjo, T. Kawasaki, Y. Tomota, W. Gong, K. Aizawa,
G. Tichy, T. Ungár, Met. Mat. Transact., A48, 4080-4092 (2017).
[3] Y. Wang, T. Ohnuki, Y. Tomota, S. Harjo, T. Ohmura, Scripta Mater., 140 45-49 (2017).
[4] H. Kitahara, R. Ueji, N. Tsuji, Y. Minamino, Acta Mater. 54, 1279-1288 (2006).
[5] G. Ribárik, T. Ungár, Mater. Sci. Eng. A528, 112-121 (2010).
[6] T. Ungár, H. Mughrabi, D. Rönnpagel, M. Wilkens,
Acta Metall. 32, 333-342 (1984).
[7] H. Mughrabi, T. Ungár, W. Kienle, M. Wilkens, Philos. Mag. A53, 793-813 (1986).
T. Ungár1, S. Harjo2, T. Kawasaki2, Y. Tomota3, G. Ribárik4, and Z. Shi5
1
Materials Performance Centre, School of Materials, The University of Manchester, Manchester, M13 9PL, UK; 2
J-PARC Center, Japan Atomic Energy Agency; 3
National Institute for Materials Science, 1-2-1 Sengen, Tsukuba, Ibaraki, 305-0047, Japan; 4
Department of Materials Physics, Eötvös University, Budapest, PO Box 32, H-1518, Hungary; 5
1. Introduction
During the past two decades, the technology of rechargeable lithium-ion batteries (LIBs) has become highly sophisticated and contributed to the develop-ment of today’s convenient modern society with ver-satile portable electronic devices. However, due to the ever-increasing demand for energy density, there is a need to develop positive electrode materials with higher energy density. The energy density of com-mercial LIBs is currently limited by positive electrode materials. Lithium-excess positive electrode materials such as Li2MnO3 and their derivatives have been stud-ied extensively in the past decade. In this system, the oxidation state of manganese ions is tetravalent, and therefore further oxidation of manganese ions is dii-cult on charge. Instead, oxide ions as anions contribute in the charge compensation process. However, oxida-tion of oxide ions for Li2MnO3-based electrode materi-als causes oxygen loss as an irreversible process [1].
To use efectively the charge compensation of oxide ions, several lithium-excess positive electrode materials have been reported. Recently, our group successfully synthesized new niobium- and titanium-based high-capacity positive electrode materials, which use efec-tively the solid-state redox reaction of oxide ions [2, 3]. In this study, a detailed crystal structure of a binary system of Li2TiO3-LiMnO2 is examined by neutron dif-fraction, and possibility of reversible solid-state redox of oxide ions for the high-capacity positive electrode materials is discussed.
2. Crystal structure of Li1.2Ti0.4Mn0.4O2
A binary system of Li2TiO3-LiMnO2 has been sys-tematically examined as electrode materials. Both end-members, Li2TiO3 and LiMnO2, crystallize into diferent cation-ordered rocksalt-type structures. Li2TiO3 is ex-pected to be a high capacity electrode material with an-ion redox if all lithium an-ions are reversibly extracted from the host structure. However, Li2TiO3 has no d electrons in a conduction band, leading to an insulating character as electrode materials. Therefore, pure Li2TiO3 is electro-chemically inactive. Substitution of 3d transition metal ions for Ti/Li ions efectively induces conductive elec-trons, and color of samples is also changed from white for Li2TiO3 to black for substituted samples with Mn3+. Such 3d transition metals can accept electrons from ox-ide ions. However, a change in the crystal structure is also unavoidable, and formation of a cation-disordered rocksalt-type structure is noted. A neutron difraction pattern of the sample with the one to one composition between Li2TiO3 and LiMnO2, which is reformulated as Li1.2Ti0.4Mn0.4O2, is shown in Fig. 1. The neutron dif-fraction pattern was collected at BL09 (SPICA) in MLF. Rietveld analysis of the neutron difraction pattern re-vealed that the sample contains 1% vacancy at 4a site (cation sites). Moreover, no evidence is found for the formation of oxygen vacancy.
3. Electrode performance of Li1.2Ti0.4Mn0.4O2
Historically, such cation-disordered rocksalt phase had been regarded as electrochemically inactive as electrode materials because of a lack of the Li migration
Crystal Structure and Electrode Performance of
Li
1.2−
x
Ti
0.4
Mn
0.4
O
2
Li, Mn, and Ti
O
s.g. Fm-3m, a = 4.1567 Å
12.0 10.0
8.0 6.0
4.0 2.0
q / Å−1
path in a bulk structure. Nevertheless, formation of per-colating network for the Li-excess system (Li1+xMe1−xO2) opens the path for Li migration in the cation-disordered rocksalt-type structure [4].
Li1.2Ti0.4Mn0.4O2 was mixed with 10 wt% acetylene black and ball milled to enhance the electrode perfor-mance. Thus prepared sample shows a large reversible capacity in a Li cell, as shown in Fig. 2, and the sample delivers more than 300 mAh g−1 at 50°C. Available en-ergy density of Li1.2−xTi0.4Mn0.4O2 exceeds 1,000 mWh g−1 as a positive electrode material. Moreover, capacity re-tention is much better than that of pure Li2MnO3.
To examine whether oxide ions are oxidized and stabilized in Li1.2−xTi0.4Mn0.4O2, reaction mechanisms were examined by soft X-ray absorption spectroscopy. A study by soft X-ray absorption spectroscopy revealed that, on the initial charge, Mn3+ is oxidized to Mn4+ for the slope region to 4 V, and oxide ions are oxidized at
the plateau region around 4.2 V. Moreover, this process is highly reversible. Solid-state redox reaction of oxide ions is efectively stabilized by the presence of relatively less covalent character of Mn4+ with oxide ions without the sacriice of electronic conductivity [3]. This inding opens a path to develop a new series of high-capacity positive electrode materials on the basis of oxide ion re-dox for rechargeable high-energy battery applications.
4. Summary
The use of solid-state redox reaction of oxide ions is an efective strategy to further increase energy density of rechargeable lithium batteries. We have demonstrat-ed that the stabilization of rdemonstrat-edox reaction for oxide ions is possible using a combination of only 3d transition metals as the metallic constituents. Now, we are not restricted any more by the conventional and classical concept of transition metal redox, which totally limited the materials design and theoretical capacity of positive electrode materials as used in the past three decades. We expect that many new positive electrode materials with high capacity will appear, such as Li1.2Ti0.4Mn0.4O2.
References
[1] N. Yabuuchi, Chemistry Letters 46 (2017) 412. [2] N. Yabuuchi, M. Takeuchi, M. Nakayama, H. Shiiba,
M. Ogawa, K. Nakayama, T. Ohta, D. Endo, T. Ozaki, T. Inamasu, K. Sato and S. Komaba, PNAS 112 (2015) 7650. [3] N. Yabuuchi, M. Nakayama, M. Takeuchi, S. Komaba, Y.
Hashimoto, T. Mukai, H. Shiiba, K. Sato, Y. Kobayashi, A. Nakao, M. Yonemura, K. Yamanaka, K. Mitsuhara and T. Ohta, Nature Communications 7 (2016) 13814. [4] J. Lee, A. Urban, X. Li, D. Su, G. Hautier, G. Ceder,
Science 343 (2014) 519.
N. Yabuuchi1 and M. Yonemura2,3
1
Department of Applied Chemistry, Tokyo Denki University; 2
Institute of Materials Structure Science (IMSS), High Energy Accelerator Research Organization (KEK); 3
Department of Materials Structure Science, Sokendai (The Graduate University for Advanced Studies) Table 1. Results of Rietveld analysis on the neutron difraction pattern of Li1.2Ti0.4Mn0.4O2. The itting result is shown in Fig. 1.
Figure 2. Charge/discharge curves of Li1.2Ti0.4Mn0.4O2 in a Li
cell at a rate of 5 mA g−1 at 50°C.
0 50 100 150 200 250 300 350 400 0.0
1.0 2.0 3.0 4.0 5.0 6.0
2nd
Voltage / V
Capacity / mAh g−1
1st
3rd
1st
3rd
1. Introduction
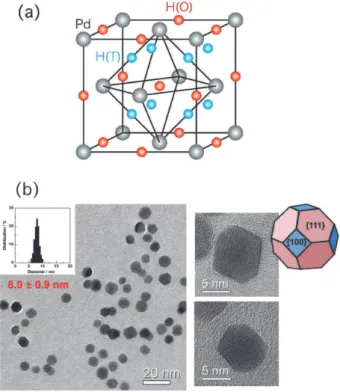
Palladium hydride (PdHx, 0 <x< 1) is the best known classical metal hydride, which has been investigated by many physicists and chemists. It has been remarked also from industrial points of view, e.g., hydrogen stor-age, ilters, sensors, catalysts, etc. In the hydrogen ad-sorption process, a hydrogen molecule (H2) dissociates into two hydrogen atoms (2H), and the H atoms occupy the interstitial sites of the Pd lattice. In the H concen-tration region higher than x= 0.6, the hydride crystal takes the β phase with an fcc (NaCl-type) structure as shown in Fig. 1(a). In the β phase, it is known that the H atoms are located only at the octahedral (O) sites (1/2, 1/2, 1/2) at ambient temperature and H2 pressure [1]. In other transition metals with the fcc lattice, H atoms also preferentially occupy the O sites. In high-temperature or high-pressure conditions, however, the tetrahedral (T) sites (1/4, 1/4, 1/4) are partially occupied, for exam-ple in PdDx [2] and fcc-FeDx [3].
The physical and chemical properties of nanome-ter-sized materials are of interest, since they are often diferent from the bulk properties. As for the nanopar-ticles of palladium hydrides, there are drastic changes of the H2 pressure-composition phase diagram [4] and heat capacity [5]. To understand the characteristic prop-erties of PdH nanoparticles from microscopic point of view, it is irst necessary to investigate their structure, including the location of hydrogen atoms. In this work, therefore, we have performed in situ neutron powder
difraction (NPD) experiments [6] for high-quality Pd nanoparticles, as shown in Fig. 1(b). The nanoparticles have a well-deined shape of an edge-cut octahedron with diameter of 8.0 ± 0.9 nm. The nanoparticles are covered with a protective polymer polyvinylpyrrol-idone (PVP) to avoid adhesion between the nanopar-ticles. The NPD measurements were performed using a high-intensity total difractometer (NOVA) installed at J-PARC.
2. Results and discussion
Figure 2 shows the neutron diffraction pattern of PdD0.363 nanoparticles measured at 300 K under 0.11 MPa of D2 gas. The amount of the D atoms ab-sorbed into Pd nanoparticles was precisely determined by the hydrogen gas control system installed on NOVA. The data shown in Fig. 2 were obtained after subtract-ing the large contribution of the incoherent scattersubtract-ing from PVP. This is the irst neutron difraction data for nanoparticles of metal hydrides.
The crystal structure of PdD0.363 has been reined by the Rietveld analysis using the Z-Rietveld software [7]. We have examined the following structural models: (model 1) the O sites are occupied by the D atoms ho-mogeneously; (model 2) the O sites in the shell part (a few layers near the surface) are occupied; (model 3) both the O and T sites are occupied homogeneously; (model 4) the O and T sites in the shell part and the O sites in the core part are occupied. In models 2 and 4, the hypothetical phase separation between the shell and core part was assumed to incorporate the sur-face efect of the nanoparticles. The best it result was obtained with model 4. The obtained itting param-eters are as follows: lattice constants of the shell and core parts a(shell) = 4.0177(4) Å, a(core) = 4.0027(2) Å,
Pd atomic fraction of the shell part fS = 0.24 (fixed),
Nanometer-Size Efect on Hydrogen Sites in Palladium
Lattice
isotropic atomic displacements BPd= 0.280(5) Å2, BD(O)= 1.99(6) Å2, B
D(T)= 14.1(5) Å2, occupancies of the O and T sites gD(O)(shell) =gD(O)(core) = 0.251(2) and gD(T)(shell) = 0.234(3) under the constraints gD(O)(shell) =gD(O)(core), x = (1 −fS) gD(O)(core) +fS[gD(O)(shell) + 2gD(T)(shell)] = 0.363. Our Rietveld analysis revealed that 30% of the D atoms are located at the T sites and 70% at the O sites in the Pd nanoparticles. This contrasts with the result that only the O sites are occupied in bulk PdDx. We guess that the T site occupation can be due to the change in potential energy caused by the surface and/or distor-tion efects of the nanoparticles. The T site occupadistor-tion is associated with the drastic changes in the difusional
and vibrational motions of the H atoms in Pd nanopar-ticles revealed in our recent quasielastic [8] and inelas-tic [9] neutron scattering investigations. Furthermore, the present work will become a foundation for future research in the nanoparticles of other metal and alloy hydrides.
3. Acknowledgments
The experiment in the MLF at J-PARC was performed with the approval of J-PARC (Proposal No. 2012B0246, 2014A0228). This work is financially supported by CREST, Japan Science and Technology Agency.
References
[1] H. E. Worsham, M. K. Wilkinson and C. G. Shull, J. Phys. Chem. Solids 3, 303-310 (1957).
[2] K. G. Mclennan, E. M. Gray and J. F. Dobson, Phys. Rev. B 78, 014104 (2008).
[3] A. Machida, H. Saitoh, H. Sugimoto, T. Hattori, A. Sano-Furukawa, N. Endo, Y. Katayama, R. Iizuka, T. Sato, M. Matsuo, S. Orimo and K. Aoki, Nat. Commun. 5, 5063 (2014).
[4] M. Yamauchi, R. Ikeda, H. Kitagawa and M. Takata, J. Phys. Chem. C 112, 3294-3299 (2008).
[5] H. Akiba, H. Kobayashi, H. Kitagawa, M. Kofu and O. Yamamuro, Phys. Rev. B 92, 064202 (2015).
[6] H. Akiba, M. Kofu, H. Kobayashi, H. Kitagawa, K. Ikeda, T. Otomo and O. Yamamuro, J. Am. Chem. Soc. 138, 10238-10243 (2016).
[7] R. Oishi, M. Yonemura, Y. Nishimaki, S. Torii, A. Hoshikawa, T. Ishigaki, T. Morishima, K. Mori and T. Kamiyama, Nucl. Instrum. Methods Phys. Res. Sect. A 600, 94-96 (2009).
[8] M. Kofu, N. Hashimoto, H. Akiba, H. Kobayashi, H. Kitagawa, M. Tyagi, A. Faraone, J. R. D. Copley, W Lohstroh and O. Yamamuro, Phys. Rev. B 94, 064303 (2016).
[9] M. Kofu, N. Hashimoto, H. Akiba, H. Kobayashi, H. Kitagawa, K. Iida, M. Nakamura and O. Yamamuro, Phys. Rev. B 96, 054304 (2017).
H. Akiba1, M. Kofu1, H. Kobayashi2, H. Kitagawa2, K. Ikeda3,4, T. Otomo3,4, and O. Yamamuro1
1
Institute for Solid State Physics, University of Tokyo; 2
Department of Chemistry, Graduate School of Science, Kyoto University; 3
Institute of Particle and Nuclear Studies, KEK; 4
Neutron Science Section, Materials and Life Science Division, J-PARC Center Figure 2. Observed (black crosses) and calculated (red curves)
difraction patterns of the nanoparticles of PdD0.363
at 300 K. The Rietveld analyses were performed as-suming structural models 1-4 shown schematically in the insets. The gray circles represent the Pd at-oms, and the red and blue circles show the D atoms at the O and T sites, respectively.
12 10
8 6
4
Rwp= 7.8% Rwp= 8.1%
Rwp= 10.8%
Rwp= 14.2%
I(Q)
/ arb. unit
(b)
(c)
(d)
S= 2.09
D(O)
D(T)
S= 1.59
S= 1.20
S= 1.15
model 1
model 2
model 3
model 4
(a)
1. Introduction
Solvate ionic liquids (SIL) are a new category of room-temperature ionic liquids [1] that have novel ap-plications as electrolytes in the next generation lithium secondary batteries. Watanabe and Dokko et al. dem-onstrated that SILs composed of an equimolar mixture of LiTFSA salt (TFSA: bis-(trifluoromethanesulfonyl) amide) and oligo-ether glymes such as triglyme (G3: CH3O–(CH2CH2O)3–CH3) and tetraglyme (G4: CH3O– (CH2CH2O)4–CH3), can be utilized as electrolytes for Li secondary batteries [2], particularly Li-sulfur ones, due to the rather small solubility of the electrode active species lithium polysulfide Li2Sn [3]. In addition, the electrode reactions and the Li2Sn solubility should be
governed by the liquid structure and/or the Li+ local
structure, because it is crucial to maintain the glyme
solvate complex of Li+ [Li(glyme)]+ structure [4].
Recently, the molecular level properties of the SILs have been probed using the NMR difusion coeicients, Raman spectra analysis, and theoretical calculations, such as ab initio molecular orbital calculations and molecular dynamics simulations. These studies clari-ied that the Li+ was coordinated with almost all of the glyme to form [Li(glyme)]+ in the SIL.
Quite recently, the Atkin’s group performed neu-tron scattering experiments with empirical potential and structure reinement (EPSR) analysis to elucidate the bulk nanostructure of various solvate ionic liquids like [Li(G4)][TFSA] and [Li(G4)][NO3] [5]. However, the Li+ local structure in the SILs is still needed from an ex-perimental perspective as this structure is critical for the Li+ ionic conduction mechanism in the bulk and the reduction/oxidization mechanisms at the SIL electro-lyte/electrode interface. For that purpose, neutron scat-tering experiments with the 6/7Li isotopic substitution technique are one of the most powerful tools and have successfully revealed Li+ solvation structures in aque-ous and non-aqueaque-ous solvent solutions.
Here, the Li+ local structure in [Li(G4)][TFSA] SIL is determined using neutron total scattering experiments with the 6/7Li isotopic substitution technique. We found the unique deicient 5 coordination structure of Li+ in the SIL.
2. Experimental
The sample solution was introduced into a
thwalled cylindrical V-Ni null alloy cell (6.0 mm in in-ner diameter and 0.1 mm in wall thickness) and sealed by an indium seal. Neutron scattering measurements were carried out at 25°C using the NOVA total scattering spec-trometer installed at BL21 of the MLF pulsed neutron source in J-PARC, Tokai, Japan. The incident beam power of the proton accelerator was 300 kW. Scattered neutrons (neutron wave band of 0.1 ≤ λ ≤ 8.7 Å) were detected by ca. 900 of 20 atm 3He position sensitive proportional counters (1/2 inch f, 800 mm in active length with 5 mm in positional resolution) installed at 20°(13.1° – 27.9°), 45°(33.6° – 54.9°), 90°(72.7° – 107.4°) and back scattering (136.5° – 169.0°) detector banks. The data accumulation time was ca. 6 h for each sample. Measurements were made in advance for a 6 mm in diameter vanadium rod, empty cell and instrumental background. The observed scattering intensities for the sample were corrected for instrumental background, absorption of sample and cell, multiple and incoherent scatterings. The wavelength de-pendence of the total cross sections for H nucleus was estimated from the observed total cross sections for H2O. Since the attenuation coeicients calculated for the absorption correction exhibit signiicant neutron wave-length (λ) dependence for the sample with large absorp-tion cross secabsorp-tion, the attenuaabsorp-tion coeicients, As,sc(2q, λ) and Ac,sc(2q, λ), were successfully approximated by itting them in the form of exponential of the 7th polynomial of λ by the following equation,
A(2q, λ) = exp(Saiλi−1). (1)
The first-order difference function, DLi(Q), (Q = 4πsinq/λ is a scattering vector, where q and λ are the scattering angle and neutron wave length, respective-ly) is derived from the numerical diference between scattering cross sections observed for two solutions that are identical compositions except for the scatter-ing length of Li. The DLi(Q) normalized for stoichiometric units, (LiTFSA)x(G4)1−x can be written as linear combina-tion of partial structure factors, aLij(Q), involving correla-tions form the Li - j pair:
DLi(Q) =A[aLiO(Q) − 1] +B[aLiC(Q) − 1] +C[aLiH(Q) − 1] +D[aLiF(Q) − 1] +E[aLiS(Q) − 1] +F[aLiN(Q) − 1]
+G[aLiLi(Q) − 1] (2)
Deicient 5 Coordination Li
+
in Solvate Ionic Liquid
where, A= 2x(5 −x)(b6Li−bnatLi)bO, B= 4x(5 − 4x)(b6Li −bnatLi)bC, C= 44x(1 −x)(b6Li−bnatLi)bH, D= 12x2(b6Li−
bnatLi)bF, E= 4x2(b6Li−bnatLi)bS, F= 2x2(b6Li−bnatLi)bN, and
G=x2(b26Li−b2natLi). Since the observed DLi(Q) from
for-ward angle detector pixels located at 13.1 ≤ 2q≤ 27.9°
agree well within the statistical uncertainties, they were
combined at the Q-interval of 0.1 Å−1 and used for
sub-sequent analyses.
The distribution function around Li+, GLi(r), was
de-duced from the Fourier transform of DLi(Q):
GLi(r) = 1 + (A+B+C+D+E+F+G)−1(2π2ρ
0r)−1
∫QDLi(Q) sin(Qr) dQ
= [AgLiO(r) +BgLiC(r) +CgLiH(r) +DgLiF(r) +EgLiS(r)
+FgLiN(r) +GgLiLi(r)] × (A+B+C+D+E+F
+G)−1 (3)
The upper limit of the integral was set to 20 Å-1 in
the present study.
3. Results and discussion
The interference functions i(Q) were successfully
obtained in the 0 < Q/Å−1< 26 range for sample solutions
of [*Li(G4)][TFSA] (* stands for both 6Li enriched and
natural abundance) solvate ionic liquids. Consequently,
DLi(Q) was also adequately determined in the 0 <Q/Å−1<
20 range. The radial distribution function GLi(r) obtained
by Fourier transformation of the DLi(Q) is shown in
Fig. 1. The irst and the second peaks of GLi(r) can be
as-signed to the positions of atoms close to the Li+ cations.
Such close neighbors can be unambiguously found at about 2 and 3 Å, respectively. It should be noted that the broad valley found in the GLi(r) at around 3.5 Å can be ascribed to the solvated G4 hydrogen atoms of the negative neutron scattering length. The presence of the valley in the GLi(r) suggests that most of the Li+ in the SIL is solvated by G4 molecules, which is consistent with the previous NMR and Raman studies.
We performed a quantitative analysis of the neu-tron scattering data based on a local structure model. In the case of the G4 molecule, 5 oxygen atoms can poten-tially coordinate to the Li+ ion (although in solution the Li+ prefers a 4-atom coordinated structure). Therefore, the itting parameters considered here were the Li+ – G4 coordination number, the Li+–O bond lengths, their thermal factors, the Li+–O–C bond angles, also twelve signiicant torsion angles along the backbone of the G4 molecule. The GLi(r), calculated based on the obtained structural parameters of the model structure, is shown in Fig. 1 as a solid line. As shown in the igure, the model agrees with the experimental results. An atomistic de-piction of the model structure is shown in Fig. 1.
In the least squared model structure, the Li+ is co-ordinated by ive oxygen atoms in G4 that have their own characteristic distances, 2.06, 2.09, 2.13, 1.93 and 2.24 Å, respectively. Clearly, 2.24 Å is signiicantly larger than the others. The average distance of 2.05 Å, except the longest one, is still signiicantly larger than the val-ues of 1.95 – 1.97 Å usually found in aqueous solutions. However, the distances are similar to the values for cy-clic and acycy-clic carbonates (2.04 – 2.08 Å) and for the polyethyleneoxide solutions (2.07 – 2.1 Å). According to Shannon and Bondi, the ionic radius for the 4-coordi-nated Li+ and van der Waals radius for the oxygen atom are 0.59 and 1.52 Å, respectively. The sum of these two values, 2.11 Å, is close to the Li+ – O average distance of 2.05 Å. On the other hand, the 2.24 Å distance is consid-erably larger than 2.11 Å.
To obtain further insights, classic MD simulations were performed. Figure 2 compares the MD-derived
GLi(r) with that from the experiments. This igure reveals good agreement between them. In the MD simula-tions, the Li+ is on average a 5-coordinated structure: 4 oxygen atoms from the G4 molecule and 1 from the TFSA anion, respectively. Figure 3 shows pair correla-tion funccorrela-tions g(r) and their integral curves N(r) for the
Li+ – O (G4) in the simulated [Li(G4)][TFSA] SIL. As shown in the igure, the irst peak in g(r) for the central oxygen atom in G4 is the shortest and sharpest, which suggests that the central oxygen inertly coordinates to the Li+. As
Figure 1. The partial radial distribution functions GLi(r) for the
the oxygen atoms locate closer to the terminal, the irst peaks in g(r) shift further with broadening. The small-est coordination number of about 1.4 for the terminal oxygen atoms with the longest position and the broad-est width is consistent with the present neutron experi-ments. This means that on average one of the terminal oxygen atoms in the G4 is not fully coordinated to the Li+, which supports the longer 2.24 Å distance predict-ed by the model. Our MD simulations suggestpredict-ed that the terminal oxygen atoms never fully coordinate to the Li+ but rather undergo successive coordination/uncoor-dination stages.
4. Future
Here, we demonstrated that the neutron scattering with the 6/7Li isotopic substitution technique evident-ly reveals the Li+ local structure in much complicated solution systems as the SIL for the next generation Li secondary batteries. To build electrochemical devices, including Li batteries with much higher performance, innovative electrolytes, which have new ionic conduc-tion mechanisms and/or redox reacconduc-tions at the elec-trode/electrolyte interface, are being discovered one
after another. It is expected that the neutron scattering techniques will strongly support further development of science and technology in this ield.
References
[1] C. A. Angell, Y. Ansaria, Z. Zhaoa, Faraday Discuss,154, 9-27, (2012).
[2] T. Tamura, T. Hachida, K. Yoshida, N. Tachikawa, K. Dokko, M. Watanabe, J. Power Sources, 195, 6095-6100, (2010).
[3] K. Dokko, N. Tachikawa, K. Yamauchi, M. Tsuchiya, A. Yamazaki, E. Takashima, J-W. Park, K. Ueno, S. Seki, N. Serizawa, M. Watanabe, J. Electrochem. Soc. 160, A1304-A1310, (2013).
[4] K. Ueno, R. Tatara, S. Tsuzuki, S. Saito, H. Doi, K. Yoshida, T. Mandai, M. Matsugami, Y. Umebayashi, K. Dokko, M. Watanabe, Phys. Chem. Chem. Phys. 17, 8248-8257, (2015).
[5] T. Murphy, S. K. Callear, N. Yepuri, K. Shimizu, M. Watanabe, J. N. C. Lopes, T. Darwish, G. G. Warr, R. Atkin, Phys. Chem. Chem. Phys. 18, 17224-17236, (2016).
Y. Umebayashi1, H. Watanabe1, S. Saito1, K. Dokko2, M. Watanabe2, and Y. Kameda3
1
Graduate School of Science and Technology, Niigata University; 2
Department of Chemistry and Biotechnology, Yokohama National University; 3
Department of Material and Biological Chemistry, Faculty of Science, Yamagata University
Figure 3. The pair correlation functions and its integral curves for the Li+ - O (G4) in the solvate ionic liquid [Li(G4)]
[TFSA].
Figure 2. The partial radial distribution functions GLi(r) for the
1. Introduction
Contrast variation for small-angle neutron scatter-ing (SANS) is a very useful technique in investigatscatter-ing multi-component systems. For contrast variation stud-ies, deuterium substitution has been conventionally used, which takes advantage of the diference in the neutron scattering length between protons and deu-terons. The deuterium substitution technique can be easily applied to solutions or gels, due to reasonable availability of deuterated solvent, whereas the synthe-sis of deuterated polymer is costlier and requires sig-niicant eforts. Hence, alternative methods are needed. Besides deuterium substitution, contrast variation can also be achieved by controlling both spin states of neutrons and protons. The coherent scattering length (bcoh,H) of a proton against a fully polarized neutron are given by the following equation [1]:
bcoh,H= (−0.374 + 1.456 PH) × 10−12 [cm] (1) where PH denotes the proton spin polarization. Polarization means the diference in populations be-tween up and down spins. Figure 1 shows the PH de-pendence of bcoh,H. Note that the variation of bcoh,H is about 2.5 times larger than the one caused only by deuterium substitution. As for PH = 0, the coherent scat-tering length of hydrogen is −0.374 × 10⁻¹² cm, whereas that for a deuteron is 0.667 × 10⁻¹² cm.
At room temperature, up and down proton spins are almost equally populated. With decreasing tem-perature and increasing magnetic ield, the proton spin polarization increases. However, even at 3.3 Tesla and 1.2 K, the proton spin is polarized up to only 0.3%. In contrast, the electron spin is largely polarized up to 95% under the same conditions (at 3.3 Tesla and 1.2 K). This is because of a large diference in the gyromagnetic ratio
between the electron spin and the proton spin (|γe|/γH= 658). The large polarization of an electron spin can be transferred to the proton spins by microwave irradia-tion with energy equal to the simultaneous lipping of electron and proton spins. Consequently, high proton spin polarization is achieved. This is called dynamic nu-clear polarization (DNP) and requires electron spin dop-ing, magnetic ield, low temperature, and microwave irradiation.
A stable organic free radical, TEMPO [(2,2,6,6- tetramethylpiperidine-1-yl)oxy] can be used as an elec-tron spin source. TEMPO is sublimable around room temperature. Vaporized TEMPO permeates spontane-ously the rubbery phase of solid polymer samples (Fig. 2). Based on this vapor sorption technique, we prepared polymer systems for SANS studies after the construction of a DNP cryostat [2] and polarized neutron ultra-small-angle scattering spectrometer (SANS-J-II) [3] at research reactor JRR-3, Tokai, Japan. We investigated the poly-ethylene ilm [4] and the di-block copolymer to evalu-ate precisely the inhomogeneity of proton polarization around doped TEMPO molecules [5]. Subsequently, the vapor sorption technique was successfully applied to sil-ica-illed rubber, which is used for fuel-eicient tires [6]. The vapor sorption technique can be applied to indus-trial rubber products after a manufacturing process.
A tire is a multi-component nanocomposite and an attractive target for contrast variation SANS with DNP. To improve tear and wear resistance, filler particles, such as carbon black (CB) and silica particles (SP), are mixed into the rubbery matrix. The spatial distribution of iller particles in rubbery matrix determines not only the tires’ reinforcement but also the energy loss per-formance. According to the empirical knowledge that the homogeneous dispersion of iller particles lowers the energy loss, various attempts to achieve dispersion
Contrast Variation by Dynamic Nuclear Polarization and
Time-of-Flight Small-Angle Neutron Scattering
Figure 1. Coherent scattering length of a proton against a fully polarized neutron beam as a function of pro-ton spin polarization, PH.
control have been conducted. A reliable methodology
for evaluating the iller particle dispersion is critical for
optimizing the tire rubber performance.
The combination of CB and SP is frequently used in tire manufacturing. In addition to the above-men-tioned efects, CB is useful for speciic UV resistance and electric discharge. For precise structural analyses, we need to decompose the observed SANS proiles into in-dividual partial scattering functions of CB and SP.
2. DNP experiment setup
As a model system for industrial tires, we prepared a ternary mixture of SBR (styrene-butadiene random copolymer) with SP and CB particles (SBR/SP/CP). The sample consisted of solution-SBR, silica particles, CB, si-lane-coupling agent and other additives. In the mixture, the volume fractions of CB and SP were 2% and 10%, respectively. After cure process (170°C for 20 min), the rubbery mixture was placed with TEMPO inside a sealed container at 40°C for 1 week. Consequently, the vapor-ized TEMPO spontaneously permeated the rubbery matrix. By ESR measurement, the TEMPO concentration was determined to be 35 mM. It was close enough to the empirically-known optimum value (30 mM) for DNP.
Figure 3 shows the schematic picture of the DNP-SANS experiment performed at TAIKAN (BL15) in J-PARC MLF. TAIKAN is equipped with a magnetic super-mirror polarizer, composed of Fe/Si multilayer (4Qc) to polarize neutron beams [7].
The top roof of the shield room has a slide hatch covering over the sample stage. Through this slide hatch, the DNP cryostat was introduced onto the sam-ple stage. The DNP cryostat was originally designed for SANS-J-II at JRR-3 and cannot fully cover the detectors of TAIKAN, which has detectors for neutrons with wider-scattering-angles (2θ> 15°).
The TEMPO doped rubber specimen was placed into a chamber illed with liquid 4He. By evaporating the liquid 4He, the specimen was cooled down to 1.2 K dur-ing continuous irradiation of microwave (94 GHz). The superconducting magnet generated a magnetic ield up to 3.5 Tesla at the sample position. The inhomogene-ity of the magnetic ield (DB/B0) was designed to be less than 10−4. The neutron beam passed along the central axis of the magnet coils. The windows through which the neutron beam passed were formed by thin alumin-ium plates, which caused less background scattering.
The top roof of the shield room had two trenches under the slide hatch. Through these trenches, pipes and cables were pulled out. The pipes were neces-sary to evaporate liquid 4He. The cables were used for energizing the superconducting magnet, monitoring the signals from the liquid helium level meter and the pressure and temperature sensors, measuring the NMR signals, and supplying voltage to the microwave gen-erator. The mechanical booster pump unit and the two electronic racks were placed on the roof of the shield room. Consequently, we controlled remotely the mag-netic ield, sample temperature, NMR measurements and microwave irradiation.
3. Contrast variation SANS results
Figure 4a shows the SANS results obtained for the ternary mixture system (SBR/SP/CP). We employed the limited wavelength range of 4 <λ< 7.6 Å, where the neutron polarization was high (PN> 97%). The q -depen-dence of the SANS proile varied as changing PH; the scattering maxima due to silica particles were observed for PH= 0% and PH=−34%, whereas the scattering max-ima disappeared for PH=+38%. As shown in Fig. 4b, the scattering length densities of silica and SBR match at PH =+30%. Around the matching point, the CB contribu-tion was observed more obviously.
SANS for the ternary mixture is given by a sum of three partial scattering functions (SSP-SP(q), SCP-CP(q) and
SSP-CP (q)), as follows
I(q; PH) = [ρSP−ρSBR(PH)]2SSP-SP(q) + [ρCP−ρSBR(PH)]2SCP-CP(q)
+ 2[ρSP−ρSBR(PH)] [ρCP−ρSBR(PH)] SSP-CP(q), (2) where the partial scattering functions are weighted by contrast factors. In the above equation, ρSP, ρCP, and ρSBR correspond to the neutron scattering-length density of SP, CP and SBR phases: ρSP= 3.08 × 1010 cm−2, ρCP= 6.50 × 1010 cm−2, and ρSBR= (0.62 + 8.39 PH) × 1010 cm−2. Only ρSBR depends on PH, because SBR contains hydrogen (Fig. 4b).
Figure 5 shows the separated partial scattering functions calculated by applying singular value
de-composition to the observed SANS proiles with
vari-ous PH. The partial scattering function of silica, SSP-SP, agreed well with the spherical form factor with the ra-dius of 610 ± 40 Å. The same proile was observed for the silica-illed SBR rubber sample (not shown here). The partial scattering function of CB, SCP-CP, indicated a power-law function of q−3.6, deviating from the Porod-law (q−4). This originated from the surface structure of CB. The result agreed with the reports for CB-illed rubber specimens [8]. The decomposition into partial scattering functions was successfully achieved. The cross-correlation term between silica and CB, SSP-CP, was also determined. SSP-CP is negligibly small as compared to SSP-SP and SCP-CP.
4. Conclusion
In this article, we report the irst attempt of DNP and contrast variation SANS experiments on the model mixtures for industrial tire conducted at the MLF of the J-PARC [9]. We performed TOF-SANS experiments using neutrons with a wide λ-range, which caused imperfect neutron polarization and variations of coherent and in-coherent scattering lengths. By carefully circumventing the efect from the imperfect neutron polarization, the partial scattering function separation was successfully demonstrated for the ternary system (SBR/SP/CP).
Finally, the neutron scattering experiment at the MLF of the J-PARC was performed under the user pro-gram (Proposal No. 2016A0160). We appreciate the help of the MLF instrument safety team and the sample envi-ronment team. This study was inancially supported by a Grant-in-Aid for Young Scientist (A) (Grant No. 25706033) of the Japan Society for the Promotion of Science.
References
[1] V. F. Sears, Neutron News, 3(3), 26-37 (1992). [2] T. Kumada, Y. Noda, T. Hashimoto and S. koizumi,
Phys. B, 404, 2637-2639 (2009).
[3] S. Koizumi, H. Iwase, J. Suzuki, T. Oku, R. Motokawa, H. Sasao, H. Tanaka, D. Yamaguchi, H. M. Shimizu and T. Hashimoto, J. Appl. Cryst. 40, s474-s479 (2007).
[4] Y. Noda, T. Kumada, T. Hashimoto and S. Koizumi, Phys. B, 404, 2572-2574 (2009).
[5] Y. Noda, T. Kumada, T. Hashimoto and S. Koizumi, J. Appl. Cryst. 44, 503-513 (2011).
[6] Y. Noda, D. Yamaguchi, T. Hashimoto, T. Shamoto, S. Koizumi, T. Yuasa, T. Tominaga and T. Sone, Phys. Procedia, 42, 52-57 (2013).
[7] T. Shinohara, J. Suzuki, T. Oku, S. Takata, H. Kira, K. Suzuya, K. Aizawa, M. Arai, T. Otomo, and M. Sugiyama, Phys. B. 404, 2640-2642 (2009).
[8] T. Koga, T. Hashimoto, M. Takenaka, K. Aizawa, N. Amino, M. Nakamura, D. Yamaguchi, and S. Koizumi, Macromolecules, 41, 453-464 (2008).
[9] Y. Noda, S. Koizumi, T. Masui, R. Mashita, H. Kishimoto, D. Yamaguchi, T. Kumada, S. Takata, K. Ohishi and J. Suzuki: J. Appl. Cryst., 49 2036-2045 (2016).
Y. Noda1, S. Koizumi1, T. Masui2, R. Mashita2, H. Kishimoto2, D. Yamaguchi3, T. Kumada3, S. Takata4, K. Ohishi5, and J. Suzuki5
1
Institute of Quantum Beam Science, Ibaraki University; 2
Sumitomo Rubber Industries Ltd; 3
Material Science Research Center, Japan Atomic Energy Agency; 4
J-PARC Center, Japan Atomic Energy Agency; 5
Neutron Science and Technology Center, Comprehensive Research Organization for Science and Society (CROSS)
Figure 4. (a) SANS proile for the SBR/SP/CP mixture at vari-ous PH. (b) Neutron scattering length density of
each domains of the sample as a function of proton spin polarization. The grey scale of the microscopic view corresponds to the neutron scattering length density.


![Figure 2. Experimental inelastic intensity contour and the corresponding calculated intensity contour along (a)(d) [hhh] c , (b)(e) [hh0] c](https://thumb-ap.123doks.com/thumbv2/123deta/8204897.370068/46.892.84.809.724.1044/figure-experimental-inelastic-intensity-contour-corresponding-calculated-intensity.webp)