九州大学学術情報リポジトリ
Kyushu University Institutional Repository
変異体及び生物物理学的手法を用いた大腸菌DNA複製 再開始因子PriB・DnaTの相互作用の研究
藤山, 紗希
https://doi.org/10.15017/1806972
出版情報:Kyushu University, 2016, 博士(創薬科学), 課程博士 バージョン:
権利関係:Fulltext available.
Mutational and Biophysical Studies on the Interaction of PriB and DnaT, Necessary for DNA Replication Restart in Escherichia coli
Saki Fujiyama
Laboratory of Protein Structure, Function and Design Graduate School of Pharmaceutical Sciences
Kyushu University
2016
1
Contents
Page
Abbreviations ………. 2
General Introduction ……… 3
Chapter 1 ………. 6
Analysis of PriB interaction with ssDNA Chapter 2 ………. 20
Analysis of DnaT oligomeric structure Chapter 3 ………. 34
Interaction analysis between PriB and DnaT Conclusion ………. 66
References ……….………. 69
Acknowledgements ……….……….…………. 76
List of papers ………. 78
2
Abbreviations
ADP adenosine diphosphate
ATP adenosine triphosphate
BSA bovine serum albumin
CD circular dichroism
DNA deoxyribonucleic acid
EDTA ethylenediaminetetraacetic acid EMSA electrophoresis mobility shift assay FITC fluorescein isothiocyanate
FRET fluorescence resonance energy transfer
HEPES 4-(2-hydroxyethyl)-1-piperazineethanesulfonic acid HPLC high performance liquid chromatography
HSQC hetero-nuclear single quantum coherence IPTG isopropyl -
D-1-thiogalactopyranoside ITC isothermal titration calorimetry LB medium Luria-Bertani medium
LED light emitting diode
MALDI-TOF matrix-assisted laser desorption/ionization time-of-flight MES 2-(N-morpholino)ethanesulfonic acid
NMR nuclear magnetic resonance PAGE polyacrylamide gel electrophoresis PCR polymerase chain reaction
PEG polyethylene glycol
PMSF phenylmethylsulfonyl fluoride SDS sodium dodecyl sulfate
SSB single-stranded DNA binding protein ssDNA single-stranded DNA
TBE Tris-Borate-EDTA
TFA trifluoroacetic acid
Tris tris(hydroxymethyl)aminomethane
UV ultraviolet
WT wild-type
3
General Introduction
All cellular organisms have DNA which encodes biological information essential for their living. In order to give the identical genetic information to daughter cells, DNA must be replicated only once per cell cycle with extraordinary accuracy. The strict regulation of DNA replication is generally achieved by the control of its initiation reaction [1]. The accuracy of the DNA daughter chain is mainly ensured by high-fidelity of the DNA polymerase in the elongation process of DNA replication [2].
In Escherichia coli , DnaA plays the roles of replication initiation and its regulation [3]. The replication origin oriC contains AT-rich region and DnaA boxes which are binding sites for DnaA. ATP-bound DnaA multimers, but not ADP-bound DnaA multimers, assemble at DnaA boxes, resulting in unwinding of the AT-rich region [4]. Subsequently, DnaB helicase is loaded onto the ssDNA (single-stranded DNA) region through the interaction with DnaA and DnaC helicase loader [5]. In the elongation process, DnaG primase and DNA polymerase III holoenzyme are loaded onto the ssDNA region through the interaction with DnaB, resulting in the formation of the replisome [6]. DnaB unwinds DNA in the 5’ to 3’ direction, DnaG synthesizes primers, and DNA polymerase III holoenzyme elongates the DNA daughter chains.
DNA damage frequently occurs due to environmental factors such as UV
radiation or chemical reagents. When the replisome encounters a damaged DNA, the
replisome is occasionally dissociated from DNA and replication is stopped [7]. Since
most bacteria have only a single replication origin, replication must be restarted in
a sequence-independent manner to accomplish the replication completely.
4
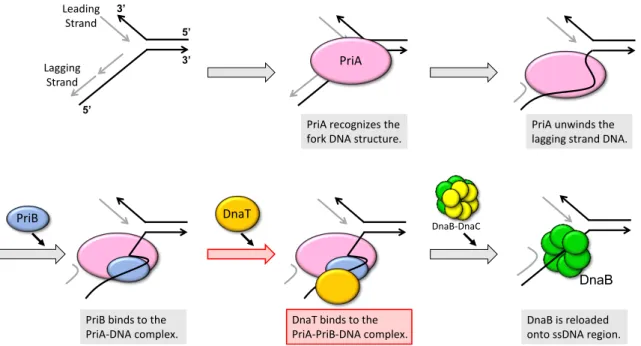
E. coli has two replication restart systems; PriA-dependent pathway and PriC- dependent pathway [8]. In PriA-dependent pathway, a major replication restart system, three proteins, named PriA, PriB and DnaT, participate in the reconstruction of the replisome (Fig. 0). PriA helicase recognizes the 3’-terminus of the nascent leading strand or D-loop structure formed after DNA repair [9,10]. PriA unwinds the lagging strand in the 3’ to 5’ direction [11]. Subsequently, PriB stabilizes the PriA−DNA complex and stimulates PriA’s helicase activity through the interaction with PriA and ssDNA [12,13]. In the next step, DnaT binds to the PriA−PriB−DNA complex, possibly resulting in the reloading of DnaB helicase onto the ssDNA region [14-16]. Once DnaB helicase has been loaded, the replisome will be constructed in the same manner as replication initiation. However, the mechanism how DnaB helicase is reloaded remains obscure. In particular, there is little information about the behavior of PriB and DnaT.
Recently, several reports have revealed the structures of bacterial replication restart proteins; PriA [17], PriB [18-20] and C-terminal domain of DnaT [21,22].
Furthermore, the structural studies also revealed the DNA binding mechanisms of those proteins [9,21,23]. In contrast, there is little information about the protein−protein interactions which are fundamental to PriA-dependent pathway. To clarify the molecular mechanism of PriA-dependent pathway, further studies about the interactions between these proteins are required.
In my thesis, I focused on the function of PriB and DnaT. In chapter 1, the DNA
binding mechanism of PriB was analyzed. The results showed a novel interaction
between two PriB dimers via ssDNA. In chapter 2, the structural analyses of DnaT
oligomer were performed, and the oligomerization site on DnaT was determined. In
5
PriADnaB-DnaC
PriB
DnaB DnaT
Leading Strand
Lagging Strand
5’
3’
5’
3’
PriA recognizes the fork DNA structure.
PriA unwinds the lagging strand DNA.
PriB binds to the PriA-DNA complex.
DnaT binds to the PriA-PriB-DNA complex.
DnaB is reloaded onto ssDNA region.
chapter 3, the interaction between PriB and DnaT was examined. As a result, the amino acid residues important for the interaction were suggested. These studies will provide the information to reveal the important process of PriA-dependent pathway;
DnaT binding to PriA−PriB−DNA complex (Fig. 0).
Figure 0. Schematic model of PriA-dependent pathway.
The process on which focused in this thesis is highlighted in red arrow and red box.
6
Chapter 1
Analysis of PriB interaction with ssDNA
Abstract
To elucidate the interaction mechanism between PriB and ssDNA, I performed several interaction analyses using fluorescence and EMSA. As a result, PriB showed two-phased ssDNA binding in a pH-dependent manner. Further analyses using PriB mutants revealed that His64 of PriB is important for the secondary binding mode.
On the basis of these results, two-step binding mechanism of PriB with ssDNA was
proposed.
7 Introduction
PriB, an 11.4 kDa basic protein, is one of the replication restart proteins [24,25].
In PriA-dependent pathway, PriB has the roles in stabilizing PriA−DNA complex [12,26] and stimulating PriA’s helicase activity [13,27]. The crystal structure of PriB revealed the similarity of tertiary structure to SSB (single-stranded DNA binding protein) [18-20]. Gene analysis also suggested that priB gene is derived from the duplication of ssb gene [28]. On the other hand, PriB forms a homodimer [18-20]
whereas SSB exists as a homotetramer [29]. Moreover, the ssDNA binding mechanism of PriB is different from that of SSB. In brief, while the ssDNA binding of PriB is mainly reliant upon electrostatic interactions by multiple basic residues [23], SSB utilizes base stacking interactions by aromatic residues as well as electrostatic interactions [29].
Previous NMR analysis showed that the titration of oligo-dT35 to
15N-labeled
PriB caused two-phased chemical shift changes in amide protons and nitrogens of
several amino acid residues [30], suggesting that PriB binds to ssDNA in a two-step
manner. In this chapter, I performed several interaction assays between PriB and
ssDNA using fluorophore-labeled oligo-dT35. These results suggested a novel
binding mechanism of PriB and ssDNA.
8 Experimental procedures
Protein expression and purification
To prepare PriB, E. coli strain BL21(DE3) was transformed with pET22b−priB plasmid, prepared previously [20]. Cells were grown in 500 mL of LB medium at 37 °C to an OD
600of 0.6, and then IPTG was added to a final concentration of 1 mM followed by induction for 3 hr at 37 °C. The cells were harvested and resuspended in 50 mM Tris-HCl buffer (pH 7.6), and then disrupted by sonication. Insoluble material was removed by centrifugation. PriB was precipitated by the addition of solid (NH
4)
2SO
4to a final concentration of 0.3 g/mL. The (NH
4)
2SO
4pellet was resuspended in 50 mM citrate buffer (pH 6.5) and dialyzed to dilute the concentration of (NH
4)
2SO
4. The dialyzed sample was applied to a TOYOPEARL®
SP-650M column (TOSOH, Tokyo, Japan, 1.5 × 8 cm) that was equilibrated with 50
mM citrate buffer (pH 6.5). After washing the column with 75 mL of the same citrate
buffer, PriB was eluted in a linear gradient of NaCl (0-1 M). Fractions containing
PriB were collected and dialyzed against 50 mM HEPES buffer (pH 6.5) containing
100 mM (NH
4)
2SO
4.
9 FRET assay
The fluorescence intensity was measured using an F-6200 fluorescence spectrophotometer (Hitachi, Tokyo, Japan). The fluorophore-labeled oligo-dT35 (5’- Cy3- and 3’-Cy5-labeled oligo-dT35, 10 pmol) was dissolved in 2 mL of 50 mM MES buffer (pH 5.5, 6.5, 7.5). Cy3 fluorescence was excited at 515 nm, and the emission was recorded at 530-700 nm. Concentrated PriB was titrated to the indicated concentrations. The measured intensity values were corrected for sample dilution.
The experiments were performed at room temperature. FRET was evaluated by the calculation of the formula I
A/ (I
A+ I
D); I
Ais fluorescence intensity of Cy5 (acceptor) at 665 nm and I
Dis fluorescence intensity of Cy3 (donor) at 567 nm.
Fluorescence anisotropy
Fluorescence anisotropy was measured at room temperature with an F-7000 fluorescence spectrophotometer equipped with a polarization filter (Hitachi, Tokyo, Japan). FITC-labeled oligo-dT35 (20 pmol) was dissolved in 2 mL of 50 mM MES buffer (pH 5.5). FITC fluorescence was excited at 495 nm, and the emission was recorded at 520 nm. Concentrated PriB was titrated to the indicated concentrations.
Preparation of protein mutants
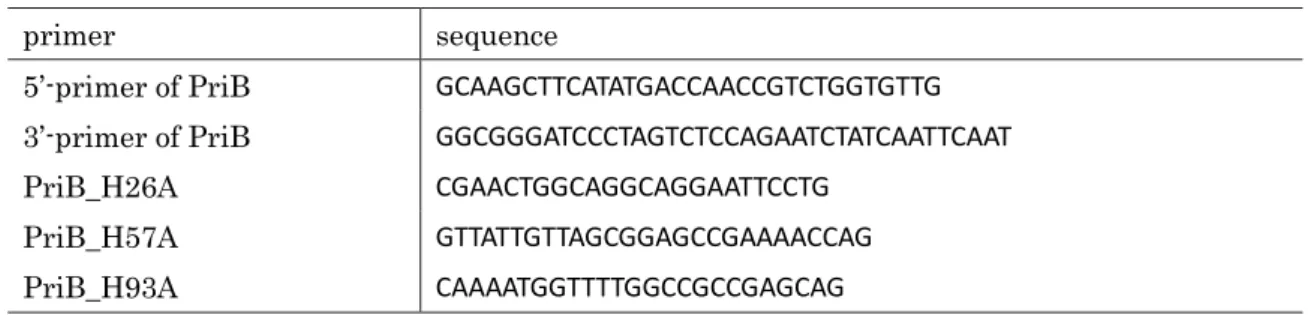
PriB mutants H26A, H57A and H93A were prepared by site-directed mutagenesis
on priB gene using megaprimer method [31] with the primers summarized in Table
1-1. The DNA fragments were ligated into pET-22b(+) plasmid and were confirmed
by DNA sequencing. Other mutants were previously prepared [30]. The mutants
were expressed and purified by the same method used for wild-type PriB.
10
primer sequence
5’-primer of PriB GCAAGCTTCATATGACCAACCGTCTGGTGTTG 3’-primer of PriB GGCGGGATCCCTAGTCTCCAGAATCTATCAATTCAAT PriB_H26A CGAACTGGCAGGCAGGAATTCCTG
PriB_H57A GTTATTGTTAGCGGAGCCGAAAACCAG PriB_H93A CAAAATGGTTTTGGCCGCCGAGCAG
Circular dichroism (CD) spectral analysis
Wild-type or mutant PriB (20 M) was dissolved in 25 mM HEPES buffer (pH 6.5) containing 50 mM (NH
4)
2SO
4. The CD spectra were recorded at room temperature using a quartz cell of 1 mm optical path length on a J-720W CD spectropolarimeter (JASCO, Tokyo, Japan). The molar ellipticity () expressed in degrees × cm
2/dmol was calculated based on a mean residue molecular weight of 110 Da. Three times of spectra were measured for each sample.
EMSA
FITC-labeled oligo-dT35 (20 pmol) was incubated with indicated amounts of PriB for 30 min at 25 °C in 50 mM MES buffer (pH 5.5) containing 5 % glycerol. The reaction mixtures were resolved by polyacrylamide gel electrophoresis (200 V at 4 °C in 1× TBE) under non-denaturing conditions. FITC-labeled oligo-dT35 was detected with an NF-1050B Blue LED illuminator (Nihon Eido, Tokyo, Japan).
Table 1-1. Primer sequences used in this chapter.
11 Results
PriB−ssDNA interaction and its pH dependence assessed by FRET assay
SSB binds to ssDNA by wrapping ssDNA [32]. The wrapping state of ssDNA with SSB has been investigated by FRET using unique ssDNA substrate; each end of ssDNA is labeled with Cy3 (donor) or Cy5 (acceptor) [33,34]. Following the report, I performed a FRET assay to examine the ssDNA binding of PriB. Concentrated PriB was titrated to the MES buffer (pH 6.5) containing 5’-Cy3- and 3’-Cy5-labeled oligo-
dT35, and then the fluorescence was measured. As a result, FRET was changed by the addition of PriB. Plot of the I
A/ (I
A+ I
D) against PriB concentration represented a two-phased saturation curve (Fig. 1-1A, closed circles). Since the addition of BSA instead of PriB did not cause first and second saturated curves (Fig. 1-1A, open circles), the FRET was PriB-specific. Therefore, it was suggested that PriB has two ssDNA binding modes.
To further characterize the two-phased change of FRET, I performed similar
experiments under different pH conditions; pH 5.5 and pH 7.5. The second curve at
pH 5.5 was saturated at lower PriB concentration than pH 6.5 (Fig. 1-1A, closed
squares), whereas the second curve disappeared at pH7.5 (Fig. 1-1A, closed
triangles). The pH obviously affected the second saturation curve but did not affect
the first curve. On the basis of pH-dependence of the second curve at pH 5.5−7.5, I
expected that positive charge(s) of protonated histidine residue(s) may be involved
in the second transition of FRET because intrinsic pKa value of histidine residue in
protein is approximately 6.5.
12
00.1 0.2 0.3 0.4
0 50 100 150
pH5.5 pH6.5 pH7.5 系列4 IA/(IA+ID)
PriB dimer / DNA molar ratio
0 10 20 30
BSA
0 100 200 300 400
0 100 200 300
系列
1系列2
Fluorescence anisotropy
PriB dimer / DNA molar ratio
0 10 20 30
0 M NaCl 1 M NaCl
PriB−ssDNA interaction assessed by fluorescence anisotropy
I further examined the ssDNA binding of PriB using fluorescence anisotropy.
Concentrated PriB was titrated to the MES buffer (pH 5.5) containing FITC-labeled oligo-dT35, and then fluorescence anisotropy was measured. As shown in Figure 1- 1B, fluorescence anisotropy increased by the first addition of PriB. The increase of fluorescence anisotropy was not detected in the presence of 1 M NaCl, because PriB could not bind to ssDNA under high salt conditions [23,35]. Therefore, the increase of fluorescence anisotropy suggests the formation of PriB-dT35 complex. Unlike the case of FRET, however, I could not detect the second transition by the titration of PriB, suggesting that the apparent molecular size of PriB-dT35 complex is maintained during the first and second transition in FRET experiments.
(A) (B)
Figure 1-1. PriB−ssDNA interaction assessed by FRET and fluorescence anisotropy.
(A) The pH-dependent change of FRET. Wild-type PriB or BSA (0-300 pmol) was added
to 10 pmol of 5’-Cy3 and 3’-Cy5-labeled oligo-dT35 at pH 5.5, pH 6.5, and pH 7.5. FRETwas calculated by the formula I
A/ (I
A+ I
D); I
Aand I
Dare fluorescence intensities at 665 nm and 567 nm, respectively.
(B) The change of fluorescence anisotropy. Wild-type PriB (0 − 600 pmol) was added to 20
pmol of FITC-labeled oligo-dT35 at pH 5.5 in the presence or absence of 1 M NaCl. The
fluorescence of FITC was detected by the excitation at 495 nm and the emission at 520
nm.
13
-6000 -4000 -2000 0 2000 4000 6000 8000 10000
190 200 210 220 230 240 250 [θ] (deg・cm2/dmol)
wavelength (nm)
WT H64A H81A H43A H26A H57A H93A
His43
His57 His64 His93
His81
His26 His43
His57
His64 His93
His81 His26
Preparation of PriB_HA mutants
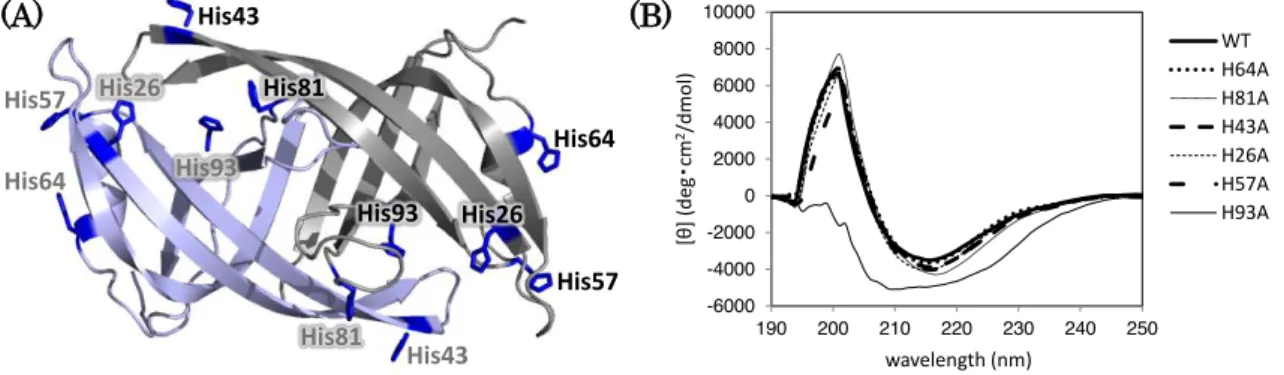
Involvement of histidine residue(s) in PriB−ssDNA interaction was suggested from pH dependence of the FRET assay. There are six histidine residues exposed on the PriB molecular surface (Fig. 1-2A). To investigate which histidine residue(s) contribute to the pH-dependent FRET change, I prepared PriB_HA (histidine-to- alanine) mutants; H26A, H43A, H57A, H64A, H81A and H93A. The CD spectra of purified mutants, except for H93A, proved that the secondary structure of each mutant is similar to that of wild-type PriB (Fig. 1-2B). PriB mutant H93A showed unexpected CD spectrum, suggesting disruption of the secondary structure. In fact, the crystal structure of wild-type PriB suggests that His93 side chain may form a hydrogen bond with Glu38 side chain on another protomer in PriB dimer interface [19]. Therefore, the intermolecular hydrogen bond between His93 and Glu38 is suggested to be important for stabilizing PriB structure. PriB mutant H93A was excluded in the following experiments.
(A) (B)
Figure 1-2. Preparation of PriB_HA mutants.
(A) Crystal structure of PriB dimer (Protein Data Bank accession code 1V1Q). The substituted histidine residues are shown as stick models and colored in blue.
(B) CD spectra of PriB_HA mutants. Proteins (10
M) were analyzed at roomtemperature in HEPES buffer (pH 6.5).
14
00.1 0.2 0.3 0.4
00 1050 20100 30150
IA/(IA+ID)
PriB dimer / DNA molar ratio
0 0.1 0.2 0.3 0.4
0 50 100 150
0 10 20 30
IA/(IA+ID)
PriB dimer / DNA molar ratio
0 0.1 0.2 0.3 0.4
0 50 100 150
H64A H26A H57A WT H81A H43A
0 10 20 30
IA/(IA+ID)
PriB dimer / DNA molar ratio
FRET assay using PriB_HA mutants
I performed the FRET assay using PriB_HA mutants instead of wild-type PriB.
As a result, all mutants showed FRET change comparable to that of wild-type PriB at pH 5.5 or pH 7.5 (Fig. 1-3A, C). On the other hand, the second transition curve of H64A was not saturated at pH 6.5 (Fig. 1-3B), suggesting that His64 residue on PriB is involved in the second transition of FRET.
(A) (B)
(C)
Figure 1-3. FRET assay of the interaction between PriB_HA mutants and ssDNA.
The changes of FRET by the addition of PriB_HA mutants. Each PriB_HA mutant (0-
300 pmol) was added to 10 pmol of 5’-Cy3 and 3’-Cy5-labeled oligo-dT35 at pH 5.5 (A),pH 6.5 (B) and pH 7.5 (C). FRET was calculated by the formula I
A/ (I
A+ I
D); I
Aand I
Dare fluorescence intensities at 665 nm and 567 nm, respectively.
15 PriB−ssDNA interaction assessed by EMSA
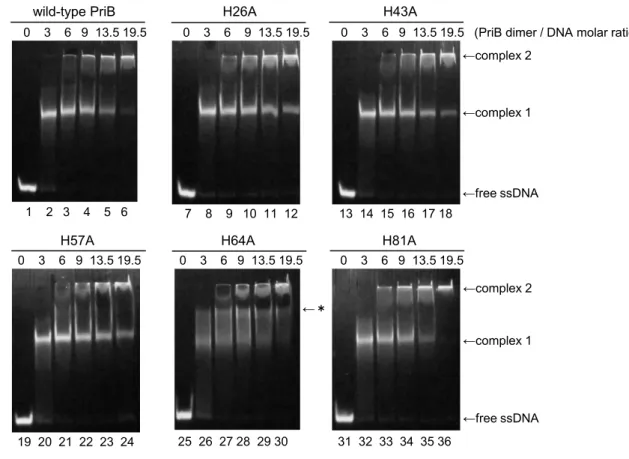
PriB−ssDNA interaction was further examined by EMSA. Each concentration of wild-type PriB was incubated with FITC-labeled oligo-dT35, and the mixtures were subjected to electrophoresis under non-denaturing conditions. When the PriB / oligo- dT35 molar ratio was 6, a band of PriB-ssDNA complex appeared on the middle of gel (Fig. 1-4, lane 2, complex 1). Moreover, as the PriB concentration increased, a new band increased at the top of gel (Fig. 1-4, lane 6, complex 2). This result indicates that two types of complexes exist. Hence, EMSA also suggests that PriB interacts with oligo-dT35 in a two-step manner.
I also carried out the EMSA using PriB_HA mutants instead of wild-type PriB.
Most EMSA patterns of PriB_HA mutants were similar to that of wild-type PriB. In the case of H81A, the bands of complex 1 were slightly smeared, whereas the bands of complex 2 were similar to that of wild-type PriB. Hence, the complex 1 of PriB_H81A might be slightly different from that of wild-type PriB. On the other hand, in the case of H64A, the band of “complex 1” became obviously smeared in comparison with that of wild-type PriB and other mutants. Furthermore, I found a new band between “complex 1” and “complex 2” (indicated by asterisk). In the FRET
assay, H64A showed defect of the second transition. Therefore, the new band was
suggested to be an intermediate caused by weak interaction of H64A for the second
binding mode.
16
←free ssDNA 0 3 6 9 13.5 19.5
wild-type PriB H26A H43A
H57A H64A H81A
←complex 1
←complex 2
←free ssDNA
←complex 1
←complex 2
←*
1 2 3 4 5 6 7 8 9 10 11 12 13 14 15 16 17 18
19 20 21 22 23 24 25 26 27 28 29 30 31 32 33 34 35 36
0 3 6 9 13.5 19.5 0 3 6 9 13.5 19.5 (PriB dimer / DNA molar ratio)
0 3 6 9 13.5 19.5 0 3 6 9 13.5 19.5 0 3 6 9 13.5 19.5
Figure 1-4. EMSA of the interaction between PriB_HA mutants and ssDNA.
FITC-labeled oligo-dT35 (20 pmol) was incubated with wild-type PriB or each PriB_HA
mutant (0, 120, 240, 360, 540 and 780 pmol) for 30 min at 25 °C in 50 mM MES buffer
(pH 5.5) containing 5% glycerol. The reaction mixtures were analyzed by 15 % PAGE and
fluorescence.
17 Discussion
From the FRET assay and EMSA, it was suggested that PriB could form two types of complexes with oligo-dT35. Moreover, the analyses using PriB_HA mutants indicated that His64 residue of PriB is involved in the second binding mode. In the previous NMR study of
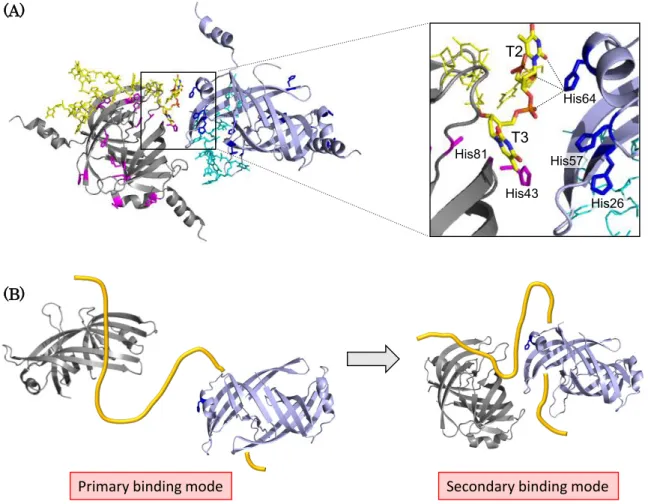
15N-labeled PriB, two-phased chemical shift changes were shown by the titration of oligo-dT35 [30]. In the study, the PriB-dT35 interaction site in the first phase was consistent with the interaction site supported by the crystal structure of PriB−dT15 complex [23]. In contrast, the chemical-shift-perturbed residues in the second phase, including His64, were different from those in the first phase [30]. Taken together with these results, I interpret that the primary binding mode corresponds to the known binding mechanism revealed by the crystal structure of PriB−dT15 complex, and the secondary binding mode is a novel binding mode in which another interaction site on PriB is involved.
Then, I searched the contact sites between two neighboring PriB−dT15 complexes
in crystal lattice. As a result, I found that His64 side chain on PriB interacted with
T2 and T3 in oligo-dT15, which formed a complex with adjacent PriB dimer (Fig. 1-
5A). In more detail, N2 atom of His64 on the neighboring PriB was proximal to
phosphate groups in T2 and T3, and to the oxygen atom in T2 nucleobase. Hence,
these interactions through His64 residue might correspond to the secondary binding
mode of PriB−ssDNA binding. Interestingly, whereas PriB_H64A showed defect of
the secondary binding mode at pH 6.5, it recovered at pH 5.5. As shown in Figure 1-
5A, there are several histidine residues around the oligo-dT15 at the secondary
binding site. Therefore, these histidine residues might also be involved in the
18
secondary binding mode at pH 5.5, because histidine residues are generally protonated at pH 5.5.
From the assay using fluorescence anisotropy, it was suggested that the apparent molecular size of PriB−dT35 complex does not change between the primary and secondary binding mode. Furthermore, it was considered that the binding site size of PriB−ssDNA complex is 12 ± 1 nt [35]. Hence, oligo-dT35, used in this chapter, are long enough to interact with two PriB dimers at once. Taken together, I propose a model of two-step interaction between PriB and oligo-dT35 (Fig.1-5B). In the first step, two PriB dimers bind to one oligo-dT35 molecule independently (Fig. 1-5B, left).
In the second step, two PriB dimers on the oligo-dT35 approach each other through the interaction between oligo-dT35 and His64 side chain, as described in Figure 1- 5A (Fig. 1-5B, right). When the secondary binding occurred, the extended oligo-dT35 would form a compact structure. It is consistent with the drastic increase of FRET observed in the second saturation curve (Fig. 1-1A). However, there is not enough evidence to conclude whether this model is correct. Further study is needed to explain this effect.
In this chapter, I demonstrated that PriB binds to ssDNA by two-step mode and achieves compactness of ssDNA at a lower pH condition. It has been suggested that ssDNA binding of PriB is related to the stimulation of PriA helicase by PriB [13].
Therefore, I expect that PriB has an essential role of regulating the replication
restart mechanism in a pH-dependent manner. Furthermore, it is possible that PriB
protects ssDNA at lower pH conditions and acts as an acid tolerance protein like
Streptococcus mutans SSB, which prevents ssDNA damage under low pH conditions
[36].
19
His64
His57 His26 His43
His81
T2
T3
Primary binding mode Secondary binding mode
(A)
(B)
Figure 1-5. Interaction between PriB−ssDNA complex and neighboring PriB.
(A) The contact site between PriB−dT15 complex and neighboring PriB−dT15 complex. The structures were extracted from the crystal structure of PriB−dT15 complex (Protein Data Bank accession code 2CCZ). Histidine residues are shown as stick models. T2 and T3 in oligo-dT15 are also shown as stick models, and colored by elements (carbon, yellow; nitrogen, blue; oxygen, red; phosphorus, orange).
(B) Possible model of two-step interaction between PriB and oligo-dT35. In the primary
binding mode, two PriB dimers independently bind to oligo-dT35. In the secondary
binding mode, the two PriB dimers on oligo-dT35 approach each other through the
interaction of His64 side chain with oligo-dT35 as described in (A). Yellow curved line
represents oligo-dT35.
20
Chapter 2
Analysis of DnaT oligomeric structure
Abstract
To investigate the oligomerization mechanism of DnaT, several deletion mutants
of DnaT were analyzed by CD spectra and gel filtration chromatography. As a result,
the region Phe42−Asp66 on the N-terminal domain of DnaT was suggested to be
involved in the oligomerization of DnaT. Further mutational analyses indicated that
the hydrophobic interaction derived from some amino acid residues containing
Leu53 is important for the oligomerization of DnaT.
21 Introduction
DnaT, a 19.5 kDa acidic protein, is one of the replication restart proteins [25,37].
A dnaT mutant cell shows UV sensitivity and high basal levels of SOS expression, similar to the priA mutant cells [38]. In addition, DnaT physically interacts with PriB [14,39,40]. Therefore, DnaT is an essential factor for PriA-dependent pathway.
DnaT forms a trimer or oligomer [37,41]. Previously, two domains of DnaT (DnaT
1-88; DnaTN, DnaT
89-179; DnaTC) were defined by a limited proteolysis [22].
Moreover, it was suggested that DnaTN forms oligomers and DnaTC exists as a monomer [22]. In the case of the C-terminal region, the NMR structure of DnaT
89- 179and the crystal structure of DnaT
84-153−dT10 complex were determined [21,22].
In contrast, the structure of the DnaT N-terminal region, which possesses the ability
for oligomerization, has not been solved. Some papers demonstrated the
oligomerization of DnaT deletion mutants; dimer formation of DnaT
1-161or trimer
formation of DnaT
42-179[41,42]. Possibly, the complicated oligomerization states of
DnaT might prevent the structure determination. In this chapter, to examine the
structure of DnaT oligomer, I prepared various DnaT mutants and analyzed its
oligomerization states.
22
primer sequence
5’-primer of His6-DnaT1-88 CGCAAGCTTCATATGCACCACCACCACCACCACTCTTCCAGAGTTTTGACCCCG 3’-primer of His6-DnaT1-88 CGGGATCCTCATTTCCCCATGGGTACAGCAAC
3’-primer of His6-DnaT1-69 CGGGATCCTCACAGAGCGACATCGCTTCCCG 3’-primer of His6-DnaT1-66 CCGGATCCTCAATCGCTTCCCGGACGCGCC DnaT1-88_L53S CCTGGCTGAAAGCCTGGCGCTG
DnaT1-88_L56S CTGCTGGCGAGCGAAGAAAAGCTG DnaT1-88_L60S CTGGAAGAAAAGAGCGCGCGTCCG
Experimental procedures
Preparation of DnaT deletion mutants; DnaT 1-69 and DnaT 1-66
DNA fragments corresponding to the residues 1−69 and 1−66 of DnaT with a His
6- tag were amplified by PCR with the primers summarized in Table 2-1. Each of the amplified DNA fragments was ligated into pET-22b(+) plasmid and was confirmed by DNA sequencing.
Table 2-1. Primer sequences used in this chapter.
23 Protein expression and purification
To prepare DnaTN (DnaT
1-88), DnaT
1-69and DnaT
1-66, E. coli strain BL21(DE3) was transformed with the plasmid which codes each gene of DnaT derivatives. Cells were grown in 500 mL of LB medium at 37 °C to an OD
600of 0.6, and then IPTG was added to a final concentration of 1 mM followed by induction for 20 hr at 20 °C. The cells were harvested and resuspended in 50 mM Tris-HCl buffer (pH 8.5) containing 20 % glycerol, 30 mM NaCl, 1 mM EDTA and 1 mM PMSF, and then disrupted by sonication. Insoluble material was removed by centrifugation. Each DnaT derivative was precipitated by the addition of solid (NH
4)
2SO
4to a final concentration of 0.3 g/mL. The (NH
4)
2SO
4pellet was resuspended in buffer A; 50 mM Tris-HCl buffer (pH 8.5) containing 20 % glycerol and 30 mM NaCl, and dialyzed to dilute the concentration of (NH
4)
2SO
4. The dialyzed sample was applied to a Ni Sepharose 6 Fast Flow column (GE Healthcare Life Sciences, Little Chalfont, UK, 1.5 × 3 cm) that was equilibrated with buffer A. After washing the column with 50 mL of buffer A containing 40 mM imidazole, each DnaT derivative was eluted in a stepwise manner with buffer A containing 400 mM imidazole. Fractions containing DnaT derivatives were collected and dialyzed against buffer A.
Circular dichroism (CD) spectral analysis
Each of DnaT derivatives (20 M) was dissolved in 25 mM Tris-HCl buffer (pH
8.5) containing 10 % glycerol and 15 mM NaCl. The CD spectra were recorded as
described in chapter 1.
24 Gel filtration chromatography
DnaT derivatives (200 M, 30 L) were applied to a Superdex 200 10/300 GL (GE Healthcare, Little Chalfont, UK) equilibrated with 50 mM Tris-HCl buffer (pH 8.0) containing 30 mM NaCl. The column was operated at a flow rate of 0.4 mL/min. The proteins were detected by measuring the absorbance at 280 nm. The column was calibrated with proteins of known molecular weight; BSA (67,000), ovalbumin (43,000), -lactoglobulin (35,000), myoglobin (17,000) and ribonuclease A (13,700).
The K
avvalues for proteins were calculated from the equation; K
av= (V
e-V
o)/(V
c-V
o), where V
eis elution volume, V
ois column void volume, and V
cis geometric column volume.
Preparation of DnaTN_LS mutants
To prepare DnaTN_LS mutants, point mutations were incorporated into the protein
expression plasmid by the megaprimer method [31] with the primers summarized in
Table 2-1. The DNA fragments were ligated into pET-22b(+) plasmid and were
confirmed by DNA sequencing. The mutants were expressed and purified by the
same methods used for wild-type proteins.
25 Results
Preparation of DnaT deletion mutants; DnaT 1-69 and DnaT 1-66
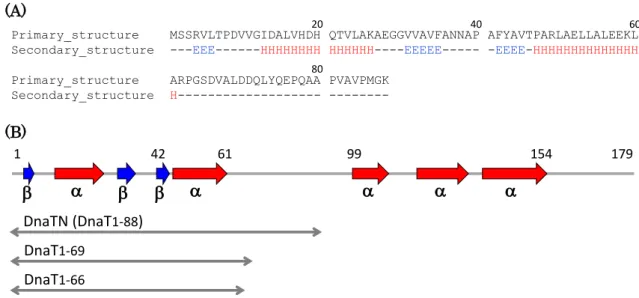
The secondary structure prediction of DnaTN (DnaT
1-88) indicates that there is no secondary structure in the region Arg62−Lys88 (Fig. 2-1A). Taken together with the solution structure of DnaTC (DnaT
89-179), there might be a flexible linker region between two domains (Fig. 2-1B). To examine the contribution of DnaT linker to the oligomerization, I prepared new DnaT deletion mutants DnaT
1-69and DnaT
1-66, which truncated the linker region from DnaTN (Fig. 2-1B). The CD spectra of DnaT
1- 69and DnaT
1-66indicated the decrease of negative ellipticity at 208 nm compared with that of DnaTN, suggesting the loss of random coil region (Fig. 2-2).
Oligomerization analysis of DnaT deletion mutants by gel filtration chromatography To investigate the oligomerization state of DnaT deletion mutants, I evaluated the apparent molecular size of DnaT deletion mutants using gel filtration chromatography (Fig. 2-3). As a result, DnaTN (DnaT
1-88) showed two peaks (Fig.
2-3A) and the apparent molecular weights were estimated to be 65,000 and 40,000,
based on the calibration of molecular weight marker proteins (Fig. 2-3B, C). Since
the molecular weight of DnaTN monomer is 10,500, DnaTN is suggested to form
oligomers. Moreover, DnaT
1-69and DnaT
1-66also showed two peaks similar to that
of DnaTN. These results suggest that Val67−Lys88 is not involved in the
oligomerization of DnaTN. Huang’s group has demonstrated that DnaT
42-179forms
trimer [42]. Taken together, the region from Phe42 to Asp66 on DnaT would have a
propensity to form oligomers.
26
Primary_structure MSSRVLTPDVVGIDALVHDH QTVLAKAEGGVVAVFANNAP AFYAVTPARLAELLALEEKL Secondary_structure ---EEE---HHHHHHHH HHHHHH----EEEEE--- -EEEE-HHHHHHHHHHHHHH Primary_structure ARPGSDVALDDQLYQEPQAA PVAVPMGK
Secondary_structure H--- ---
20 40 60
80
1 42 61 99 154 179
DnaTN (DnaT
1-88) DnaT
1-69DnaT
1-66-10000 -7500 -5000 -2500 0 2500 5000 7500 10000
200 210 220 230 240 250
[θ](deg・cm2/dmol)
wavelength (nm)
DnaT1-88 DnaT1-69 DnaT1-66
(A)
(B)
Figure 2-1. Secondary structure of DnaT.
(A) The secondary structure of DnaTN (DnaT
1-88) was predicted by Jpred 4 server (http://www.compbio.dundee.ac.uk/jpred/). “E” and “H” indicate
-sheet and -helix,respectively. Amino acid numbers are indicated at the top.
(B) Schematic diagrams of the predicted secondary structure of DnaT and DnaT deletion mutants analyzed in this chapter. Amino acid numbers are indicated at the top. The secondary structure of Phe89 − Gly179 is based on the NMR structure of DnaT
89-179(Protein Data Bank accession code 2RU8).
Figure 2-2. CD spectra of DnaT deletion mutants.
CD spectra of DnaT
1-88(DnaTN), DnaT
1-69and DnaT
1-66. Each DnaT derivative (20
M) was analyzed at room temperature in 25 mM Tris-HCl buffer (pH 8.5) containing 15
mM NaCl and 10 % glycerol.
27
y = -0.195ln(x) + 2.4759 R² = 0.9697
0 0.2 0.4 0.6 0.8
10,000 100,000
Kav
molecular weight (in log scale)
BSA (67,000) ovalbumin (43,000) β-lactoglobulin (35,000) myoglobin (17,000)
ribonuclease A (13,700)
DnaT1-88peak2
DnaT1-88peak1
0 8 16 24
Absorbance at 280nm
Elution volume (mL)
Marker
0 8 16 24
Absorbance at 280nm
Elution volume (mL)
DnaT
1-88DnaT
1-69DnaT
1-66 peak2 peak1(A) (B) (C)
Figure 2-3. Gel filtration chromatography of DnaT deletion mutants.
(A) Gel filtration chromatography of DnaT derivatives. The column (Superdex 200 10/300 GL) was eluted with 50 mM Tris-HCl buffer (pH 8.0) containing 30 mM NaCl at a flow rate of 0.4 mL/min.
(B) Separation of the molecular weight marker proteins for calibration.
(C) A linear standard curve was generated by plotting the log of molecular weight of the
calibration proteins against their K
avvalues.
28 Design and preparation of DnaTN_LS mutants
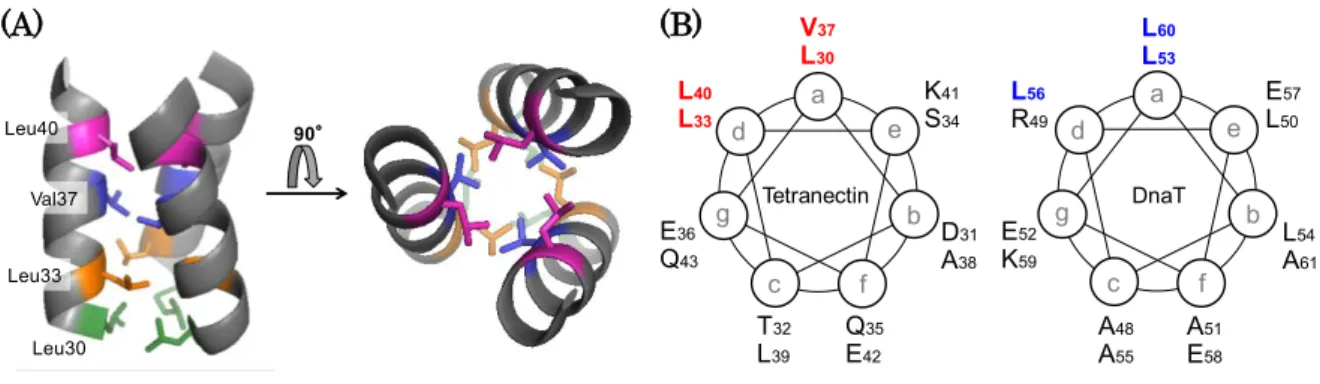
It was suggested that Phe42−Asp66 on DnaT is involved in the oligomerization of DnaT in the previous section. The secondary structure prediction indicates that there are secondary structures between Phe42 and Asp66; a -sheet (Phe42−Val45) and an -helix (Pro47−Ala61) (Fig. 2-1A). I expected that these secondary structures are possibly important for the oligomerization of DnaT. In this section, I focus on the
-helix (Pro47−Ala61). Tetranectin is one of the proteins which form trimer via
hydrophobic amino acid residues on -helix [43] (Fig. 2-4A). When the -helix on the trimerization site of tetranectin was displayed by a helical wheel projection, a series of four hydrophobic residues (Leu30, Leu33, Val37 and Leu40) were located onto one face of the plot (Fig. 2-4B, left). Similar to that of tetranectin, the helical wheel projection of the -helix (Ala48−Ala61) of DnaT suggests that there are three leucine residues (Leu53, Leu56 and Leu60) on one face of the plot (Fig. 2-4B, right). Moreover, these leucine residues are highly conserved among DnaT homologs (Fig. 2-5). Hence, I speculated that these leucine residues contribute to the oligomerization of DnaT.
Thus, I prepared DnaTN_LS (leucine-to-serine) mutants; L53S, L56S and L60S.
The CD spectra of DnaTN mutants L56S and L60S suggested that these mutants retain the secondary structures similar to that of wild-type DnaTN (Fig. 2-6A). In contrast, the CD spectrum of DnaTN mutant L53S was different from that of wild- type DnaTN (Fig. 2-6A). The decrease of negative ellipticity at 222 nm and the increase of negative ellipticity at 201 nm compared with that of wild-type DnaTN might reflect the loss of -helix and the gain of random coil, respectively. This result suggests that Leu53 is involved in the conformational stability of DnaTN.
Furthermore, I examined whether the conformation of DnaTN was salt-dependent.
29
90°
Leu30 Leu33
Val37
Leu40 d
a
g
c f
e
b
d a
g
c f
e
b V37
L30
L60
L53
K41
S34
E57
L50
D31
A38
L54
A61
Q35
E42
A51
E58
T32
L39
A48
A55
L40
L33
L56
R49
E36
Q43
E52
K59
DnaT Tetranectin
As a result, the CD spectra of wild-type DnaTN were not affected by the concentration of NaCl (Fig. 2-6B, left). On the other hand, the CD spectra of DnaTN mutant L53S changed in a salt-dependent manner. Namely, as the concentration of NaCl increased, the CD spectra became similar to that of wild-type DnaTN (Fig. 2- 6B, right). Since the increase of salt concentration generally enhances hydrophobic interaction, the substitution of Leu53 to serine was suggested to cause decrease of the hydrophobic interaction, which was important for proper folding of DnaTN.
Therefore, some amino acid residues containing Leu53 might be involved in the hydrophobic interaction for proper folding of DnaTN.
(A) (B)
Figure 2-4. Trimerization site of tetranectin.
(A) Ribbon model of trimerization site on tetranectin (Protein Data Bank accession code 1HTN). The residues involved in the trimerization of tetranectin are shown as stick models and colored.
(B) Helical wheel projections of Leu30 − Gln43 on tetranectin (left) and Ala48 − Ala61 on
DnaT (right). The residues involved in the trimerization of tetranectin are colored in red,
and the leucine residues substituted to serine on DnaT in this chapter are colored in blue.
30
Escherichia_coli ---MSSRVLTPDVVGIDALVHDH Pantoea_ananatis ---MSVKILTSTLIGLEAFRQDP Salmonella_enterica ---MSSRILTSDVIGIDVLLHDH Klebsiella_pneumoniae ---MSSRILTSHFSGLEEFLQQH Shigella_flexneri ---MSSRVLTPDVVGIDALVHDH Kosakonia_oryzae ---MSSRILTSNVIGIDEFVRDH Erwinia_gerundensis ---MSVKILTSTIIGIDAFCQDP Citrobacter_freundii ---MPCKILTPDVTSIDALLHDH Enterobacter_aerogenes ---MSSRILTTDFCGLDDFVENH Enterobacter_cloacae ---MSSRILTTDFCGLDDFVENH Ishikawaella_capsulata MIFVANFIFIKYQDILINLQKYFTNLILLTYIINIKIGFFMSVNIQNTTIISLKKFCQNP
* .: . . .:. : .:
Escherichia_coli QTVLAKAEGGVVAVFANNAPAFYAVTPARLAELLALEEKLARPGSDVALDDQLYQEPQAA Pantoea_ananatis LSALQQAEDGTLAVLENYTPVMYAITPARLARLLALEAAAQQ-PSDVALDDSLYDDVSA- Salmonella_enterica HAVLAKSTGGAVAVFANNAPAFYAVTPARMAELLALEEKLSRPGSDVALDAQFYEEPEAA Klebsiella_pneumoniae AALLAKSTDGTVAVFANNAPAFYALTPARLAQLLELEARLARPGSDIALDPQFFEEPAAA Shigella_flexneri QTVLAKAEGGVVAVFANNAPAFYAVTPARLAELLALEEKLARPGSDVALDDQLYQEPQAA Kosakonia_oryzae ASVLARTEGGAVAVFANNSPAFYAVTPQRLEQLLALEARLARPASDIALDAQFYEEPTAA Erwinia_gerundensis AQALQATEQGAVAVFTNNAPQFYALTPQRLAQLLAAEAAMQA-RNDVALDEDLFQDDAAS Citrobacter_freundii HAVLAKSAGGAVAVFANNAPAFYAVTPARLAELLALEEKLSRPGSDVTLDDQFYEEPQAA Enterobacter_aerogenes AARLQKSASGAVAVFANNAPAFYALTPERLAQLLELEAKLARPTSDIALDAQFFDEPSAA Enterobacter_cloacae AARLQKSASGAVAVFANNAPAFYALTPERLAQLLELEAKLARPTSDIALDAQFFDEPSAA Ishikawaella_capsulata LRFLYNADNSIIAVCENDITIFYAITPKKLTEILEIKTTYKK-ANSISLDNKFNNLLVSK
* : . :** * :**:** :: .:* : ..::** .: : : Escherichia_coli PV--AVPMGKFAMYPDWQPDADFIRLAALWGVALREPVTTEELASFIAYWQAEGKVFHHV Pantoea_ananatis --TLHTPVGKFAMYDGWQPDADFTRQAAIWGVALSEPVTPAELAAFVAYWQAEGRLFHHV Salmonella_enterica PV--AIPCGKFAMYPAWQPDADFQRQAALWGVALREPVTAEELAAFIAYWQAEGKVFHHI Klebsiella_pneumoniae PV--AVPMGKFAMYAGWQPDADFQRLAALWGIALSQPVTPEELAAFVAYWQAEGKVFHHV Shigella_flexneri PV--AVPMGKFAMYPDWQPDADFIRLAALWGVALREPVTTEELASFIAYWQAEGKVFHHV Kosakonia_oryzae PV--NVPMGKFAMYAGWQPDADFQRLAALWGIALTQPVTPEELAAFVAYWQAEGKVFHHV Erwinia_gerundensis PVAIAVPAGKFALYDGWQPDADFVRLAAVWGVPLSAPVTPAELASFIAYWQAEGRMFHHV Citrobacter_freundii PV--AVPMGKFAMYAAWQPDADFQRQAALWGVALKEPVTAEELASFVAYWQA-GKVFHHI Enterobacter_aerogenes PV--AVPMGKFAMYAGWQPDADFQRLAALWGIALTQPVTPEELAAFVAYWQAEGKVFHHV Enterobacter_cloacae PV--AVPMGKFAMYAGWQPDADFQRLAALWGIALTQPVTPEELAAFVAYWQAEGKVFHHV Ishikawaella_capsulata --RLTVPLGKFAMYKDWQPDEDLQHCAAIWGIALYEPITAAELAAFVDYWKAEGKLFHHI
* ****:* **** *: : **:**: * *:* ***:*: **:* *::***:
Escherichia_coli QWQQKLARSLQIGRASNGGLP--KRDVNTVSEPDSQIPPGFRG- Pantoea_ananatis QWQQKLARSLQMNRAANGGQP--RRDITQLPNPDSTIPDGFRGE Salmonella_enterica QWQQKLARSVQISRSSNGGMP--QRDINSVSEPDNHIPPGFRG- Klebsiella_pneumoniae QWQQKLARSVQISRASNGGQP--KRDVNSVSEPDSHIPRGFRG- Shigella_flexneri QWQQKLARSLQIGRASNGGLP--KRDVNTVSEPDSQIPPGFRG- Kosakonia_oryzae QWQQKLARSVQIGRSSQNGAA--KRDINALSEPDNQIPPGFRG- Erwinia_gerundensis QWQQKLARSLQVGRATNGGQP--RRDLTQVAEPDHTIPDGFRG- Citrobacter_freundii QWQQKLARSIQIGRASNGGMP--KRDVNSVSEPDSHIPPGFRG- Enterobacter_aerogenes QWQQKLARSVQIGRASNGGQP--KRDVNAISEPDNQIPRGFRG- Enterobacter_cloacae QWQQKLARSVQIGRASNGGQP--KRDVNAISEPDNQIPRGFRG- Ishikawaella_capsulata QWQQKLVRSVYRKRSLKKKYHKDKSHLTDTLIRDFNIPYGFRGE
******.**: *: : : .:. * ** ****
40 60 80
100 120
140 160 179
Figure 2-5. Multiple alignment of DnaT sequences.
Multiple alignment of DnaT sequences was performed with Clustal Omega server
(http://www.ebi.ac.uk/Tools/msa/clustalo/). The residues substituted in this study are
highlighted (orange, substituted in chapter 2; blue, substituted in chapter 3).
31
-15000 -12000 -9000 -6000 -3000 0 3000
200 210 220 230 240 250
[θ] (deg・cm2/dmol)
wavelength (nm)
WT L53S L56S L60S
WT L53S
(A)
(B)
Figure 2-6. CD spectra of DnaTN_LS mutants.
(A) CD spectra of DnaTN mutants L53S, L56S and L60S. DnaTN mutants (20 M) were analyzed at room temperature in 20 mM Tris-HCl buffer (pH 8.5) containing 3 mM NaCl.
(B) The salt-dependence of the CD spectra of DnaTN. Wild-type and mutant L53S of
DnaTN were analyzed at room temperature in 20 mM Tris-HCl buffer (pH8.5) containing
various concentration (3, 15, 100 and 1000 mM) of NaCl.
32
0 8 16 24
Absorbance at 280nm
Elution volume (mL)
WT
L53S
L56S
L60S
Oligomerization analysis of DnaTN_LS mutants by gel filtration chromatography To examine the oligomerization states of DnaTN_LS mutants, I performed gel filtration chromatography. As a result, the chromatograms of L56S and L60S were similar to that of wild-type DnaTN (Fig. 2-7). In contrast, L53S eluted later than wild-type DnaTN (Fig. 2-7). This suggests that Leu53 is involved in the oligomerization of DnaTN as well as the folding of DnaTN.
Figure 2-7. Gel filtration chromatography of DnaTN_LS mutants.
Gel filtration chromatography of DnaTN_LS mutants. The column (Superdex 200 10/300
GL) was eluted with 50 mM Tris-HCl buffer (pH 8.0) containing 30 mM NaCl at a flow
rate of 0.4 mL/min. An additional line was drawn with a grey dotted line.
33 Discussion
From the secondary structure prediction of DnaTN (DnaT
1-88), I found that there is a flexible linker region in the middle of DnaT. This is consistent with the previous study; limited proteolysis of DnaT caused the cleavage between Lys88 and Phe89 [22]. Therefore, it is suggested that DnaT is composed of two domains connected by a flexible linker.
The oligomerization states of DnaTN and its deletion mutants indicated that Val67−Lys88 is not involved in the oligomerization of DnaTN. Taken together with the previous study, which suggested the trimerization of DnaT
42-179[42], Phe42−Asp66 of DnaT would be involved in the oligomerization of DnaT.
The structural analyses of DnaTN mutant L53S indicated that some amino acid residues containing Leu53 are involved in the hydrophobic interaction for proper folding and oligomerization of DnaTN. In the putative oligomerization site of DnaT (Phe42−Asp66), there might be two secondary structures; a hydrophobic -sheet (Phe42−Val45) and an amphipathic -helix (Pro47−Ala61). Therefore, these hydrophobicity might be important for the conformational stability of DnaT oligomers.
On the other hand, it has been suggested that truncation of C-terminal tail
(Asp162−Gly179) of DnaT changes DnaT trimer into dimer [41]. Furthermore, it has
been also suggested that DnaT could form a nucleoprotein filament, similar to RecA
(bacterial DNA recombination protein) [21]. Hence, DnaT might have various
oligomerization states, possibly via the C-terminal region. To explain the structure
of DnaT oligomer in detail, more study is required.
34
Chapter 3
Interaction analysis between PriB and DnaT
Abstract
The aim of this chapter is to elucidate the interaction mechanism between PriB
and DnaT. From the result of the interaction analysis between DnaT and
PriB−ssDNA complex, it was suggested that DnaT dissociates ssDNA from
PriB−ssDNA complex by physical interaction with PriB. To investigate the
interaction site, I prepared several DnaT mutants and PriB mutants. As a result, I
found that the region from Asp66 to Glu76 on the linker of DnaT and the residues
Ser20, His26 and Ser55 on PriB are involved in the PriB−DnaT interaction. Taken
together with the structural information of PriB and DnaT, it is suggested that the
linker region of DnaT enters the groove on the PriB dimer interface, and then
dissociates ssDNA.
35 Introduction
In PriA-dependent pathway, PriA, PriB and DnaT interact each other. The previous report has indicated that PriA interacts with PriB in a DNA-dependent manner; the interaction site for PriB on PriA is exposed by DNA binding of PriA [14].
Similarly, it has been suggested that PriB−DnaT interaction is not robust and is stimulated by the presence of ssDNA [14]. However, the mechanism how ssDNA contributes to PriB−DnaT interaction is still unknown. Moreover, the mechanism of direct, physical interaction between PriB and DnaT remains obscure.
In this chapter, to reveal the structural mechanism of PriB−DnaT interaction in
detail, I performed various interaction analyses using PriB and DnaT mutants. As a
result, I determined the amino acid residues important for the physical interaction
between PriB and DnaT. In particular, the involvement of these residues in
PriB−DnaT binding is not affected by the presence or absence of ssDNA. This finding
allows us to discuss the detail of direct PriB−DnaT interaction.
36 Experimental procedures
Protein expression and purification
To prepare wild-type DnaT and mutant H136A/H137A, E. coli strain BL21(DE3) was transformed with each plasmid, pET22b−DnaT−His
6or pET22b−DnaT_H136A/H137A−His
6, prepared previously [22]. Cells were grown in 500 mL of LB medium at 37 °C to an OD
600of 0.6, and then IPTG was added to a final concentration of 1 mM followed by induction for 20 hr at 20 °C. The cells were harvested and resuspended in 50 mM Tris-HCl buffer (pH 8.5), and then lysed by 0.2 mg/mL of lysozyme. Insoluble material was removed by centrifugation. DnaT was precipitated by the addition of solid (NH
4)
2SO
4to a final concentration of 0.3 g/mL.
The (NH
4)
2SO
4pellet was resuspended in 50 mM Tris-HCl buffer (pH 8.5), and dialyzed to dilute the concentration of (NH
4)
2SO
4. The dialyzed sample was applied to a Ni Sepharose 6 Fast Flow column (GE Healthcare Life Sciences, Little Chalfont, UK, 1.5 × 3 cm) that was equilibrated with the same Tris buffer. After washing the column with 50 mL of the Tris buffer containing 40 mM imidazole, DnaT was eluted in a stepwise manner with the Tris buffer containing 400 mM imidazole. Fractions containing DnaT were collected and dialyzed against the Tris buffer.
PriB was prepared as described in chapter 1. DnaTN and DnaT
1-69were
prepared as described in chapter 2.
37 EMSA
Indicated amounts of FITC-labeled oligo-dT35 and proteins were incubated for 30 min at 25 °C in 50 mM Tris-HCl buffer (pH 7.5) containing 50 mM KCl, 5 mM MgCl
2and 5 % glycerol. The reaction mixtures were resolved by polyacrylamide gel electrophoresis (200 V at 4 °C in 1× TBE) under non-denaturing conditions. FITC- labeled oligo-dT35 was detected with an NF-1050B Blue LED illuminator (Nihon Eido, Tokyo, Japan). The intensity of the band was analyzed using ImageJ software (https://imagej.nih.gov/ij/).
Preparation of DnaT 60-88
To gain isotopically labeled DnaT
60-88peptide, isotopically labeled DnaTN was
prepared by E. coli expression system. E. coli strain BL21(DE3) containing the
pET22b−His
6−DnaT
1-88plasmid was grown in M9 minimal medium containing
13C-
labeled -
D-glucose and
15N-labeled NH
4Cl. Other expression and purification
processes were performed as described in chapter 2. The purified
13C/
15N-labeled
DnaTN (1.2 mg) was treated with 5 g of Lysyl Endopeptidase® (Wako, Osaka,
Japan) at 35 °C for 4 hr in 100 mM Tris-HCl buffer (pH 8.0). The digested products
were separated on a TSKgel® ODS-120T column (TOSOH, Tokyo, Japan) using an
LC-20AD HPLC system (Shimadzu, Kyoto, Japan). A linear gradient of acetonitrile
in water (20−45 % v/v, in 40 min) containing 0.05 % TFA at a flow rate of 0.8 mL/min
was maintained, and elution peaks were detected at 215 nm and 280 nm. The
collected peptide was confirmed by MALDI-TOF mass spectrometric analyses with
an AutoFlex III (Bruker Daltonics, Billerica, MA).
38
NMR measurements and main-chain assignment of DnaT 60-88
NMR spectra were recorded at 30 °C on a Varian Unity INOVA 600 spectrometer (Varian, Palo Alto, CA). NMR samples (25 M) of
13C/
15N-labeled DnaT
60-88were dissolved in 20 mM HEPES buffer (pH 6.5) containing 100 mM (NH
4)
2SO
4and 10 % D
2O. A series of three-dimensional (3D) triple-resonance experiments (HNCA, HN(CO)CA, HNCBCA, CACBCONH, HNCO, HN(CA)CO) was recorded for the spectrum assignments of the main-chain of DnaT
60-88. NMRPipe [44] was used to process the data. The resonance peak of each amino acid residue was assigned using Olivia (fermi.pharm.hokudai.ac.jp).
Preparation of protein mutants
To prepare PriB and DnaTN mutants, point mutations were incorporated into the protein expression plasmids by the megaprimer method [31] with the primers summarized in Table 3-1. The DNA fragments were ligated into pET-22b(+) plasmid and were confirmed by DNA sequencing. The mutants were expressed and purified by the same methods used for wild-type proteins.
Circular dichroism (CD) spectral analysis
DnaT
60-88(20 M) was dissolved in deionized water. Wild-type or mutant DnaTN
(30 M) was dissolved in 25 mM Tris-HCl buffer (pH 8.5) containing 10 % glycerol
and 15 mM NaCl. Wild-type or mutant PriB (20 M) was dissolved in 25 mM HEPES
buffer (pH 6.5) containing 50 mM (NH
4)
2SO
4. The CD spectra were recorded as
described in chapter 1.
39
primer sequence
5’-primer of His6-DnaT1-88 CGCAAGCTTCATATGCACCACCACCACCACCACTCTTCCAGAGTTTTGACCCCG 3’-primer of His6-DnaT1-88 CGGGATCCTCATTTCCCCATGGGTACAGCAAC
DnaT1-88_D70A GAGTTGATCGGCCAGAGCGAC DnaT1-88_D66A CCGGGAAGCGCCGTCGCTCTGG DnaT1-88_Y74A GACGATCAACTCGCCCAGGAACCGC 5’-primer of PriB GCAAGCTTCATATGACCAACCGTCTGGTGTTG 3’-primer of PriB GGCGGGATCCCTAGTCTCCAGAATCTATCAATTCAAT PriB_S20A GAATTCCTGATGGGGCGACCTTTCG
PriB_S55A CCGTTATTGTTGCCGGACACGAAAAC
Precipitation assay
Indicated amounts of PriB and DnaTN were mixed and incubated for 2 hr at room temperature in 50 mM MES buffer (pH 6.5) containing 100 mM (NH
4)
2SO
4. After centrifugation at 14,000 × g for 10 min, the supernatant and precipitate were separated. The samples were then assessed by SDS-PAGE. The proteins were visualized by Coomassie Brilliant Blue R-250 staining. The intensity of the band was analyzed using ImageJ software (https://imagej.nih.gov/ij/).
Isothermal titration calorimetry (ITC)
Calorimetric experiments were performed at 30 °C with a MicroCal Auto-iTC
200instrument (GE Healthcare Life Sciences, Little Chalfont, UK). PriB and DnaTN were dialyzed at 4 °C against 20 mM HEPES buffer (pH 6.5) containing 100 mM (NH
4)
2SO
4. Titrations were performed as follows; 240 M DnaTN was injected (1 × 0.4 L and 18 × 2 L) into 20 M PriB solution. The delay time between the injections was 3 min. Data were analyzed using MICROCAL ORIGIN software.
Table 3-1. Primer sequences used in this chapter.
40 Crystallization and data collection
PriB_S55A was dialyzed against 50 mM HEPES buffer (pH 6.5) containing 100 mM (NH
4)
2SO
4. Crystals were grown using the sitting drop vapor diffusion method at 20 °C. One microliter of 7.7 mg/mL PriB_S55A was mixed with 1 L of reservoir solution containing 0.1 M HEPES (pH 7.0), 1.65 M (NH
4)
2SO
4and 2 % PEG400. The reservoir volume was 500 L. All diffraction data sets were collected at SPring-8 (Hyogo, Japan) beamline BL38B1. The data were processed and scaled with the HKL2000 program package (HKL Research, Inc., Charlottesville, VA).
Structure determination and refinement
The structure determination and refinement of PriB_S55A were performed using
the Phenix software suite [45]. The structure was solved by molecular replacement
with the program Phaser [46] using wild-type PriB (Protein Data Bank accession
code 1V1Q) as the search models. Two PriB molecules were observed in an
asymmetric unit. Refinement was performed with phenix.refine [47] followed by
manual rebuilding of the refined coordinates in the program Coot [48]. Diffraction
data statistics and refinement statistics are shown in Table 3-2. Coordinates and
structure factors have been deposited in the Protein Data Bank under accession code
5WQV. Figures were drawn using PyMOL (Schrödinger, New York, NY).
41
Table 3-2. Crystallographic data collection and refinement statistics.
PriB S55A Data collection
Beamline BL38B1
Space group P 2
12
12
1Number of crystals 1
Cell dimensions
a, b, c (Å) 49.9, 59.1, 65.1
(°)
90.0, 90.0, 90.0
Resolution (Å) 50.0 – 1.97 (2.00 – 1.97)*
R
merge0.093 (0.465)*
CC
1/2of the highest-resolution shell 0.902
I/I 35.3 (5.2)*
Completeness (%) 96.8 (99.9)*
Redundancy 6.9 (7.1)*
Refinement
Resolution (Å) 39.6 – 1.97
No. reflections 13581
R
work0.2306
R
free0.2792
No. atoms
protein 1451
water 97
Average B-factor 28.0
R.m.s. deviations
Bond lengths (Å) 0.007
Angles (°) 1.017
Ramachandran plot
Favored (%) 98.9
Allowed (%) 1.1
Disallowed (%) 0.0
* Statistics for the highest resolution shell are shown in parentheses.
42 Results
Dissociation of ssDNA from PriB−ssDNA complex by DnaT assessed by EMSA Previous study suggested that DnaT interacts with PriB−ssDNA complex prior to apo-PriB, and dissociates ssDNA from PriB−ssDNA complex [14]. To reveal the ssDNA dissociation mechanism in detail, I performed an interaction assay between DnaT and PriB−ssDNA complex using EMSA. After incubation of PriB with FITC- labeled oligo-dT35, wild-type DnaT was added to the mixture. The mixture was subjected to native gel electrophoresis, and then the fluorescence of FITC-labeled oligo-dT35 was detected. In the absence of wild-type DnaT, the bands derived from PriB−ssDNA complexes were detected (Fig. 3-1A, lane 4, 7, 10). The addition of wild- type DnaT caused a significant band shift (Fig. 3-1A, lane 6, 9, 12), implying the interaction between PriB−ssDNA complex and wild-type DnaT. Since wild-type DnaT have an affinity for ssDNA (Fig. 3-1A, lane 2, 3), it was unclear whether or not wild-type DnaT interacted with PriB directly.
Furthermore, I carried out the experiment using DnaT_H136A/H137A instead of
wild-type DnaT. DnaT_H136A/H137A is the mutant, which is defective in ssDNA
binding (Fig. 3-1B, lane 2, 3) [22]. As a result, the band intensity of free ssDNA
increased as the concentration of DnaT_H136A/H137A increased (Fig. 3-1B, lane 6,
9, 12), suggesting that DnaT_H136A/H137A dissociates ssDNA from PriB−ssDNA
complex by direct interaction with PriB.
43
0 250 5000
0 250 500 40
0 250 500 80
0 250 500
160 PriB (pmol)
wild-type DnaT (pmol)
←free ssDNA PriB-ssDNA
1 2 3 4 5 6 7 8 9 10 11 12
Band shift
0 250 500 0
0 250 500 40
0 250 500 80
0 250 500
160 PriB (pmol)
DnaT_H136A/H137A (pmol)
←free ssDNA PriB-ssDNA
1 2 3 4 5 6 7 8 9 10 11 12