How do free trade agreements change import prices? : firm‑level evidence from China's imports from ASEAN
著者 Hayakawa Kazunobu, Yang Chih‑Hai
権利 Copyrights 日本貿易振興機構(ジェトロ)アジア
経済研究所 / Institute of Developing
Economies, Japan External Trade Organization (IDE‑JETRO) http://www.ide.go.jp
journal or
publication title
IDE Discussion Paper
volume 436
year 2013‑12‑01
URL http://hdl.handle.net/2344/1291
INSTITUTE OF DEVELOPING ECONOMIES
IDE Discussion Papers are preliminary materials circulated to stimulate discussions and critical comments
Keywords: Free trade agreement, prices, FTA utilization JEL classification: F10; F13; F15
* Researcher, JETRO Bangkok, JETRO ([email protected])
IDE DISCUSSION PAPER No. 436
How Do Free Trade Agreements Change Import Prices?: Firm-level Evidence from China’s Imports from ASEAN
Kazunobu HAYAKAWA* Chih-Hai YANG December 2013
Abstract The literature has revealed the positive impacts of free trade agreements (FTAs) on export prices by employing product-level trade data. This paper empirically examines the impacts of FTAs on import prices at the firm level. We focus on firm-level imports in China from ASEAN countries by employing China’s firm-product-level trade data. As a result, controlling for firm characteristics and product characteristics, we could not find significantly positive impacts of an FTA’s entry into force on import prices of FTA eligible products. Instead, we found a significant increase in import quantities of FTA eligible products. Thus, at the firm level, the gains from FTAs for exporters may be the increase in export quantities rather than the rise in export prices.
The Institute of Developing Economies (IDE) is a semigovernmental, nonpartisan, nonprofit research institute, founded in 1958. The Institute merged with the Japan External Trade Organization (JETRO) on July 1, 1998.
The Institute conducts basic and comprehensive studies on economic and related affairs in all developing countries and regions, including Asia, the Middle East, Africa, Latin America, Oceania, and Eastern Europe.
The views expressed in this publication are those of the author(s). Publication does not imply endorsement by the Institute of Developing Economies of any of the views expressed within.
INSTITUTE OF DEVELOPING ECONOMIES (IDE), JETRO 3-2-2, WAKABA,MIHAMA-KU,CHIBA-SHI
CHIBA 261-8545, JAPAN
©2013 by Institute of Developing Economies, JETRO
No part of this publication may be reproduced without the prior permission of the IDE-JETRO.
1
How Do Free Trade Agreements Change Import Prices?:
Firm-level Evidence from China’s Imports from ASEAN
Kazunobu HAYAKAWA#§
Bangkok Research Center, Japan External Trade Organization, Thailand
Chih-Hai YANG
Department of Economics, National Central University, Taiwan
Abstract: The literature has revealed the positive impacts of free trade agreements (FTAs) on export
prices by employing product-level trade data. This paper empirically examines the impacts of FTAs on import prices at the firm level. We focus on firm-level imports in China from ASEAN countries by employing China’s firm-product-level trade data. As a result, controlling for firm characteristics and product characteristics, we could not find significantly positive impacts of an FTA’s entry into force on import prices of FTA eligible products. Instead, we found a significant increase in import quantities of FTA eligible products. Thus, at the firm level, the gains from FTAs for exporters may be the increase in export quantities rather than the rise in export prices.
Keywords: Free trade agreement, prices, FTA utilization JEL Classification: F10; F13; F15
1. Introduction
The effects of free trade agreements (FTAs) on prices have received little public attention. Although such price effects of FTAs are based on “tariff path-through”, which refers to how much prices change according to tariff changes, it has been little known compared with “exchange rate path-through”. Due to the saving of tariff payment in
# Corresponding author: Kazunobu Hayakawa; Address: Bangkok Research Center, Japan External Trade Organization, 16th Floor, Nantawan Building, 161 Rajadamri Road, Pathumwan, Bangkok 10330, Thailand; Tel: 66-2-253-6441; Fax: 66-2-254-1447; E-mail:
§ This research was conducted as part of a project of the Japan External Trade Organization
“Comprehensive Analysis on Consequence of Trade and Investment Liberalization in East Asia”. We would like to thank Takamune Fujii, Toshihiro Ichida, Yasuhiro Takarada, and Taiyo Yoshimi for their invaluable comments.
2
importing products, FTAs reduce the market prices of those products. Such decrease in market prices leads to the increase in demand for those products and thus exerts pressure to push up market prices. As a result, export prices rise but will be less than the amount of the original tariff rates. This “tariff path-through” is important because it shows how the tariff rent through FTAs is shared between exporters and importers.
Namely, clarifying the price effects of FTAs contributes to deepening our understanding on how firms can benefit from FTAs.
The academic study on price effects of FTAs has focused on changes in product-level trade prices through FTAs. Feenstra (1989) initially examines the effects of tariffs and exchange rates on US prices of Japanese automobile products and finds that the tariff pass-through relation varies across products, ranging from about 0.6 for trucks to unity for motorcycles. The positive impact of FTAs on export prices is also witnessed in NAFTA where the prices received by Mexican textile and apparel exporters rise by around 80% of the tariff margin (Cadot et al., 2005). Ozden and Sharma (2006) examine the US Caribbean Basin Initiative’s impact on the prices received by eligible apparel exporters and found that export prices rise by around 65%
of tariff margin. However, African apparel exporters capture only 16%-53% of tariff rent under the African Growth and Opportunity Act (AGOA) (Olarreaga and Ozden, 2005). The limited studies suggest the need for more empirical studies. In sum, the previous studies found positive impacts of FTAs on trade prices. This means that both exporters and importers benefit from FTAs. Compared with the prices set before the presence of FTAs, while exporters can sell their products at higher prices, importers can purchase those products at lower prices.
However, the estimates in these previous papers suffer from biases due to omitting firm characteristics. Cadot et al. (2005) compare prices under MFN with those under FTA using the aggregated data. However, as demonstrated in Demidova and Krishna (2008)1, exporters under MFN and FTA are systematically different in terms of, say, productivity. Also, Olarreaga and Ozden (2005) pointed out the role of importers’
market power in determining trade prices. Thus, differences in prices between those two tariff schemes contain differences in exporter/importer characteristics. The strategy in Olarreaga and Ozden (2005), which is to compare prices under an FTA scheme with those under an MFN scheme before the FTA’s entry into force, also does not eliminate this bias because only some specific exporters/importers turn out to use an FTA scheme after an FTA’s entry into force. In order to uncover a more precise picture of the tariff
1 Demidova and Krishna (2008) introduces the choice of tariff schemes into the firm-heterogeneity model of Melitz (2003).
3
rent sharing between importer and exporter, it is important to obtain estimates that do not suffer from these biases.
In this paper, we examine such price effects of FTAs at the firm level. Specifically, we explore changes in import prices from ASEAN countries2 for ASEAN-China FTA (ACFTA) eligible products before and after ACFTA’s entry into force. The Agreement on Trade in Goods was signed in 2004 and implemented on 1 July 2005 by the ASEAN countries and 20 July 2005 by China.3 China gradually has become the largest trade country, accounting for 13% of world trade in 2011. To examine firm-level price effects of FTAs for China, we employ China’s firm-level trade data constructed by merging two datasets: transaction-level international trade data and firm-level production data.4 ACFTA is suited to this analysis because “reciprocal tariff rate treatment” in ACFTA, of which details are explained later, makes our identification of FTA impacts better. Due to this treatment, FTA eligibility differs by not only products (and year) but also exporting member countries. Our use of importer-side data enables us to conduct our cross-export country analysis at a detailed level, i.e., the harmonized system (HS) eight-digit level.
While eligibility for FTAs in general is set at the tariff-line level in each country, the use of exporter side data forces us to do the analysis at an internationally-comparable level, i.e., the HS six-digit level.
This paper contributes greatly to the academic literature in at least two ways. First, in the literature on the price effects of FTAs, our firm-level analysis can avoid the above-mentioned biases because we can directly control for firm characteristics. Thus, unlike those in the previous studies, our estimates do not suffer from biases from omitting firm characteristics and do not contain differences in firm characteristics.5
2 Those include Brunei, Cambodia, Indonesia, Laos, Malaysia, Myanmar, Philippines, Singapore, Thailand, and Viet Nam.
3 Under this Agreement, the six original ASEAN members and China have to eliminate tariffs on 90% of their products by 2010, while Cambodia, Laos, Myanmar, and Viet Nam have until 2015 to do so. For more details, see http://www.fta.gov.sg/fta_acfta.asp?hl=2. For the development of the ASEAN-China FTA, see Chirathivat (2002) and Tongzon (2005) for comprehensive discussions.
4 The transaction-level data are the same as those used in Manova and Zhang (2012), which found that firms set higher export prices in richer, larger, bilaterally more distant, and overall less remote countries.
5 However, one matter to note is that, since our dataset does not enable us to differentiate directly trade values under MFN schemes from those under FTA schemes, we are forced to assume that all firms trading products eligible for FTA schemes use FTA schemes in trading. Under this assumption, we examine at the firm-product-origin-level how trade prices change in FTA eligible products before and after an FTA’s entry into force, compared with FTA ineligible products. In order to relax this assumption, we restrict sample firms to specific firms, such as productive firms, in our empirical analysis. As for studies using product-level trade data that differentiates tariff schemes, see Bureau et al. (2007), Cadot et al. (2006), Francois et al. (2006), Manchin (2006), Hakobyan (2010), and Keck and Lendle (2012).
4
Second, our analysis of trade prices at the firm level is related to the price-quality literature. For example, Baldwin and Harrigan (2011) and Johnson (2012) theoretically explore the relationship between producer (exporter) productivity and product prices under the model with product quality differentials. Gorg et al. (2010) empirically examines this relationship at the firm-product-destination level and finds a positive relationship. In this literature, our paper is the first one that examines the role of importer productivity in import prices at the firm-product-origin level.
The rest of this paper is organized as follows. The next section presents our theoretical framework on the effects of firms’ FTA utilization on their products’ prices.
Section 3 takes a brief look at China’s imports from ASEAN countries before and after ACFTA’s entry into force. In Section 4, we specify our empirical framework for examining the impacts of ACFTA’s entry into force on import prices of ACFTA eligible products at the firm level and describe the data. Empirical estimations and some further robustness checks are presented in Section 5. The final section concludes this paper.
2. Theoretical Discussion
This section discusses theoretically the effects of FTA on product prices. To do that, we first list the general determinants of prices and then summarize the effects of firms’ FTA utilization on their products’ prices.
2.1. General Determinants of Prices
Several factors affect firm-level product prices. Particularly in our context, the following country characteristics are important determinants of pries. Under perfect competition, those are set to marginal costs depending on factor prices in exporting countries such as wages, intermediate goods prices in exporting countries, and so on.
Under imperfect competition, on the other hand, demand size in importing countries and the degree of competition in importing countries (e.g., the elasticity of substitution or the number of competitors) play an important role in determining product prices (e.g., Dixit and Stiglitz, 1977; Krugman, 1979; Brander and Krugman, 1983; Ottaviano, Tabuchi, and Thisse, 2002). The degree of heterogeneity in preferences in importing countries also becomes one of the determinants (e.g., Fajgelbaum, Grossman, and Helpman, 2011). Taking trade costs (e.g., MFN rates or FTA rates) between exporting and importing countries into account, the model shows the significant effects of trade costs on prices, of which details are discussed later.
The recent trade theory places much emphasis on firm characteristics, particularly
5
on exporter productivity. Melitz (2003) and Yeaple (2005) model the firm heterogeneity in terms of producer productivity. The degree of competition in importing countries is incorporated in Melitz and Ottaviano (2008). In these models, as well as the cases of the above models, the productive producers have lower product prices. On the other hand, Baldwin and Harrigan (2011), Kugler and Verhoogen (2012), and Johnson (2012) introduce a quality dimension into this firm heterogeneity framework. In such models with product-quality differences, the productive producers have higher product prices due to producing higher quality products. In either case, exporter productivity plays a significant role in determining prices.
In addition to these roles of exporter characteristics, importer characteristics may also play an important role in determining prices. First, as demonstrated in Kugler and Verhoogen (2012), the more productive firms procure inputs with higher quality. Thus, the more productive firms may import the more expensive inputs (i.e., the higher import prices in the more productive firms). Second, if product prices are assumed to be determined through bargaining between the seller and buyer, the buyer’s (i.e., importer’s) market power has significant influence on product prices. Without any quality differences across inputs, for example, firms with the higher market power or productivity can import inputs at cheaper prices. In this case, the more productive firms have the lower import prices. Just as exporter productivity played a significant role in determining prices, importer productivity is one of the determinants of prices as well.
Empirical studies support the significant roles of the above factors. Manova and Zhang (2012) find in China’s exports that firm-level export prices are higher in exports to countries with a larger market size, higher income, and higher trade costs (longer geographic distance). Bastos and Silva (2010) found similar results for Portuguese exports. In short, these country-level factors are empirically found to be the significant determinants of prices. In addition to the relationship with these country-level factors, the findings in Gorg et al. (2010) for Belgium exports are the higher export prices in the more productive or the smaller-sized firms. Thus, the evidence concerning the relationship with firm-level productivity in Belgium exports is favorable to prediction of the models involving product quality differences.
2.2. Price Effects of FTA
In this subsection, we discuss in detail the effects of firms’ FTA utilization on their products’ prices. In particular, we focus on firm-product-destination changes in prices. To make the discussion more precise, we define three kinds of prices: export prices, import prices, and market prices. The import prices include transport costs in
6
addition to export prices. Then, the market prices include tariffs in addition to import prices. However, in our discussion, by assuming for simplicity no transport costs for trading, we make import prices equal to export prices. Thus, we call export prices and import prices “trade prices”. Under this setting, there are two kinds of effects:
market-driven effects and bargaining-driven effects. We consider first the market-driven effects and then the bargaining-driven effects.
The market-driven effects of FTA use on trade prices are as follow.6 Let Pi, pi, and ti denote market prices in importing under tariff scheme i (FTA or most-favoured nation (MFN)), trade prices under tariff scheme i, and (ad-valorem) tariff rates under scheme i, respectively. Namely, it holds that Pi = pi (1 + ti). We assume that FTA preferential tariff rates are zero while MFN rates are positive. For simplicity, the downward-sloping (import) demand curve and the upward-sloping (export) supply curve are also assumed. Under these settings, the market price Pi will be lowered before and after the FTA utilization because FTA rates tFTA (= 0) are lower than MFN rates tMFN; PFTA < PMFN. However, PFTA will not be simply equal to pMFN (1 + tFTA), i.e., pMFN. In other words, pFTA and pMFN will not be the same because the reduction of market prices P increases the demand on the products. As a result, it will hold that pFTA
> pMFN. Nevertheless, it will hold that PMFN = pMFN (1 + tMFN) > pFTA = PFTA, otherwise market prices in the case of the FTA scheme become higher than those in the case of the MFN scheme. Namely,
0 < (pFTA − pMFN) / pMFN < tMFN. (1) This inequality is called “incomplete path-through” in tariff changes.
The bargaining-driven effects are a little complicated.7 Exporters must bear some costs for FTA utilization and do much documentation work despite the fact that importers enjoy the direct benefits from it (i.e., duty-free imports). As is well known, in using an FTA scheme, exporters need to comply with rules of origin (RoOs). To do that, they may need to change their procurement sources from the optimal pattern of procurement. Such a change of procurement sources will raise total procurement costs.
Furthermore, to certify the “originality” of their products, exporters must collect several kinds of documents, including a list of inputs, production flow chart, production instructions, invoices for each input, contract documents, and so on. With these documents, exporters submit certificates of origin (CoOs) to the authority in exporting countries. In order to encourage exporters to bear such costs for FTA utilization and to
6 For more detailed and theoretically rigorous discussion on “market-driven effects”, see Feenstra (1989), Feenstra (2004, Ch. 7), and Winters and Chang (2000).
7 See, for example, Olarreaga and Ozden (2005).
7
do such documentation work to apply for CoOs, importers need to give some benefits to exporters. As one such benefit, importers may allow exporters to raise export prices.
In sum, while in the market-driven perspective, the reduction of market prices through duty-free imports increases the demand for imported products and thus raises those trade prices, the bargaining-driven perspective shows the rise of trade prices based on the bargaining process to encourage exporters to obtain CoOs. The bargaining-driven effects are more important in the context of FTA schemes because the reduction of MFN rates yields the market-driven effects but not the bargaining-driven effects since firms do not need to comply with RoOs when exporting under MFN rates. In this sense, the price effects of FTAs are qualitatively different from those of the reduction of MFN rates. The consequent empirical studies at the product level on price effects of FTAs, e.g., Cadot et al. (2005), Olarreaga and Ozden (2005), and Ozden and Sharma (2006), overall support the positive effects of FTAs on trade prices. However, as mentioned in the introductory section, the estimates in these product-level studies suffer from various kinds of biases. In order to tackle such biases, this paper empirically examines the price effects of FTAs at the firm level.
3. China’s Imports from ASEAN under ACFTA
In this section, we take a brief look at China’s imports from ASEAN countries. To do that, we use the firm-product-country-year import data merged from two Chinese databases. One is the transaction-level import data provided by the Department of Customs Trade Statistics, the General Administration of Customs of China. Those data provide detailed information on the company name, eight-digit HS product code, product unit, quantity, total values, type of ownership, origin, destination, and type of trade. The other is the Large- and Medium-sized Enterprise Survey conducted by the National Bureau of Statistics (NBS) covering all state-owned manufacturing enterprises and the non-state-owned manufacturing enterprises with sales of over five million Chinese yuan (RMB). This dataset includes firms’ information on sales, employment, capital, and so on. The rule of matching between these two datasets is to identify the same company in the two databases by exactly the same company name (in Chinese).
For firms having similar names in the two databases, we use the zip code as the criterion for implementing further compilation.
With those data, we compare firm-product-origin-level imports between 2003 and 2006. In particular, we shed light on the product eligibility for ACFTA schemes, for which the Agreement on Trade in Goods was implemented in 2005. Namely, firms in
8
China imported any products under the MFN scheme in 2003 but could import products eligible for ACFTA under the FTA scheme in 2006. In this section, we examine how the changes in imports from 2003 to 2006 are different for ineligible and eligible products.
The period of 2003-2006 is selected not only because the year ACFTAs entered into force (i.e., 2005) falls in the middle but also because we can keep the same HS version, HS2002. Thus, we do not need to be concerned about the consistency of HS codes across the years and can easily examine time-series changes in trade at a very detailed level. Below, we focus on trade in manufacturing products (i.e., excluding trade in products listed in HS01-HS24).8 As a result, our merged dataset identifies imports by manufacturing firms, products (HS eight-digit in HS25-97), exporting countries (ASEAN countries), and years (2003 and 2006). Our observations by exporting countries are presented in the Appendix.9
One unique point in ACFTA is the existence of “reciprocal tariff rate treatment”.
Roughly speaking, this treatment allows each member not to give preferential access to a product to members who do not sufficiently open that product on an ACFTA or MFN basis. For example, even if China liberalizes a product in ACFTA, China can impose MFN rates (i.e., non-preferential rates) on imports of that product from an ASEAN country if that ASEAN country does not liberalize that product in ACFTA or does not have sufficiently low MFN rates for that product.10 This treatment means that products eligible for the ACFTA scheme as exports to China differ by ASEAN country.
The number of ACFTA eligible products in China in 2006 is reported in Table 1.
The information on ACFTA eligibility and tariff rates in China was obtained from the WITS-TRAINS database.11 While only around 10% of all products (tariff-line level) are eligible in the case of exports from Cambodia, Laos, and Viet Nam, around 40% are
8 In 2002, ASEAN and China signed the Framework Agreement on Comprehensive Economic Cooperation between ASEAN and China. Based on this agreement, some agricultural products were liberalized in 2004 as an early harvest program. In order to avoid including the effects from this program, we focus on manufacturing imports.
9 In our sample, no firms import from Brunei. Also, it does not include imports by trading companies because of our merging with the Large and Medium-sized Enterprise Survey, which focuses on manufacturing firms.
10 More specifically, Annex 2 in the Agreement on Trade in Goods says: The reciprocal tariff rate treatment of tariff lines placed by a Party in the Sensitive Track shall be governed by the following conditions: (i) the tariff rate for a tariff line placed by a Party in the Sensitive Track must be at 10%
or below in order for that Party to enjoy reciprocity; (ii) the reciprocal tariff rate to be applied to a tariff line placed by a Party in the Sensitive Track shall be either the tariff rate of that Party’s tariff line, or the Normal Track tariff rate of the same tariff line of the other Party or Parties from whom reciprocity is sought, whichever is higher; and (iii) the reciprocal tariff rate to be applied to a tariff line placed by a Party in the Sensitive Track shall in no case exceed the applied MFN rate of the same tariff line of the Party or Parties from whom reciprocity is sought.
11 https://wits.worldbank.org/WITS/WITS/Restricted/Login.aspx
9
eligible in the case of exports from the other ASEAN countries. Also, we can see that the means of the tariff margin (difference between MFN rates and ACFTA rates) are much higher in Cambodia, Laos, and Viet Nam. In short, we may say that these three countries have preferential access to China in a small number of products with a large tariff margin.
=== Table 1 ===
Table 2 reports firm-product-origin-level “extensive margin” in ineligible and eligible products separately. “Entry” indicates the number of firm-product-origin observations which do not exist in 2003 but do exist in 2006. “Exit” indicates that of firm-product-origin observations which exist in 2003 but do not exist in 2006. “Stay”
indicates that of firm-product-origin observations which exist in both 2003 and 2006.
Taking a look at shares, we can see that there are no remarkable differences between the ineligible and eligible products. The highest share can be found in “Entry” (around 55%), followed by “Exit” (34%-40%). “Stay” shows around a 10% share, which is the lowest. Thus, firms in China started actively importing from ASEAN countries after ACFTA’s entry into force.
=== Table 2 ===
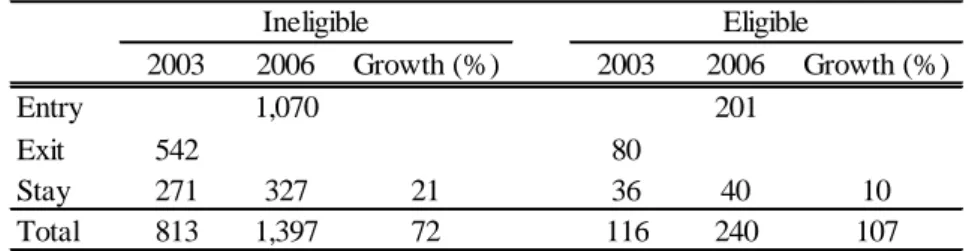
The changes in imports are reported in Table 3 according to the above-mentioned status (i.e., Entry, Exit, and Stay). There are three noteworthy points. First, imports of eligible products in 2006 occupied 15% (= 240 / (1,397 + 240)). Second, as is not consistent with our expectations, imports with a status of “Stay” grew more rapidly in ineligible products (21%) than in eligible products (10%). Third, total imports of eligible products (107%) experienced a rapider increase than those of ineligible products (72%). This finding is consistent with the regular expectation that, thanks to preferential tariff rates, imports of eligible products grow more rapidly. Combining these findings, we may say that the more remarkable increase of imports in eligible products is sourced from the increase of imports in extensive margin (i.e., Entry) rather than that in intensive margin (i.e., Stay).
=== Table 3 ===
Table 4 reports the average changes in import prices and quantities from 2003 to
10
2006. In this table, we restrict sample observations only to those with a status of “Stay”
in Tables 2 and 3. The prices are computed by dividing import values by import quantities. In our dataset, the quantity unit is either kilogram or piece. The unit differs by HS eight-digit products, not by years or firms. As is consistent with our expectation formalized in the previous section, import prices in eligible products rise by 28% before and after ACFTA’s entry into force. However, this rise is not more significant than that in ineligible products (82%). Namely, the import prices rise more greatly in ineligible products than in eligible products. The import quantities decrease in both ineligible (−34%) and eligible products (−14%). Nevertheless, the decreasing rates are smaller in eligible products. However, it might be problematic to compare prices and quantities not only across products with different units but also across products with the quantity unit of kilogram. The regression analysis, which is conducted in the next section, will enable us to compare those undertaking such a unit issue into account.
=== Table 4 ===
4. Empirical Framework
This section specifies our empirical framework for examining the impacts of ACFTA’s entry into force on import prices of ACFTA eligible products in manufacturing firms in China. Then, our dataset is introduced.
4.1. Empirical Specification
As mentioned in the introductory section, due to the possibility of analysis at a very detailed HS level, we focus on import prices rather than export prices. The same dataset as in the previous section is used in our empirical analysis. Our basic equation to be estimated is the following.
ln Pricesfipt = α ACFTAipt + Xft β + uit + εfipt (2)
The dependent variable is a log of prices in firm f’s imports of product p from country i in year t. ACFTAipt takes the value one if product p from country i in year t is eligible for ACFTA in China. If FTA utilization raises trade prices as discussed in Section 2.2, we will obtain significantly positive α. Xft is a vector of variables capturing importing firm f’s characteristics in year t. In order to completely control for export country-year characteristics such as factor prices and intermediate goods prices, we introduce export
11
country-year fixed effects, uit. Since we focus on a single country’s imports, the export country-year fixed effects also control for importer-year characteristics such as demand sizes and extent of competition. εfipt is an error term.
In the above specification, our introduction of explanatory variables on firm characteristics controls for the qualitative differences in prices sourced from the differences in firm characteristics. This control in the analysis of price effects of FTAs is our major contribution to the literature. In order to control more for those differences, we also introduce firm dummy variables later. However, one item to note is that we do so only for importer characteristics, not for exporter characteristics. In addition, the above specification does not take into account the effect of MFN rates on prices. As mentioned in Section 2, the reduction of MFN rates also has a market-driven effect on trade prices. This effect will be controlled later by introducing tariff-line level dummy variables. Such tariff-line level dummy variables also control for the effects of differences in quantity units across products.
Our firm-level explanatory variables, i.e., X, include some importer characteristics.12 As discussed in Section 2.1, importer productivity plays a significant role in determining trade prices. Thus, as a variable for productivity, we introduce the firm’s total factor productivity (TFP). In order to tackle unobserved productivity shocks in the estimation of production function for obtaining TFP, we use the TFP measure developed by Levinsohn and Petrin (2003).This method uses intermediate inputs as a proxy for unobservable productivity shocks and obtains a consistent estimator of TFP.
Also, we introduce a capital-labor ratio (KL ratio) for a proxy for technology though it shows the actual use of production factors rather than fundamental capital intensity for producing products. As a variable for factor prices, wage rates are included (Wages). We also include importer’s age (Age), i.e., years from the firm establishment. All variables are taken logs.
4.2. Data Source
As mentioned previously, the dataset used is within-firm-origin-product import data merged from two Chinese databases: Customs data and the Large- and Medium-sized Enterprise Survey by NBS. More specifically, our dependent variable is constructed by employing the customs data, while firm-level variables are done by
12 Thus, among the elements specified in Section 2.1, only exporter characteristics are not controlled in our analysis. We expect that significant exporter characteristics are correlated with importer characteristics through the matching process between exporter and importer (see, for example, Blum et al., 2010), so that our inclusion of importer characteristics variables also control for significant exporter characteristics to some extent.
12
using the survey data from NBS. Also, the information on ACFTA eligibility and tariff rates in China is again obtained from the WITS-TRAINS database. To compare price changes before and after the ACFTA that went into effect in 2005, we use data of the years 2003 and 2006 to represent the before-and-after ACFTA periods, respectively. As mentioned in the previous section, our datasets include data on imports of manufacturing products from ASEAN countries by manufacturing firms.
Our use of importer-side data has both advantages and disadvantages. First, import prices (cif prices) include not only export prices (fob prices) but also freight and insurance costs. However, such costs will not change much, depending on FTA utilization. Namely, at least in the case of our analysis, there are no qualitative differences between the use of import prices and that of exporter prices. Thus, our estimates will be comparable with those in the previous studies on the effects of FTAs on export prices. Second, as mentioned in the introductory section, the use of importer-side data enables us to conduct our cross-export country analysis at HS eight-digit level. Moreover, since the quantity unit (e.g., kilogram) in our dataset is different across HS eight-digit codes (i.e., tariff-line codes), the use of importer-side data enables us to avoid the mix of different quantity units in our analysis.
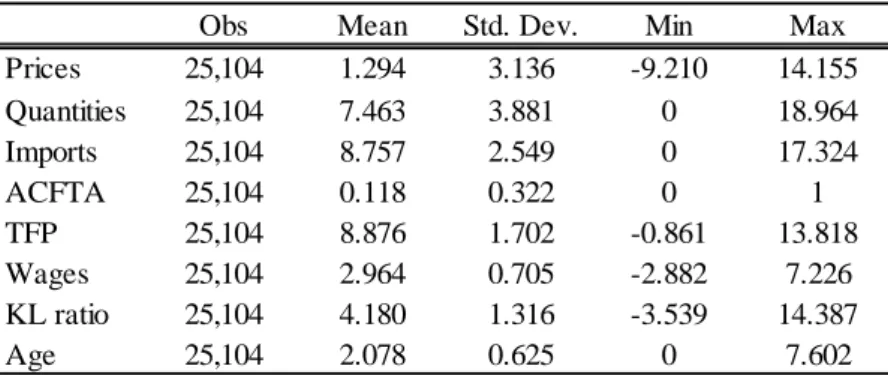
There are two more noteworthy points.First, since our data restrict sample firms only to manufacturing importers, observations consist basically of international trade flow in intermediate goods rather than that in finished goods. Thus, compared with the case of international trade in finished goods, the bargaining-driven effect may play a more significant role in the case of that in intermediate goods than the market-driven effect. Second, our data include only firms with sales of over RMB5 million, i.e., large firms. This restriction may lower our estimates in the ACFTA dummy because large importers have large bargaining power in price negotiation. The basic statistics for our empirical analysis are provided in Table 5.
=== Table 5 ===
5. Empirical Results
In this section, we report our estimation results for equation (2). After presenting our baseline results, we conduct some robustness checks on our results and then some more kinds of analysis on the firm-level impacts of FTAs.
5.1. Baseline Results
13
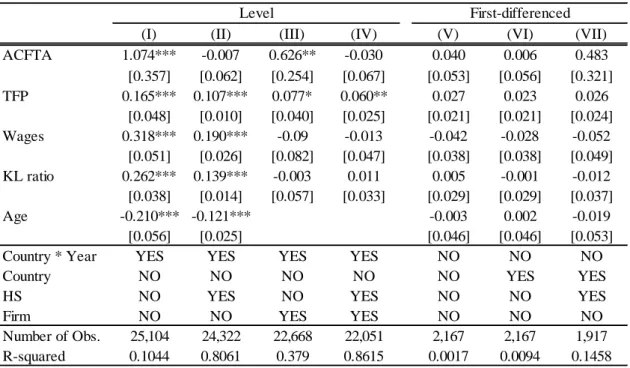
The baseline results are reported in Table 6. Column (I) shows the results for equation (2). As is consistent with our expectation, the estimated coefficient for ACFTA is significantly positive. However, its magnitude looks quantitatively too large; import prices of ACFTA eligible products rise by 193% (=exp(1.074)−1) after ACFTA’s entry into force. As shown in Table 1, the tariff margin is at most 65%. Thus, our estimate does not meet condition (1). The results in firm-level variables are as follow. The more productive or capital intensive importers have the higher import prices. As mentioned in Section 2.1, this result of higher import prices among the more productive importers is favorable to prediction from the models with product-quality differences. In addition, we can see that the importers with the higher wages or the younger importers have significantly higher import prices.
=== Table 6 ===
We add some kinds of dummy variables to equation (2) in order to control more fixed effects. Column (II) includes HS eight-digit dummy variables to control for product-specific effects, such as the differences in quantity units or the market-driven effects through the reduction of MFN rates between 2003 and 2006. As a result, column (II) shows qualitatively-unchanged results for firm-level variables but an insignificant coefficient for the ACFTA dummy. On the contrary, in column (III), which controls time-invariant firm characteristics, the coefficients for only ACFTA and TFP are estimated to be significant. Specifically, the result in ACFTA implies that when products turn out to be eligible for ACFTA, the import prices rise by 87%, which still does not fall into the range specified in condition (1). Column (IV) controls for both product and firm characteristics and shows that only TFP has a significant coefficient.
Furthermore, we also estimate the first-differenced version of equation (2), which is given by:
ln (Pricesfip2006 / Pricesfip2003) = α ACFTAip2006 + (Xf2006 − Xf2003)β + ui + εfip. (3)
For variable Age, we introduce Agef2003, not (Agef2006 − Agef2003). This specification completely eliminates time-invariant, firm-export and country-product characteristics.
The estimation results are reported in columns (V)-(VII), in which the specification includes no fixed effects, export country fixed effects only, and both export country fixed effects and product fixed effects, respectively. All coefficients are estimated to be
14
insignificant, maybe due to the drastic decrease in the number of observations. In sum, we could not find robust and reasonable impacts of ACFTA’s entry into force on import prices of ACFTA eligible products.
5.2. Sample Restriction
In Table 7, we restrict the sample only to some specific firms and estimate the model controlling for both product and firm fixed effects. First, in column (I), we restrict only to firms with an average TFP (between 2003 and 2006) above its sample mean. So far, we assume that all firms trading FTA eligible products use FTA schemes.
As mentioned in the introductory section, however, the international transactions by productive exporters and/or importers are likely to be under FTA schemes. Thus, we estimate our model only for productive importers. The results show no significant coefficients for all variables. The insignificant result in TFP will be due to our restriction of the sample to productive firms, i.e., small variation in the TFP variable.
=== Table 7 ===
Second, column (II) in Table 7 restricts only to foreign-owned importers. This restriction is also for relaxing our assumption that all firms trading FTA eligible products use FTA schemes. One of the major reasons for not using FTA schemes is simply because firms do not know about FTA schemes at all (Hayakawa et al., 2013).
Namely, they do not know what FTA is and how beneficial it is for their activities. On the other hand, foreign-owned firms will have relatively much knowledge on international activities including FTA schemes and may be more likely to use FTA schemes if their products are eligible for FTA schemes. Another reason for this restriction is that international trade by foreign-owned firms may follow a different mechanism on the price effects of FTAs because they seem to be more likely to trade with affiliates within the same firm group, i.e., intra-firm trade. In the case of intra-firm trade, the way of tariff-rent sharing might be different, for example, due to transfer pricing. However, the estimation results do not change qualitatively. Except for TFP, all variables including the ACFTA dummy are insignificantly estimated.
Last, in column (III), we simply drop outliers in our sample. Specifically, we exclude observations with import prices below the 1st percentile or above the 99th percentile. However, we again found that, except for TFP, coefficients for all variables including the ACFTA dummy are insignificantly estimated. In sum, we conclude that, at least on average, the ACFTA eligible products do not experience a more significant rise
15
in import prices than the ACFTA ineligible products.
5.3. Further Analyses
We further conduct some estimation. First, in order to again take into account the differences in FTA utilization according to firm productivity, as in column (I) in Table 7, we now introduce the interaction term of the ACFTA dummy with TFP. The results are reported in Table 8. The coefficients for the ACFTA dummy are still insignificant in columns (I)-(III). In column (III), its interaction with TFP has a significantly positive coefficient, but then the coefficient for TFP is also insignificant. In column (IV), however, the ACFTA dummy, TFP, and their interaction have significant coefficients.
The latter two variables have significantly positive coefficients, while the coefficient for the ACFTA dummy is negatively estimated. Table 5 reports that the highest productivity among our sample firms is around 14. Thus, firms with such productivity gain the benefits of the positive impacts of ACFTA’s entry into force on import prices (0.208 =
−0.478 + 14*0.049). More specifically, “0.208” indicates that the import prices of ACFTA eligible products rise by 23%, which is a reasonable magnitude, after ACFTA’s entry into force. As a result, we may say that only importers with very high productivity use FTA schemes and raise import prices by around 20%.
=== Table 8 ===
Second, we introduce the continuous variable on ACFTA eligibility rather than its binary variable. So far, we have just examined the average difference in import prices between ACFTA eligible and ineligible products. As formalized in condition (1), however, there is more room to raise import prices in the case of eligible products with the larger tariff margin. As a result, we may expect that the rise in import prices is larger among importing products with a larger tariff margin. To examine this, we introduce a tariff margin in ACFTA, which is named “Margin”, instead of an ACFTA dummy. By definition, the tariff margin variable takes zero for all observations in 2003. Also, it does so for observations of ACFTA ineligible products in 2006. Only observations of ACFTA eligible products in 2006 take non-zero values in the tariff margin variable. The results are provided in Table 9. From the qualitative point of view, the results are unchanged compared with those in Table 6. The coefficients for Margin are significantly estimated only in columns (I) and (III). Also, while the variable of TFP has significantly positive coefficients in all specifications, the coefficients for the other firm-level variables are insignificant if controlling for firm fixed effects.
16
=== Table 9 ===
Last, we also examine the impacts of ACFTA’s entry into force on import quantities of ACFTA eligible products. Specifically, we estimate equation (2) for import quantities, controlling for both firm and product fixed effects. The results are reported in columns (I)-(IV) in Table 10. As in Table 7, we also estimate our model for some kinds of restricted samples. Three points are noteworthy. First, the coefficients for the ACFTA dummy are estimated to be significantly positive in all kinds of samples except for the
“High TFP” sample. Specifically, import quantities of ACFTA eligible products increase by around 16% after ACFTA’s entry into force. Thus, taking a closer look at the impacts at the firm level, we may say that those are increases in trade volume rather than a rise in trade prices. Second, the coefficients for TFP are significantly and positively estimated in all kinds of samples, indicating that the productive firms import more.
Third, the other firm-level variables do not have any significant effects on import quantities. The results in the first differenced version, i.e., equation (3), for import quantities, are also reported in columns (V)-(VII). Although the coefficients for TFP remain significantly positive, those for ACFTA turn out to be insignificant. The drastic decrease in the number of observations may be the main reason for the difference in the results in the ACFTA dummy between level and first-differenced equations.
=== Table 10 ===
6. Concluding Remarks
While the recent studies on price effects of FTAs employ product-level trade data, this paper empirically examines at the firm level the impacts of an FTA’s entry into force on import prices of FTA eligible products, compared with those on import prices of FTA ineligible products. We focus on firm-level imports in China from ASEAN countries by employing China’s firm-product-level trade data. With our dataset, we can control for firm characteristics and product characteristics and can avoid suffering from some of the biases in previous studies. As a result, we could not find significantly positive impacts of ACFTA’s entry into force on import prices of ACFTA eligible products. Instead, we found a significant increase in import quantities of ACFTA eligible products by around 16%. These results are robust because our several kinds of specification show qualitatively similar results.
17
Our estimates indicate how exporters obtain gains from FTAs. It is obvious that importers can save tariff payments by importing under FTA schemes. This saving is a typical and direct gain from FTA utilization. However, exporters need to do more administrative work for trading under FTA schemes than importers despite the fact that the direct gainers are importers. Thus, without any gains, exporters will not export under FTA schemes. Our estimation results suggest that the gain from FTAs for exporters is the increase in export quantities rather than the rise in export prices. Before starting administrative work, an increase in export quantities might be accepted by importers during the negotiation of trade.
Last, we point out one limitation of our estimates. Unlike the estimates in Cadot et al. (2005) and Olarreaga and Ozden (2005), our estimates do not contain the qualitative differences in prices (through the choice of tariff schemes) across firms.
However, our estimates suffer from biases from the changes in non-members’ behavior, while those in Cadot et al. (2005) and Olarreaga and Ozden (2005) do not contain such biases because they employ product-level trade data that can differentiate tariff schemes (e.g., MFN scheme or FTA scheme). For example, Ozden and Sharma (2006) compare prices from FTA partners with those from the rest of the world using aggregated data.
As found in Chang and Winters (2002) and Winters and Chang (2000), non-FTA partners lower their prices because the duty-free supplies provided by partners yield fiercer competition. Thus, differences between these prices found in Ozden and Sharma (2006) overestimate the impacts of FTA on members’ export prices. Our estimates in this paper also suffer from these kinds of biases though our estimates already show an insignificant rise in export prices. In short, there are two kinds of sources for biases, i.e., differences across firms and those between FTA member and non-member countries. In order to eliminate both kinds of biases, it is necessary to employ firm-level trade data that can differentiate tariff schemes.
18
Appendix. Our Observations by Exporting Country
2003 2006
Indonesia 937 1,576
Cambodia 3 6
Myanmar 13 25
Malaysia 2,623 4,045 Phillipines 908 1,729 Singapore 3,191 3,625 Thailand 2,222 3,688
Viet Nam 161 352
19
References
Baldwin, R. and Harrigan, J., 2011, Zeros, Quality and Space: Trade Theory and Trade Evidence, American Economic Journal Microeconomics, 3, 60–88.
Blum, B., Claro, S., and Horstmann. I., 2010, Facts and Figures on Intermediated Trade, American Economic Review, 100(2): 419-423.
Bastos, P. and Silva, J., 2010, The Quality of a Firm’s Exports: Where You Export to Matters, Journal of International Economics, 82(2), 99-111.
Brander, J. and Krugman, P., 1983, A “Reciprocal Dumping” Model of International Trade, Journal of International Economics, 15(3-4), 313-321.
Bureau, J., Chakir, R., and Gallezot, J., 2007, The Utilisation of Trade Preferences for Developing Countries in the Agri-food Sector, Journal of Agricultural Economics, 58(2): 175-198.
Cadot, O., Carrere, C., de Melo, J., Portugal-Perez, A., 2005, Market Access and Welfare under Free Trade Agreements: Textiles under NAFTA, World Bank Economic Review, 19(3): 379-405.
Cadot, O., Carrere, C., De Melo, J., and Tumurchudur, B., 2006, Product-specific Rules of Origin in EU and US Preferential Trading Arrangements: An Assessment, World Trade Review, 5(2): 199-224.
Chang, W. and Winters, L., 2002, How Regional Blocs Affect Excluded Countries: The Price Effects of MERCOSUR, American Economic Review, 92(4): 889-904.
Chirathivat, S., 2002, ASEAN–China Free Trade Area: Background, Implications and Future Development, Journal of Asian Economics, 13(5): 671-686.
Demidova, S. and Krishna, K., 2008, Firm Heterogeneity and Firm Behavior with Conditional Policies, Economics Letters, 98(2): 122-128.
Dixit, A. and Stiglitz, J., 1977, Monopolistic Competition and Optimum Product Diversity, American Economic Review, 67(3), 297-308.
Fajgelbaum, P., Grossman, G., and Helpman, E., 2011, Income Distribution, Product Quality, and International Trade, Journal of Political Economy, 119(4), 721 - 765.
Feenstra, R., 1989, Symmetric Pass-through of Tariffs and Exchange Rates under Imperfect Competition: An Empirical Test, Journal of International Economics, 27(1-2): 25-45.
Feenstra, R., 2004, Advanced International Trade: Theory and Evidence, Princeton University Press: Princeton and Oxford.
Francois, J., Hoekman, B., and Manchin, M., 2006, Preference Erosion and Multilateral Trade Liberalization, World Bank Economic Review, 20(2): 197-216.
20
Gorg, H., Halpern, L., and Muraközy, B., 2010, Why Do within Firm-product Export Prices Differ across Markets?, Kiel Working Paper No. 1596.
Hakobyan, S., 2012, Accounting for Underutilization of Trade Preference Programs:
U.S. Generalized System of Preferences, mimeo, University of Virginia.
Hayakawa, K., Hiratsuka, D., Shiino, K., and Sukegawa, S., 2013, Who Uses Free Trade Agreements?, Asian Economic Journal, 27(3): 245-264.
Johnson, R., 2012, Trade and Prices with Heterogeneous Firms, Journal of International Economics, 86(1), 43–56.
Keck, A. and Lendle, A., 2012, New Evidence on Preference Utilization, World Trade Organization, Staff Working Paper ERSD-2012-12.
Kugler, M. and Verhoogen, E., 2012, Prices, Plant Size, and Product Quality. Review of Economic Studies, 79, 307–339.
Krugman, P., 1979, Increasing Returns, Monopolistic Competition, and International Trade, Journal of International Economics, 9(4), 469-479.
Levinsohn, J. and Petrin, A., 2003, Estimating Production Functions Using Inputs to Control for Unobservables, Review of Economic Studies, 70(2): 317-341.
Manova, K. and Zhang, Z., 2012, Export Prices across Firms and Destinations, Quarterly Journal of Economics, 127: 379-436.
Manchin, M., 2006, Preference Utilisation and Tariff Reduction in EU Imports from ACP Countries, The World Economy, 29(9): 1243-1266.
Melitz, M., 2003, The Impact of Trade on Intra-industry Reallocation and Aggregate Industry Productivity, Econometrica, 71, 1695-1725.
Melitz, M. and Ottaviano, G., 2008, Market Size, Trade, and Productivity, Review of Economic Studies, 75(3), 985-985.
Olarreaga, M. and Ozden, C., 2005, AGOA and Apparel: Who Captures the Tariff Rent in the Presence of Preferential Market Access?, The World Economy, 28(1):
63-77.
Ottaviano, G., Tabuchi, T., and Thisse, J., 2002, Agglomeration and Trade Revisited, International Economic Review, 43(2), 409-436.
Ozden, C. and Sharma, G., 2006, Price Effects of Preferential Market Access: Caribbean Basin Initiative and the Apparel Sector, World Bank Economic Review, 20(2):
241-259.
Tongzon, J.L., 2005, ASEAN‐China Free Trade Area: A Bane or Boon for ASEAN Countries?, The World Economy, 28(2): 191-210.
Winters, L. and Chang, W., 2000, Regional Integration and Import Prices: An Empirical Investigation, Journal of International Economics, 51(2): 363-377.
21
Yeaple, S.R., 2005, A Simple Model of Firm Heterogeneity, International Trade, and Wages, Journal of International Economics, 65(1), 1-20.
22
Table 1. Products Eligible for ACFTA and Tariff Margin in 2006
Number Share Mean Max
Brunei 3,243 0.43 4.4 45
Indonesia 3,121 0.41 4.4 45
Cambodia 730 0.10 13.4 30
Laos 651 0.09 13.2 30
Myanmar 3,322 0.44 4.6 45
Malaysia 3,144 0.41 4.5 45
Philippines 3,021 0.40 3.5 45
Singapore 3,313 0.44 4.4 45
Thailand 3,334 0.44 5.9 65
Viet Nam 491 0.06 14.3 30
Eligible Products Tariff Margin (%)
Source: WITS-TRAINS Database
23
Table 2. ACFTA and the Extensive Margin in China’s Imports from ASEAN Countries from 2003 to 2006
Number Share (%) Number Share (%)
Entry 10,332 56 2,561 52
Exit 6,232 34 1,976 40
Stay 1,792 10 401 8
Total 18,356 4,938
Ineligible Eligible
Source: Authors’ calculation using customs data.
Notes: “Ineligible” and “Eligible” refer to products ineligible and eligible for ACFTA in 2006,
respectively. “Entry” indicates the number of firm-product-origin observations which did not exist in 2003 but did exist in 2006. “Exit” indicates that of firm-product-origin observations which did exist in 2003 but did not exist in 2006. “Stay” indicates that of firm-product-origin observations which did exist in both 2003 and 2006.
24
Table 3. Changes in Imports according to ACFTA Eligibility from 2003 to 2006 (million RMB)
2003 2006 Growth (%) 2003 2006 Growth (%)
Entry 1,070 201
Exit 542 80
Stay 271 327 21 36 40 10
Total 813 1,397 72 116 240 107
Ineligible Eligible
Source: Authors’ calculation using the Customs data
Notes: “Ineligible” and “Eligible” are products ineligible and eligible to ACFTA in 2006,
respectively. “Entry” indicates the number of firm-product-origin observations which do not exist in 2003 but do exist in 2006. “Exit” indicates that of firm-product-origin observations which exist in 2003 but do not exist in 2006. “Stay” indicates that of firm-product-origin observations which exist in both 2003 and 2006.
25
Table 4. Changes in Import Prices and Quantities from 2003 to 2006 according to ACFTA Eligibility (%)
Prices Quantities
Ineligible 82 -34
Eligible 28 -14
Total 55 -24
Source: Authors’ calculation using the Customs data
Note: These figures are the average growth of import prices and quantities among observations with a status of “Stay” (i.e., firm-product-origin observations which existed in both 2003 and 2006).
“Ineligible” and “Eligible” refer to products ineligible and eligible for ACFTA in 2006, respectively.
26
Table 5. Basic Statistics
Obs Mean Std. Dev. Min Max
Prices 25,104 1.294 3.136 -9.210 14.155
Quantities 25,104 7.463 3.881 0 18.964
Imports 25,104 8.757 2.549 0 17.324
ACFTA 25,104 0.118 0.322 0 1
TFP 25,104 8.876 1.702 -0.861 13.818
Wages 25,104 2.964 0.705 -2.882 7.226
KL ratio 25,104 4.180 1.316 -3.539 14.387
Age 25,104 2.078 0.625 0 7.602
Note: All variables except for ACFTA are taken logs.
27
Table 6. Baseline Results
(I) (II) (III) (IV) (V) (VI) (VII)
ACFTA 1.074*** -0.007 0.626** -0.030 0.040 0.006 0.483
[0.357] [0.062] [0.254] [0.067] [0.053] [0.056] [0.321]
TFP 0.165*** 0.107*** 0.077* 0.060** 0.027 0.023 0.026
[0.048] [0.010] [0.040] [0.025] [0.021] [0.021] [0.024]
Wages 0.318*** 0.190*** -0.09 -0.013 -0.042 -0.028 -0.052
[0.051] [0.026] [0.082] [0.047] [0.038] [0.038] [0.049]
KL ratio 0.262*** 0.139*** -0.003 0.011 0.005 -0.001 -0.012
[0.038] [0.014] [0.057] [0.033] [0.029] [0.029] [0.037]
Age -0.210*** -0.121*** -0.003 0.002 -0.019
[0.056] [0.025] [0.046] [0.046] [0.053]
Country * Year YES YES YES YES NO NO NO
Country NO NO NO NO NO YES YES
HS NO YES NO YES NO NO YES
Firm NO NO YES YES NO NO NO
Number of Obs. 25,104 24,322 22,668 22,051 2,167 2,167 1,917
R-squared 0.1044 0.8061 0.379 0.8615 0.0017 0.0094 0.1458
Level First-differenced
Notes: The dependent variable is a log of import prices in column “Level” and the log difference of
import prices in column “First-differenced”. All variables except for ACFTA are taken logs. The parentheses are cluster errors by HS eight-digit code. ***, **, and * show 1%, 5%, and 10%
significance, respectively. ACFTA takes the value one if a firm’s imported products from an ASEAN country in 2006 are eligible for the ACFTA scheme.
28
Table 7. Robustness Checks: Sample Restriction
(I) (II) (III)
ACFTA 0.024 -0.030 -0.039
[0.094] [0.071] [0.067]
TFP 0.020 0.053** 0.049*
[0.040] [0.025] [0.026]
Wages 0.006 -0.021 0.023
[0.060] [0.051] [0.047]
KL ratio -0.052 0.034 0.005
[0.053] [0.035] [0.030]
Country * Year YES YES YES
HS YES YES YES
Firm YES YES YES
Sample High TFP FOCs Outliers
Number of Obs. 11,907 19,555 21,632
R-squared 0.8527 0.8616 0.8555
Notes: The dependent variable is a log of import prices. All variables except for ACFTA are taken
logs. The parentheses are cluster errors by HS eight-digit code. ***, **, and * show 1%, 5%, and 10% significance, respectively. ACFTA takes the value one if a firm’s imported products from an ASEAN country in 2006 are eligible for the ACFTA scheme. In the sample of “High TFP”, we restrict sample firms only to firms with TFP above the median among all sample firms. “FOCs”
includes only foreign-owned firms as sample firms. In the sample “Outliers”, we drop observations with import prices below the 1st percentile or above the 99th percentile.
29
Table 8. Interaction with TFP
(I) (II) (III) (IV)
ACFTA 0.369 -0.202 -0.873 -0.478*
[0.441] [0.244] [0.560] [0.249]
TFP 0.156*** 0.104*** 0.059 0.055**
[0.052] [0.011] [0.041] [0.025]
ACFTA * TFP 0.080 0.022 0.163** 0.049*
[0.066] [0.028] [0.077] [0.029]
Wages 0.318*** 0.190*** -0.096 -0.015
[0.051] [0.026] [0.082] [0.047]
KL ratio 0.262*** 0.139*** -0.004 0.01
[0.038] [0.014] [0.057] [0.033]
Age -0.211*** -0.121***
[0.056] [0.025]
Country * Year YES YES YES YES
HS NO YES NO YES
Firm NO NO YES YES
Number of Obs. 25,104 24,322 22,668 22,051
R-squared 0.1046 0.8061 0.3794 0.8616
Notes: The dependent variable is a log of import prices. All variables except for ACFTA and Margin
are taken logs. The parentheses are cluster errors by HS eight-digit code. ***, **, and * show 1%, 5%, and 10% significance, respectively. ACFTA takes the value one if a firm’s imported products from an ASEAN country in 2006 are eligible for the ACFTA scheme.