Thesis
The Trends of Global Tritium Precipitations
Taeko
KOGA,Hiroshi
KAWAI,Hiroshige
MORISHIMAand Takeo
NIWA(Received September 29, 1984)
The trends of global tritium precipitation from 1953 to 1979 were estimated based on the tritium data published in seven volumes of Environmental Isotope Data published by International Atomic Energy Agency (lAEA). Tritium precipitation samples were collected from 342 stations in the world and tritium concentrations were measured by IAEA and 27 laboratories. Due to repeated atmospheric nuclear explosions tritium precipitations showed maximum peak in 1963. After the agreement of the Partial Test Ban Treaty in 1964 they have gradually decreased until now showing seasonal variations. To obtain clear trends of tritium precipitations, seasonal and irregular factors were eliminated from the data original time-series using M200H at the Computer Center of the University of Tokyo.
Results of analyses were as follows; a) Peak concentrations and precipitations of tritium were observed every year around the period of late spring to summer. b) The maximum annual tritium concentration and precipitation were observed in 1963 for northern hemisphere stations. c) A latitude effect was observed in the northern hemisphere. The maximum concentrations and precipitations were seen a the latitude of approximately 50 ON. d) Con- tinental stations always showed higher tritium concentrations and precipitations than comparable maritime stations.
KEYWORDS
tritium, tritium precipitation, nuclear explosion test, time series analysis.
In trod uction
Tritium in the nature is produced by the reaction of fast neutron in cosmic rays with atmospheric nitrogen, i. e. 14N (n,3H) 12C, or by the direct ejection of 3H from cosmic-ray stars1,2).
Production rate is estimated to be about 1 atom/cm2 of earth surface per second3). Most of the tritium produced by cosmic-rays would soon be oxydized to form water and come down to the earth surface with precipitation, namely rain or snow. Since tritium decays out by its half-life 12.3 years, its concentration 3H/1H in natural waters such as rainwater, river water, ground water, lake water and seawater has been in the order of 10-18•
After the World War II a lot of atmospheric nuclear explosion tests were made mainly in the Pacific Ocean until 1963, the year of the atmospheric and hydrospheric explosion test ban treaty (Partial Test Ban Treaty). A large part of tritium produced by these nuclear explosion tests,
oj:>.
[.,;)
HALLEY BAY IOFF MAP
•
I~
MARION IS
•
• TBILISI
NOVOSIBIRSK
•
• • TASHKENT
NEW DELHI
•
•
DIEGO GARCIA
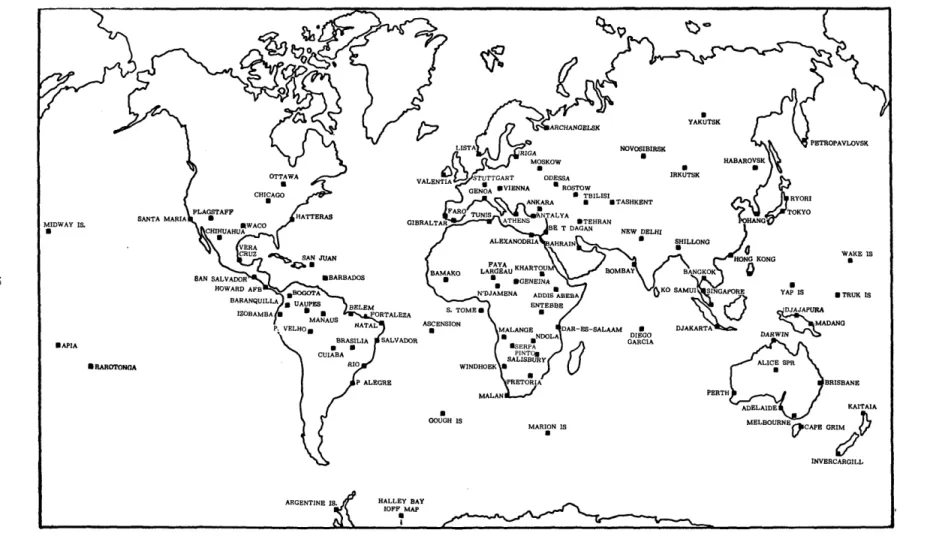
Fig. 1 IAEAjWMO precipitation networkIO).
•
YAKUTSK
•
IRKUTSK
PERTH
•
YAP IS
WAKE IS
•
.TRUK IS
BRISBANE
KAITAIA
ADELAlDE\..a...J
Tt.
MELBOURNE ~CAPE GRIM
V
(/l
INVERCARGILL
~ o
G') >
(II
8"
...:J ::r (II
...:J
'"1 (II
::l p...
Ul
o ...
c;J
'"1
o 0""
~
...:J
a· ;:.
3
'"0
'"1 (II (')
'§: g
o·
::lUl
which was far greater than that of naturally produced tritium, was stored in the stratosphere and gradually came down to troposphere showing seasonal variations. Measurement of global tritium precipitations is important not only for monitoring industrial tritium release but also for accumulating fundamental data for the future energy production using nuclear fusion.
The International Atomic Energy Agency (lAEA) and the World Meteorological Organization (WMO) have been jointly conducting a world-wide survey of tritium, deuterium and oxygen-18 in precipitation since 1961. Tritium is the nuclide of principal interest of the project. Sample collection began in early 1961 at 342 stations in 65 countries. The sampling network is shown in Fig. 1 10). About half of the stations have been continuously active. Samples are usually ground level precipitations for one month. The samples are sent from the collection station to IAEA and 27 cooperating tritium laboratories for measurement of their tritium concentration. The data including the name of a station, code, latitude, longitude, altitude, year, month, precipitation (mm), type (rain or snow), concentrations of tritium (TU, tritium unit, 3H/IH X 1018) , deuterium and oxygen-18 have been recorded and published as Environmental Isotope Data No. 1",,-,74-10
),
totaling 2293 pages.
We estimated the global trends of tritium precipitations by analysing these data. In addition, the data measured in Osaka, Japan (Kinki University) and Neuherberg, W. Germany, were also analysed, though they are not the stations in the IAEA data lists. An outline of tritium measure- ment at Kinki University was introduced in the Reference 15).
MIAMI.USA -.Original
·--Trend
"" " """ u flr"f~ 1"f
102 • • •
,96. '965' ,966 .967'1968 1969' '970' 19i' '1972'19.3 1974 1975' '976'1977 '9~8"9i91 pCl/m2
xlol
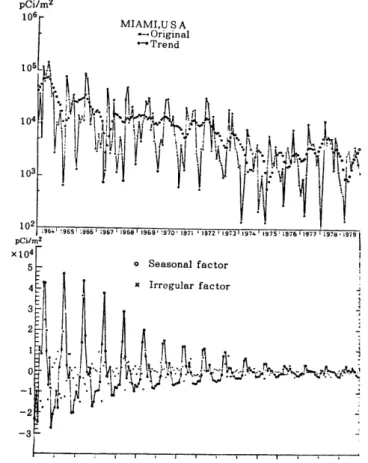
IFig. 2 Comparison between original data and its trend (Miami).
KOGA etc: The Trends of Grobal Tritium Precipitations
Methods
Tritium concentration (TU) has often been used for describing the level of tritium precipita- tion11). Actually it showed a peak in the period between 1961 and 1964, when a number of atmospheric nuclear explosion tests were carried out. But, if the amount of precipitation is small, the absolute level of tritium precipitation is low even though the tritium concentration is high, Therefore we adopted the monthly tritium precipitations expressed in pCijm2 that had been calculated by the following equation;
monthy tritium precipitation=precipitation (mm) X tritium concentration (TU) X 3.24
Original data thus derived are assumed to consist of three components, i. e. the trend factor, the seasonal factor and the irregular factor. Then we separated the trend factor of tritium pre- cipitations from the original time series data with a computer code named EPA code developed by the Economic Planning Agency of Japan using M280H at the Computer Center of the University of Tokyo. The EPA code extracts the trends from the original data based on a method taking moving averages repeatedly. Stations from which more than 36 continuous data are available were selected for EPA analyses. Vacant data were filled up by an interpolation from the adjacent data. Fig. 2 shows an example of comparison between original variation of tritium precipitation at Miami (USA) and its trend calculated, together with the seasonal factor and the irregular factor.
General observation on global tritium distribution
The trends of tritium precipitations were classified into seven areas:
1. Europe VI. USSR
II. North America and Canada VII. Polar regions III. South America
IV. Eastern Asia and Northern Pacific V. Southern Pacific
106
....
pCi/m2
. .
~ .: ...
,,:.
'.
.'. r-./.: .. ,~ ~
105 ___
t .. , ___ ' ___ ._._ --__ ,: __
'::~__________
,~,,__ : _____ __ .: ....
<t.:::.. ~.",.,,",\---, - -. - --- --,---.- - -- - - -.:.--- --- --•
. ....,..
. , ,.. •• A .. _ ... ,..
:.... "..
: •••• , . ' ... -' • •. '.
-...... r. """'...
I.~·.. .
.: '. ,...: ''''. :N' .•.•..• :". • '.: . :' ... • ; ... , ..•••. ,... ___
t-o ... ~~ •• .,."....,..,.. ~ 104 ________ : __ ~ _____!:: _________
~.~__ :_ .' _______ -__ --__ --'_ :;;- _:: -_ .. ___ ::-:-::":':":'.-;:.:' ___ :"1,:
/~_.>;(:_
~.,. '.
• • OTTAWA. CANADA
103'- - -- - - ---.-- --_ .• ----. - --- - --- .• --- -- • VALENTIA. IRELAND'· - .--- •• - -.-. - - - -. - _. - - - -- •• ,
102 ----' ! ! ! ! 1 !
Number of Atmospheric Nuclear Explosions 100 .
50-
~
O~i"""'''''"
Fig. 3 Trends at Valentia and Ottawa with number of nuclear explosion tests.Time series data are available between the period from 1953 to 1979 for Ottawa station (Canada).
and from 1961 to 1979 for Valentia (Ireland) and some other stations. In the case of the other stations. the periods of available data were comparatively shorter.
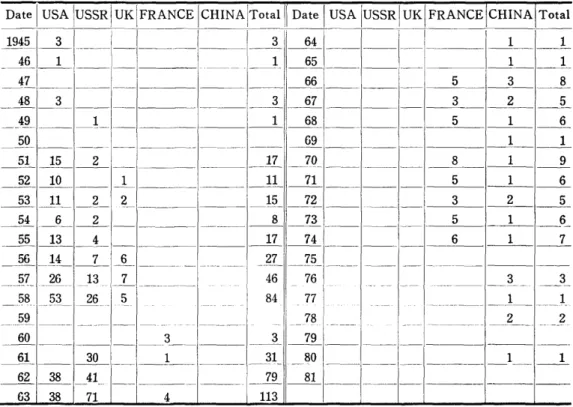
Fig. 3 shows the trends of tritium precipitations for Ottawa and Valentia stations with the annual number of atmospheric nuclear explosion tests (Table
O.
Though the number of nuclear tests does not always directly correspond to the amount of released tritium. it could be an indi- cator of environmental contamination by this nuclide. This figure shows two large peaks at the maxima of nuclear test numbers in 1958 and 1963.Results of analysis exhibited the following common characteristics:
a) Peak concentrations and precipitations of tritium were observed every year around the period of late spring to summer. This phenomenon was supposed to be caused by the tritium input from stratosphere in this season and is called spring peak.
b) The maximum annual tritium concentration and precipitation were observed in 1963. This appeared to be true for all northern hemisphere stations.
c) A latitude effect was observed in the northern hemisphere. The maximum concentrations and precipitations were seen at the latitude of approximately 50 ON. The effect was not so clear in the southern hemisphere.
d) Continental stations always showed higher tritium concentrations and precIpItations than comparable maritime stations. This effect is usually attributed to the dilution of high tritium content by water vapour of low tritium content from the ocean surface.
e) Trend curves of numerous sites showed decreasing tendency after 1972.
Table 1 Number of atmospheric nuclear explosion tests
Date I USA IUSSRIUKIFRANCE
ICHINAITot~111
Date I USA IUSSR!UKIFRANCE!CHINA!Total~~9~::~ _- _-~= =_~_~ _~ ~-~-=I======~:--~_I~~ _-~_ :: __ ~_~I __ ~ ___ ~~_ ~
_4L ______ , _____ , ___ - - ~~---I---'----I---"'--
5 3 8_4_8 _3 _ _ _ _ _ 1- - - -1- - - 3 __ 6_7 _ _ _ _ _ _ 1 - - - - = - - 1 - - = -3 2 5
5 1
49 1 1 68
- - - - - - - 1 - - - 1 - - - 1 - - - 1 - - - 6
--~ - -- - - - -- - - - - _____ 6_9 _ _ _ _
--I----I----=--I----=--
1 1~ ~_2 _____________ ~ __
lL _IQ_ - - -__ - - ____
8 1 - - - -1 9~~L __
1~~
_ _ _ _ _ _I----I---
5 1 _ _ 615 72
----~-- - - - - - - 1 - - - = - - - - 1 - - - ' - - -
53 11 2
--~ .. - - - 2 3 2 5
_5±-_§ _ _ _ 2_ __8_ ~ _ _ _ _ _ _ 1 - - - = - - - - 1 - - - " ' - -5 1 6
~~_4 ______ ~_~ _ _ _ ~ ~ _________ 1 - - - - 1 - - -6 1 7
27 75
--- - - - - - - - - -----~ - - - -
57 26 18 _7 _________ _
58 53 26 5 - - - - - ---- --
59 - - - - -
46 84
76 77 78
3 3
-----~ -~---
1 1
________ ~ _ _ _ _ _ -_0 _ _ _ - -
2 2
---~---
~ _ _ _ _ _ _ _ 3 _ _ _ _ _ _ _ _ 3 ~ _ _ - - - I . - - - - J - - - -
~ _ _ ~ _ _ _ _ 1_~ ______
3L
_~O _ _ _ _ _ _ I---~-_1 _ _ _ 1~~
_31 __ - - _ _
~_ ~ ~----_____
1 _ _ 1 _ _ _ _ 1 _ _ _ 1 _ _63 38 71 4 113
- 45-
KOGA etc: The Trends of Grobal Tritium Precipitations
Europe (Fig. 4)
Ottawa (45.32°N, 75.67°W, Canada, not in Europe) (Fig. 3), Valentia (51.93°N, lO.25°W, Ireland), (Fig. 3) Vienna (48.25°N, 16.37°E, Austria), Genoa (44.42°N, 8.85°E, Italy) (Fig. 5), Stuttgart (48.83°
N, 9.200E, W. Germany) (Fig. 6), Lista (5E,.100N, 6.57°E) and Huddinge (59.23°N, 17.98°E, Swe- den) (Fig. 37) showed immediate response to the nuclear test conducted by the USSR in October, 1961. A small peak (1962) on the left side of a high peak (1963) seems to be caused by this test.
The large peak in 1963 must be due to numerous nuclear tests conducted in the Pacific Ocean
o MOSKVA
USSR
EUROPE
Fig. 4: A map of Europe.
pCi/m2
106 ---.
.:
103 - - • - - - •• - - - - •• -. - - - • - • - - - • - ••• _. -- - - • - - ---
Fig. 5 Trends at Vienna, Thonon-Les-Bain and Genoa.
pCi/m2
. :-
~: ¥-..
!...- : ."-'" .-..
• _e.; •
.
_e _ _
..
QSTUTTGART .KOBLENZ
"NEUHERB~HU
w--~..:.,...
~ • • a . . . . ~ ~J
104 - - - -
" .., • • •• ~ .. # ••• ~ ••• ~ ... ~ ...
- - - - _ .. - - ... a_
.. •.
_ _ ~ _ _ _ ... _ ':!' _ 't _. .
•...- .. ..
.~' .... _ _.,"
1 03 - - - - - - - - - - - - - - - - - - - - - - - - - • - - • - - •
196119621963'1964'1965'19661967'1968'19691970 19711972\19731974'1975 19751977T97s1t97"9T980tt9sri9821983
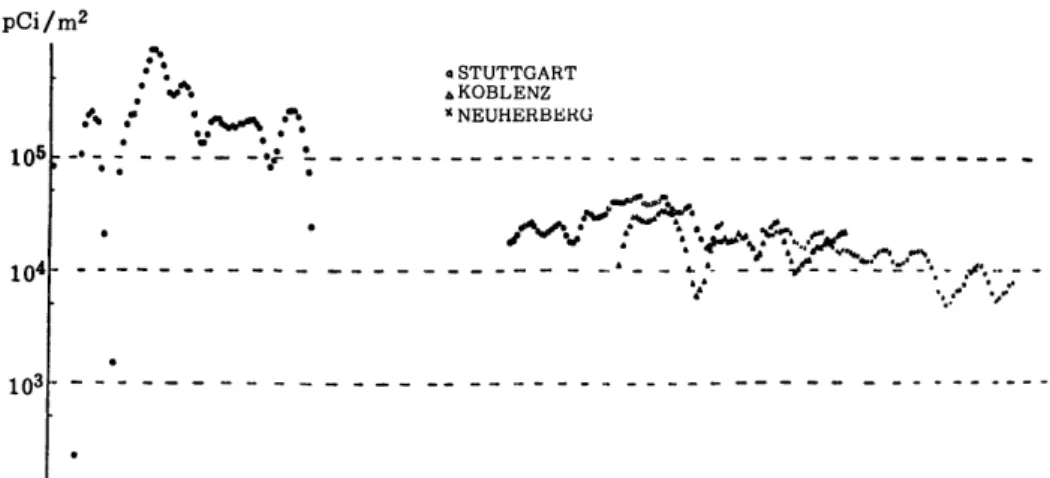
Fig. 6 Trends at Stuttgart, Koblenz and Neuherberg.
pCi/m2
o GRONINGEN X KRAKOW
Q ~
GE> ~·II
E) cft!DG) f) II G tr. II • III
<1h-., ~(f) (D,,~ -~. G) (f) t;) • • • II ..~. ".~....
Jr..
• ••..,."
' . • &/1- ....
..<lkI... •••. ' ".
G""-
Q ~ &--- --- ----I --
~---G)' - - - -~_cTfj9"F.l!J;.;I_
V
.~.It.
102~~---.---~---'---r---r---r---.---'-- 11972 1973 1974 1975 1976 1977 1978 1979
Fig. 7 Trends at Groningen and Krakow.
KOGA etc: The Trends of Grobal Tritium Precipitations
(Table 1). The heights of these peaks were in the region 105",106 pCi/m2• However, after 1981, tritium precipitation at Neuherberg (W. Germany) declined into the region 103",104 pCi/m2 (Fig.
6). This station has been one of the IAEA laboratories in charge of measuring tritium and others, but it was not included in the IAEA data lists (1953",1979).
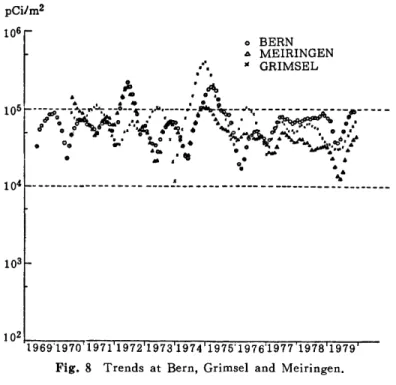
At the end of 1974, a marked peak was observed in the trend curves of Bern (46.92°N, 7.50 0E), Grimsel (46.57°N, 8.33°E) and Meiringen (46.73°N, 8.200E) in Switzerland (Fig. 8). However, the peaks corresponding to these could not be identified in the trend curves of Stuttgart (W. Ger- many), Koblenz (50.35°N, 7.58°E) (Fig. 6) and Thonon-Les-Bain (46.22°N, 6.28°E, France) (Fig.
5) near Switzerland, and the phenomenon seems to be regional. Causes for this regional eleva- tion are not clear.
Most of European stations including Groningen (53.2°1N, 6.57°E) and Krakow (50.05°N, 19.48°E) (Fig. 7) have the trend level of (1",5) X 104 pCi/m2 until 1979.
North America and Canada (Fig. 9)
The tritium trend curves of US cities such as Waco (31.62°N, 97.22°W) (Fig. 10), Hatteras (35.27°N, 75.55°W), Chicago (41. 78°N, 87. 75°W), Lincoln (40.82°N, 96.70 0W) (Fig. 11), Denver (39.77°N, 104.88°W) (Fig. 10), Salt Lake City (40.77°N, 111.97°W), Washington D. C. (38.85°N, 77 .03°W) (Fig. 13), Bismarck (46.77°N, 100.75°W), Boston (42.37°N, 71.03°W) (Fig. 14), Edmonton (53.57°N, 113.52°W, Canada) and Goose Bay (53.32°N, 60.42°W, Canada) (Fig. 12) showed a large peak between 105",106 pCi/m2 around 1963, the same year when the largest peaks were observed in Europe.
Latitude effect was seen among the trends of Ocala (29.18°N, 82.13°W), Waco, Albuquerque (35.05°N, 106.62°W), Hatteras, St. Louis (38.75°N, 90.38°W), Lincoln, Chicago (41. 78°N, 87. 75°W), Ottawa (Canada) and Edmonton (Table 2).
pCi/m2
..
.'. .
;, 'd\
. .- .. .
o BERN
A MEIRINGEN
" GRIMSEL
106[
• • . . . I • ;
105~_---"""~ a90 "~' ~. - - 0 __ . - _ - .... It , ' . ----.-~ • • _. .... - - ... ~ . ' '1- - - -. . - . _ ~ ~ - - - - -
dI • ~o •••• • • • I' • .~' ...
I •• 0 •
~ .,·Ie .~..
' . 2 ' ..~"
...;,:. .... ". . . , ' o I • ~o • • • ",,"1 ~ .,... .... I . ~dI, II'• 0 ... . . . .
'..,.,6
~:-._Ir••
10'
L_ ----:--- --- -- -~--:~: ---- --::-- --- ~L _____ _
102
1-:"1:::-9 ~6 9:-:-·1:-:9::-:7:-::0"T~1;-;:9:-;:;7:'71r.11-:::-9::-7 2::-1171 9:::-:7::-:3:T.ll:-:9:-::7:-:'4T:11:-:9:-::7:":'S'-' 1-:::'9"::'7 -:":6 '~19=-:7:-:7:"T'1::-:9::-::7:-:::8-r:i 1:-:9:-::7:":'9T""i -
Fig. 8 Trends at Bern, Grimsel and Meiringen.
EDM~NTON
.. 4t ;.
o GOOSE BAY
THE.PA~
0--
... 0~\
J ",."""--__ WYNYARD - (\
VICTOR;'
PORTLAND
· - - - G I M L I ATIKOKAN STE ~GAT.H~.
~
. '~~~c:»
OTT:;;'.'/pCi/m2 106
BISMARCK
'd
~
CHICAGO:t/'
SALT LAKE CITY oDENVER LINCORN WASHINGTON D.C.o
ALBUQUERQUE o
o
.
o ST. LOUIS
oWACO
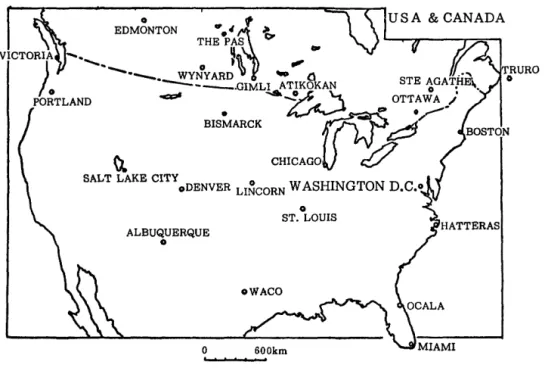
Fig. 9 A map of North America (USA and Canada).
o OCALA
A ALBUQUERQUE
.' ...
:r.: · .'\ ... ..
D DENVER" WACO
; , I. Do
.""rvt •
. . ....
~,.
• ~ __ .-p Jo J.~ ~ ,_-" _ _ L _ ~,.. _ _ _ _ : _ _ _ _ _ _ _ _ _ _ _ .. _ _ _ _ _ _ _ _ _ _ _ _ _ _
• ,0
.-
•:?,,: . . .,
:~'''_..•
.. •• If'."d, ,....
tIP'" .... ' . ~.... ':". • •.
OIl,".. • • : • '--: •
• ...~ ~A."""
.,. ... _~a;*~t~__
. .".1:.: ... /- ... .,.,. ...
- - - ; . - - - - - - - • - ,""; - -:,,.- - •• "'J"." - .. ~. : .. ~~:.~. - -
:.# ..
"A'-.",~..
l·. - - - - - -~-- - - - -• • a.
"'-'~:' ~.... : .•
'11. • O ... ~ .~. " ' ..
"~.... ..
'.,:~.. ,. , 'I
•.•• • . ' • .. • e,-'. .-.,: • ,. A' .: •• ' . "
a 6 tit ... -.:
.. .., .,-
--- ---- .-. - --- --_ .. _---,,---
1961196219631964196519661967196819691970197119721973197 419751976197719781979- Fig, 10 Trends at Ocala, Albuquerque, Waco and Denver.
- 49-
KOGA etc: The Trends of Grobal Tritium Precipitations
l"'c,
"J"~:'~
:r \;" ..
~... ...
o HATTERAS
A LINCOLN x CHICAGO
• f .
~.... -:,. . .:
~..
105 -~-- - - " - - -"'~- - - - ;: - - - - - - - • - - - - - - - --
01 •
A ,.. -;:. .-'
. • • • ••
'.:A,~.... :'!"t". .. & • • , ••• ..., ••• • : 1II.Jt,... ..'1.... ... ~... "
. . . : - . ; "\.~ ~-~. : \ . . ... 00,
. ' ·0 •• • ~ -
V
-.~t-~ -q;~... ,,. .. -' "
...--.1/J6. ...
_~'~.,' .. ·." .. .•
~ t • • ,...
~.- -.~
••
- - - -- - - - '!"o.~' -,,~-.". ..
.~ ~ ~ - -...
'T""~':: ~Oo./"'s!. .o.~.' -?- .••
to ••o.,d"Jf
7"a'.! .:·.·A
j -I e.'" ., ...
196211963' 1964 ' 1965 ' 1966 ' 196711968 ' 1969 ' 1970' 1971 ' 1972 ' 1973' 1974 ' 1975'1976 i 1977' 1978 ' 1979
Fig. 11 Trends at Hatteras, Lincoln and Chicago.
pCiJm2 ($10
o 0
106 _________
° __
0 _ _ _ _ _ _ _ _ _ _ _ _ _ _ _ _ _ _ _ _ _ _ _ _o
°
~QJ:\'" \
CD ••• - . ,
o
° .". • ...
~ dO• .0 0
00. 0 ~G
• 0 Cb a • • ~ •• "
a • . t a GI (IIJ
105 - - - -
---.0--- --·a • -. .; -
69 •• :0 --J'i: --
• a a "L"q9
" ' • if "
• lr I • • ,.t)
.. ."
10
0°
4 ____________________________ 0 _ _ _ _ 0 _ _ _ _ _ _
o GOOSE BAY
J( EDMONTON
•
1961 1969
Fig. 12 Trends at Edmonton and Goose Bay.
pCilm2
~
...
o BARBADOS
l( WASHINGTON D. C.
A SALT LAKE CITY
105 'a,_~ _ _ _ _ _ _ .. _ _ _ _ _ _ _ _ _ _ _ _ _ _ _ _ _ _ • _ _ _ _ • __ _
, A ... . .
... ... t.'~~'" .,..~ ."f., ..
,<Itt. • ~-:"'·lJoo.t#\' •. ~." ...
• .., I t t . ~ "
O . ~ .1' .. .. ... '"
,. .. , . ... ,. • ".-. -, ,"", .,. ... , .... " .. ··~A 4 "'- J' • • ... .l.~'" ~" ~-
.- "* .... . ...
10 - - ~ -0 - - - . - - - - - - - - _A\'r"-
1'" _
A....II!. .. -, - ~ ••• ~ .. - _ -'-! L . _ _ltd' ..~ , . : <10 ." I' ~ ... wa', .... If ....
t • • ."' ~I .... ttl ...
·.e • • •• •• .. , .. "
. :
00.. .. •• 0. • •• : • ..':.
•• ..,1 .• "-..:.
'\jt • ". , . . , ,--.
-. . .
.~"' ..
103 _ _ _ _ _ _ _ ___ ,'-oJ _ _ _ _ _ _.
19641965196619671968196919701970197219731974 19751976197719781979 Fig. 13 Trends at Barbados, Washington D. C. and Salt Lake City.
o BISMARCK
",ANCHORAGE )( BOSTON
--
.._---- .. ---
1964\ 965' 1966'1967'1968' 1969'1970' 1971'1972'197 3' 1974' 1975'1976' 1977'1978'1 ~ Fig. 14 Trends at Boston, Bismarck and Anchorage.
Table 2 The latitude effect
City 1963 Peak (pCi/m2)
Waco Albuquerque Hatteras St. Louis Lincoln Chicago Ottawa Edmonton
- 51-
2.8 X 10⁵ 1.6 X 10⁵ 4 xl05 4 X 10⁵ 4.2x10⁵ 6 X 10⁵ 9 X 10⁵ 5 X 10⁵
KOGA etc: The Trends of Grobal Tritium Precipitations
The latitude of the maximum peak was about 50 oN. Dilution effect by oceanic air from the Gulf of Mexico should also be considered in addition to the latitude effect.
The trends of US cities such as Miami (25.75°N, 80.16°W), Waco, Hatteras, Anchorage (61.17°N, 150.02°W), Bismarck, Barbados, Denver (39.77°N, 104.SS0W) and Salt Lake City etc. (Fig. 2, 10, 11, 13, 14) declined into the region 103...,104 pCi/m2 after 1972, while those of Canadian cities such as Simcoe (42.S5°N, SO.22°W), Truro (45.37°N, 63.27°W), Ste. Agathe (46.05°N, 74.2S0W), Atikokan (4S.75°N, 91.62°W), Gimli (50.62°N, 96.98°W), Wynyard (51.77°N, 104.200W) and The Pas (53.97°
N, 101.100W) lay in the region 104...,105 pCi/m2 until 1979 except Victoria (4S.65°N, 123.43°W) (Fig. 15, 16), a maritime city in the west coast of Canada.
South America
(Fig. 20)The trend curves of tritium precipitation at all cities in South America lay in the region 103 ...
104 pCijm2 after 1968. Among them, those in Belem (1.43°S, 48.4S0W), Manaus (3.12°S, 60.02°W) (Fig. 21), Porto Velho (S.77°S, 63.92°W) (Fig. 22), Porto Alegre (30.0SoS, 51.18°W) (Fig. 23) and Stanley (51. 70 oS, 57.87°W) (Fig. 39) were almost above 4 X 10³ pCi/m2, while those in Izobamba (0.37°S, 78.55°W) (Fig. 17), Fortaleza (3.72°S, 38.55°W) (Fig. 21), Natal (5.80 oS, 35.200W) (Fig.
pCi/m2
o SIMCOE
)C TRURO A STE. AGATHE o VICTORIA
•
II•
• • • ..
•
II•
•
1975 1976
• •
• •
Fig. 15 Trends at Simcoe, Truro, Ste.
Agathe and Victoria.
pCi/m2
o ATIKOKAN )( GIMLI A WYNYARD
o THE PAS
1975 1976 1977 1978
•
Fig. 16 Trends at Atikokan, Gimli, Wynyard and The Pas.
pCi/m2 106
105
'''',
.
.,...
,...
"
.
... "r
....
-' - ,
.
.. ..
o IZOBAMBA
A HOWARD AFB x SAN JUAN
,
"c c •
. . . .
• " 'ft... 0
- .-'c-:;.-.a'J'.-> ... ~ - .. 'a - - , - - - - - - - - - - - - ~ - ,', ' •• .!ifoi...,. ' ... 0" ... _~ ... ~
••• ...-7'l I ... ~~". • ~
"
..
,....
~.:-~-...
. .
..
.. ,&I. 0,. ... 11", 0 ~.'""
... ' .... 11 • • c~~
.... ' • ....£"... :. • •
.11'u.
_
~ ~_... ": 0.:'
0•
102
171;;"9 6;;-;3;;'T7";19:V6;-:;4:r;1;rg;;;6~5r;'1-;:-9::-6 6::r.-:19~6::-::7:r.l~9:-:::6~8r::-l-::-9-::-6 9:1'--:-19:::-:7::-:0:rl:-:9:-:7:-:l""1-:-9-::-7~2 ~19-::-:7-::-:3:rl:-:9~7:-:4r:l-:-9-=7~5 r':"1'::'"9 7~6::-r-:-19::-::7::-:7:r.l~9~7:-::'8r.-l-:::-9 ~7 9::-r--
pCilm2 106
Fig. 17 Trends at Izobamba, Howard AFB and San Juan.
)C ST. HELENA
o
TUNIS105 ••• - - • - - - - • - - - • - - - .. - - - - - - - •• -
. •
~ ~
: .
. - - - -~-!~o. _ ...,,-' _ .! _ _ _ _ _ _ ... -: 0
0 _ _ _ • • ~. • • _ • • _ _ : _ •
.. , ..
• '".. . , . . . .....
0 • • "• 0. 0 • • • ~ . .
·0.' 0 . -
.. ..
... ,.,1 ••••
••••••••••••• "
...
,I'. • ... .'. .. ...
"... ... : ... . . ... . . ..,.. ., . .
. - ... - --- - .... - - - - - ... : - ... . ....
" ,'_ ..- .... ":.'. - ... - -
Fig. 18 Trends at Tunis and St. Helena.
KOGA etc: The Trends of Grobal Tritium Precipitations
22), Salvador (13.000S, 38.52°W) (Fig. 22) and Rio de Janeiro (22.900S, 43.17°W) (Fig. 23) were below that level. But the value in Stanley declined into the region (1 ... 4) X 103 pCi/m2 after 1972.
These trend curves exhibited no 1963 peak and no latitude effect.
Trend curves of Gough Island (40.35°S, 9.88°W) in the Atlantic Ocean and Marion Island (46.88°S, 37.87°E) (Fig. 20) in the Indian Ocean showed 104 ... 105 pCi/m2 level from 1961 to 1972 (Fig. 19). Considering that Gough Is. and Marion Is. lie in high southern latitude, this is an interesting contrast to those of islands in the South Pacific Ocean, the value of which were almost in the region 103 ... 104 pCi/m2•
Trend curve of Tunis (36.83°N, 10.23°E) (Fig. 4) in the Mediterranean Sea showed lower tritium level and St. Helena (15.97°S, 5.700W) (Fig. 20) in the Atlantic Ocean much lower (Fig. 18).
pCi/m2
- - - -
....
.I' \.
1 04 -. - - ·,-..
. . . .... .
..i - - - -
oGOUGH IS •
• MARION IS.
.
Fig. 19 Trends at Gough Is. and Marion Is.
~ rv/ ~J-.'-
_ ______ E QUA TOR .-
°IZOBAMBA D 'BELEM
MANAUS ~NATAL
D PORTO VELHO ) BRA Z I LjSALVADOR
oCUIBA 0
ST. HELENA RIO DE JANEIRO
PORTO ALEGE
THE ATLANTIC OCEAN
<'-f
/1AFRICA
--.-r---
ll!~OCEAN
• GOUGH ISLAND
• MARION ISLAND
• STANLEY
• ARGENTINE ISLAND
Fig. 20 A map of South America.
ctBELEM c.MANAUS
11 FORTALEZA
105 - - •
--....
---.'-- .
-"'.,11- __ -1965'196619671968i9691970'19-711972'l973T97419751976197719781979 Fig. 21 Trends at Belem, Manaus and Fortaleza.
pCi/m2 106
o NATAL
to PORTO VELHO x SALVADOR
--- ---
- -- --- -----
- - - ----
~
..
~- ' -,- - -... ". - - - - -.~'-.. , - - - - - - - - - -- - : .. _ . -. . . - -- , ; a , . . " . . - . , ~ ,.~ .... - - - - - J .. -
'. ''', ,. •••••.• :'''c ... A~,.".. • • •
',IA' GtaIl.IIIIIA • • • 1 ,. • ..,.. I' II. I •• •••• ,,' &.
- . III 0 . . . JI.... c9. I JP!;J. ..
• e 'b ~ tYV. Ie 001 co ,I •
• , , ,p"'I:QIiQP." ' • '" ,0 0 .~~
Qsl,p' 0 " ,"V>d • • 0 0 , ..
o;p • "'ISJ" 0 ",Ot>o,;, , 0
1 03 .. - - - _ _ _ _ _ _ _ _ _ _ _ ___ Jlo _ _ _ _ _ _ _ _ _ IL AI _
:0 .. _
GOFig. 22 Trends at Natal, Porto Velho and Salvador.
- 55-
KOGA etc: The Trends of Grobal Tritium Precipitations
pCi/m2 106 -
o CUIBA
<) RIODEJANEIRO
x PORTO ALEGE
105 - - - - - - •. - - - - _. - - - - - - - -
1
1965 '19661967'1968'1969'1970'1971'1972'1973'1974 1975 19761977 19781979 Fig. 23 Trends at Cuiba, Rio de Janeiro and Porto Alege.50--~----T---r---
o
10 ~
~--,---,--.,.---r---r---'
oWEATHERSHIP o MIDWAY
oWAKE <',HILO
• JOHNSTON oGUAM
·.APIA
.RAROTONGA BRISBANE
ADELAIDE )SKAITAIA
MELBOURNE
\J /)
KAITOKEc(../~NVERCARGlLL Fig. 24 A map of Pacific Ocean.
o TOKYO .,,0 . • .~~ _p.
A KINKI UNIVERSITY(OSAKA) POHANG
• . ; : ':.(' •• d' •
105 .... ,.;,._ .• --- ._--- .•• -! \:'.\. --- ---- - --- ---- --- --- --- ---- --- --- --- - --- ---- --- - _ .. -- ---'
. • • • • • 3 • ., "~ ...
• •• • ~ • ." S ... ..,.-'\, 11ft.
• • •• rI ... ~'fo '-O~. U"!l1f.f,J/l!.. ~
• ..~ QtO l~,." l&¥ ~ ... r.J'"
1 04 -.--- -- .-- - ---.-- ______
~_.~·:
___ ·L ___ ____ . __ :.·\ ..~~~~
..~~.----r.o •.
<IIT- -.--.--.--- --- - -.- ••• A ·tD 0. ,/..;~ '.p'.,.
F"oi "'.,., I' ... ,: . .
~....
~.. -
.~• " " " ,J"'.
:V... ~ /'-..
A.. ....
"'./ll 61'"
J~103 --- --- ----_________________________ - __________ • ____ oA. ___ ~ ________ -_J _____________ - - - - -~ ----_ •• -_.- -- ---.- •• -
19611962196319641965 1966 1967 19681969197019711972 1973 1974 1975 1976197719781979 1980 19iH 19821983
Fig. 25 Trends at Tokyo, Pohang and Osaka.
r
C8-1371 0 2
,"-
"""'''''''''~
... •'-'''--.N'''' • .".,,: ...
: : #' e • • _ ' : : ' .
...
':>---:f
-,----r-.. ~~
t "
102
r .,- .
f' '.~
lOt
f
Sr-90 !\
"""" " : , ... _ • .... .."t.
• ,. ..:- 0:.
. .
..
i •
1 ! - - - -___ .. _ _ _
1 Q65 !1966'1967\1968 196911970\197ii1972Ii973
Fig. 26 Trends at Osaka (Tritium, Sr-90 and Cs-137).
Eastern Asia and Northern Pacific (Fig. 24)
The trends of tritium precipitation in Tokyo (35.68°N, 139.77°E) and Pohang (36.03°N, 129.38°E) showed a large peak, 6 X 10⁵ pCi/m2 and 7 X 10⁵ pCi/m2 in 1963, respectively (Fig. 25). It is curious that the trend in Wake Island (19.28°N, 166.5°E) showed a peak value of 3 X 10⁴ pCi/m2 (Fig. 27). The 1963 trend peak at Guam (13.55°N, 144.83°E) (Fig. 27), Weathership V (31.00 0N, 164.000E), Midway (28.22°
N, 177.37°W) (Fig. 28) showed 1 X 10⁵ pCi/m2, while those in Johnston Island (16.73°N, 169.52°W) (Fig.
27) and Hilo (19.72°N, 155.07°W) (Fig. 28) showed 2x10⁵ pCi/m2. This is probably attributed to the dilution effect by oceanic water vapour.
The trend curves of Johnston Island and Midway declined into the region 103",104 pCi/m2 after 1966.
On the other hand, trend curves of Osaka (34.64°N, 135.59°E) and Tokyo declined into the same region after 1972 and 1975, respectively (Fig. 25). Osaka, 550 km west of Tokyo, showed a little lower level of tritium precipitation than that of Tokyo, which had about the same level as that of Pohang.
Trend curves of Yap (9,49°N, 138.09°E), Truk (7,47°N, 151.85°E) and Madang (5.22°S, 145.800E) lay in the region 103",104 pCijm2 from 1968, but that of Djakarta (6.18°S, 106.83°E) (Fig. 29) showed a
KOGA etc: The Trends of Global Tritium Precipitations
pCi/m2 106
-
..
.....
o GUAM
A JOHNSTON x WAKE
105,--------~ ... ~---.---- - - ---- - - -- --- --- - - --- --- - ---- - -- --- ----
E> .,
00 ot o.f
o~. ~~
,. .. ·c IA . . . °0•
1\1_.1 ... ,.,.. -, eg
rJ1b
, .... I," ...
.
0 ., ~ ., Clld'o104 -.-.---- - - --- --- --.;
'o.:l.r;"'-
'l);-.i~'---- -- -
iilt.-;';;-- -~--0; -- ---- - --- - - -- --- ----• • ~ lij,!" <'I II tI 0 0 0 /~
.," •• :... ~ a:q,. 041' °,;,19° III 0
• ., cfl' ~ ~ ... 0.,. ., • • ,iP .... !'\.. •
...
•
.A 1ft,V<i
I!P0.,
~ '...", r".
Mm.,.. -',..&.. .... .. ",,". AI'\l'\,x ••••" ~ ~ ~1. '. d' ,:."" •
• .. • ~ Ii III A ' . A • &l A
."r... "..
103 -- ---- --- - - - -- ---
;---~
_4.. __ - - - --~-
--~
- -""':.'!..~if- - --- - - ~'.;---:.--:--
.
102
1961' 1962'1963'1964'1965'1966' 1967' 1968' 1969' 1970' 1971 '1972'197 3 J197 4'197511976'
pCilm2 106
.
A.
Fig. 27 Trends at Guam, Johnston and Wake.
o HIRO
A MIDWAY )\ WEATHERSHIP V
a. \lb.
105 ----.ftt!' •. -~~ - --- -- - - - ---- -- --- -- - -- --- -- --- ---- --- ---- ---
~~
... ..,
, , ' • • , 0 dIIII
... : • 10M .. • sOb"l. ff'o
. . . ~ • : . . , . , . - . . . 0
A.... . A .... II.· .. ". JI
",/1'. k" ~i. .,,'" '"
• ,. ••. t o' ." ... ", JAA.
104' - --- - - ---A - . --.. p . -~"-e,,/.---*-'~~ --- ----,.- --- -- - -- - -- -- - -- --- - -- -- . ~~:'G .. .a -:6~' a}J' ~.& , ~ A'" A.
' . ' .1\\ • ~. .. .... ~~.. ...1' ....
"""." ",.",.- , ...
" . ... ' \ . . .
.... :
oe.... · ..
~V . . .... ·..-" .. "- "* ..
• 4l - . : •
103 --- --- ---.---- - ---- ---,-- -- - -- -- - - - --- - --~-- - - - ---- --- - --- - -- ----011- - - -
Fig. 28 Trends at Hilo, Midway and Weathership V.
.. ..
1963 peak reaching up to 2.5 X 10⁵ pCijmz.
Southern Pacific (Fig. 24)
In the southern Pacific Ocean, the 1963 peak was not observed. The trends of Kaitoke (41.100S, 175.17°E), Invercargill (46.42°S, 168.32°E), and Kaitaia (35.07°S, 173.28°E) (Fig. 31) lay around 1 X 10⁴ pCi/mz from 1963 to 1972, and declined into the region 103",,104 pCi/m2 thereafter. This tendency was the same as that of South America.
The trend curves of Australian cities, Melbourne (37.82°S, 144.97°E), Brisbane (27.43°S, 153.08°
E), Adelaide (34.57So, 138.32°E) and Perth (31.57°S, 115.49°E) were all in the region 103",,104 pCi/m2 and had decreasing tendency after 1972 (Fig. 30).
pCi/m2
106 oDJAKALTA
105 o'*'
o 0 o 0
AMADANG -TRUK
II YAP
i?-:-'o---' --- ---- --- -- --- -- -- --- - --_.---... -- - - --. --- - -- - - -- -- -- -- ---
""
~I» • • ..
• • 0"'0 .. ... ••••••• .. .. ...
- . . ... . .... ... ..
104 ---,----
~-;----~---~·~o't!:.~~;~£~:. ----i .. :- ~~~---~~---j.. -- ---
o o'J; .,.~~ 0 If' ~~'!.o .. "q\~,,,
....
~... ~""."
II!I
D. 0 II .. 0 .q~~ ~ • ", A. wi" • ...
"'0" ".fI'.'''''lP ..
...J...
'tt,: ::
"IJ~ ~ • • 0" • . 6 °0" :. -
---
I»---
...-- --- --- ._-- --- --
_ ... _ ... ----.-. ----
-----
-----
- ---_
... -... ----_.
1 02L2if96a1t964'19651966l967i9681969'19 70 19711 97219731974197519 76t977197iliii-7"9 Fig. 29 Trends at Djakarta, Madang, Truk and Yap.
pCi/m2
106 o BRISBANE
A PERTH x ADELAIDE a MELBOURNE
..
- -- -- - - - - - -
..-
_ ... -- - - -
-.. - - - - -- - -- - - - -- - - -
..
~\....
. ~ ~. I'. .I'
10
4
.----.~::t/oQj ,j,~·~~Jh.~~.b---."l'.~ ':'~I~~-
-Fari' - ---- -- .. - -- --- --- - - -- •.• - - ._-1". --.I'':.
A ~ ,!)' .. "R" '11u8'Ua '0 p, 'b ,to·.~ 'b ,p• ',. ~"")~ 'N;"~u .I1,~ntJ 0 \i~ .t,~~-. V:/,I\tlIO ' 0"" A
• .. .1 ... · .~~;A'''4IfI. ~ "II. ~c.a-~"'ALdlo.~oQ~ • U
. ' ,t . ' • ,~ ... ~ .: "Jl'-;.".II/IN-·~U~AI ~ \\; ~\cr~ ... .. ~~ IIblAJ • ..P 11_0"'1111' " " ' " ' - ' ,
6... a,' . . . . ., .. ., ... 'L'''';- ~ ••• ~ .0
• . . . ' . . . " ' ' ' . . .. ~ 0 D
103 - ---- ---- - --- -- - - - --- - --- --- - --- -- - - --- - - - -- - - .. - - -'io\JI.-. - --- -.
... U
.. "'0-
102L~
196219631964196519661967196819691970197119721973197419751976197719781979~ ___ ,._ ~-C---C""-_-"-'
Fig. 30 Trends at Brisbane, Perth, Adelaide and Mellbourne.
KOGA etc: The Trends of Global Tritium Precipitations
104
60
60
o KAITAIA
A KAITOKE
• INVERCARGILL
...
~-: ~W"..,.. ~."" ~ ....
.A.._: ... '" .
7. \ • • . ' , --~. • ~' .. -"" • #V .
-.-11:..-.. ·• .. -~'iO - .~~ 7"':;;: <f- ~~.r. - -'Ie - - - - - - - - - .- - - - - -
• .,-~.. • .. ~ 0 ,--~. sa ".", '''.'~. --.~tL- '. ~,,,,,,,... Aa _ J'u..
:.r
~'"
'\jIo .... V 'Ii • .,., 0 'V' ,'-' ~...". ~"-'1'1.... . . _ , . ~ .. ""
eo ····~f.
. ...
'J' '.~'l:"e • '~/" ~ •
'II,; •
...
" . . . o·./' '...
'." "p ~ .......
~~ '" : • '" •..
'..
1962'1963' 1964'1965 '1966'1967 ' 1968'1969 '1970 ' 1971'1972'1973 '1974' 1975 ' 1976 1Iliirrmil'1979T
Fig. 31 Trends at Kaitaia, Kaitoke and Invercargill.
oPERM o MOSKVA
p
oENISEJSK
,4 0 NOVOSIBIRSK ~
• OMSK
,-.
r .. -', .... ",
"--"''11 "._--,",
--
, ~,
..
,r=-r/
,_1
4~~0~~----~~~~~--~---~~~---~---1~20E
Fig. 32 A map of USSR.
USSR (Fig. 32)
Trends of tritium precipitation in USSR cities, namely Dudinka (69.24°N, 86.100E), Moskva (55.75°N, 37.57°E), Perm (58.01 ON, 56.18°E) (Fig. 33), Omsk (54.56°N, 82.900E), Enisejsk (58.27°N, 92.09°E), Noviosbirsk (55.03°N, 82.900E) (Fig. 34), Odessa (46.48°N, 30.63°E) and Rostov-na-Donu (47.25°N, 39.82°E) (Fig. 35) were all in the region (1...,5) X 104 from 1969 to 1979 in spite of the large distances between them (Fig. 29, 31). It was observed that the trend of Odessa, the latitude of which is the lowest, had the lowest tritium level among them.
Polar region North Pole: (Fig. 36)
Tritium precipitation trends of Isfjord Radio (78.07°N, 13.63°E), Huddinge (59.23°N. 17.98°E)
o DUDINKA Ji.MOSKVA llPERM
i~~r
105 - - - -~ - - - • - - - -
103 - - - • - - - -
1969 1970 1971'1972'1973'
pCi/m2 106
Fig. 33 Trends at Dudinka, Moskva and Perm.
ofPo
• 0 o 00·
"
II
o NOVOSIBIRSK
lC ENISEJSK.
to OMSK
103 - - - -.- - - -
102~----r---~---~---~---___ ~---__ ---~----r---~
1971
Fig. 34 Trends at Omsk, Enisejsk and Novosibirsk.
- 61-
KOGA etc: The Trends of Global Tritium Precipitations
pCi/m2 106
o ODESSA
lC ROSTOV -NA-DONU
.... ..
197011971'1972' 1973 1974 1975 1976'1977'1978' 1979' Fig. 35 Trends at Odessa and Rostov-na-Donu_
Fig. 36 A map of North Pole.