Effects of Application Levels of N- P-K Fertilizer on the Growth and Yield of a Medicinal Plant,
Geranium thunbergii SIEB. et Zucco
Surin NILSAMRANCHIT*. Koji OcAKI**. Kaoru ASH IDA * and Mamoru SUGINO*
SYNOPSIS
The effects of fertilizer levels on the growth and tannin accumulation in a medicinal plant, Geranium thunbergii were determined on the potted plant with both deficient and excessive fertilizer applications. The standard rate of three fertilizer nutrients was established at ratios of 1.6 g ammonium sulphate (N element), 1.4 g superphosphate (P element). and 0.7 g potassium sulphate (K element), per crop. A reduction of dry matter production was 30-50% in plants with deficient fertilizer rates, but tannin concentration in leaf blades did not differ. The application of nitrogen fertilizer stimulated the increase of dry weights, which were also increased with the compound fertilizer containing N, P, and K elements. At higher application rates of 5 to 10 times the amount of nitrogen from standard treatment increased the obvious yield of dry weight more than 2-fold to 4-fold compared with the standard. However, tannin concentration in leaf blades decreased about 5 to 23% in all excessive applications of fertilizer.
INTRODUCTION
Nutrient availability is one of the major factors which determine the productivity in agricul- tural and natural ecosystems. The wide variation of the amount of soil nutrients sometimes causes the nutrient deficiency for crops growing or brings about a toxic effect. The appropriate nutrient concentration has been described as the range of concentration that occurs between deficiency and luxury consumption.I) Many data has been reported on the yield affected by nutrient levels in various crops. However, studies on the pharmacological yield of medicinal plants are limited. Thus, this study investigated broadly the influence of application rates of chemical fertilizer on the dry matter and tannin accumulation in a medicinal plant, Geranium thunbergii.
MATERIALS AND METHODS
Plant material and cultivation Geranium thunbergii plants were obtained from the Sayama medicinal plant garden of the Faculty of Pharmaceutical Sciences of Kinki University. In October 1991, the individual plants were devided by hand into the small plants, when the shoots started to grow near the base of the main stem. Leaves were removed to remain two or three young ones,
• Facult~' of AS(Ticulture. Kin.ki University. Nakamachi. :'\ara 631. Japan
•• Faculty of Pharmaceutical Sciences. Kinki niversity. Kowakae. Higashi·Osaka 577. Japan
2
and the roots were cut 2 to 3 cm long. These seedlings were planted in a plastic pot 6 cm diameter, filled with a mixture of vermiculite and sandy loam soil (l: 1 ; v/v) and grown without fertilizer.
At the start of the experiment, plants were selected for uniformity in size and two plants were transplanted into a rectangular plastic pot 15 cm wide, 32 cm long, and 14 cm deep, filled with a mixture of vermiculite and sandy loam soil (l: 1 ; v/v).
The chemical fertilizer used in this study was ammonium sulphate [NH. (SO,) 2], superphos- phate LeaH, (PO')2]. and potassium sulphate [K2SO,] for the respective N-, P-, and K-sources.
These fertilizers were grounded to used in a fine form. The standard rate of fertilizer applied to one pot per crop which was determined by the conventional recommendation of Fujita 2l, was 1.
6g of NH, (SO,),. 1.4 g of CaH, (PO,) 2, and 0.7 g of K2SO,. All plants were grown in a plastic greenhouse and watered thoroughly with tap water.
Experiment I: Deficient fertilizer application from January to July
This experiment was conducted from January to July, 1992. A half dose of standard treatment was applied to the plants with two ways; Fl and F2, designated in Table 1. In these deficient fertilizer treatments, fertilizers were applied 3 times. The fertilizer was put into a small hole made between the plants. The amount of standard treatment (St) was divided into 10 parts for 6 applications which was applied every month. Five pots were used for each treatment.
Experiment II: Deficient fertilizer application from July to October
This experiment was conducted from July to October, 1992. The cultivating and maintenance methods were the same as the Experiment I. On July 9, the aerial portions were cut to leave the basal stem approximately 2-3 cm, which enabled the stem to grow new shoots from July to October. Similar amount of fertilizer as studied in Experiment I was applied 5 times in the standard treatment every two weeks and 3 times in F3, F4 treatments at the same rating of F1, F2 as shown in Table 1. Four pots were used for each treatment.
Experiment III: Excessive fertilizer application from May to November
This experiment was conducted from May to November, 1992. The excessive amounts of fertilizer were established at 2, 5. and 10 times of the standard treatment. Comparisons were made of the increasing rates of each element and compound fertilizer of i\. P, and K elements.
The fertilizer was applied every month using the same method of the standard treatment in Experiment I. The harvesting time was determined in November as the method described in the
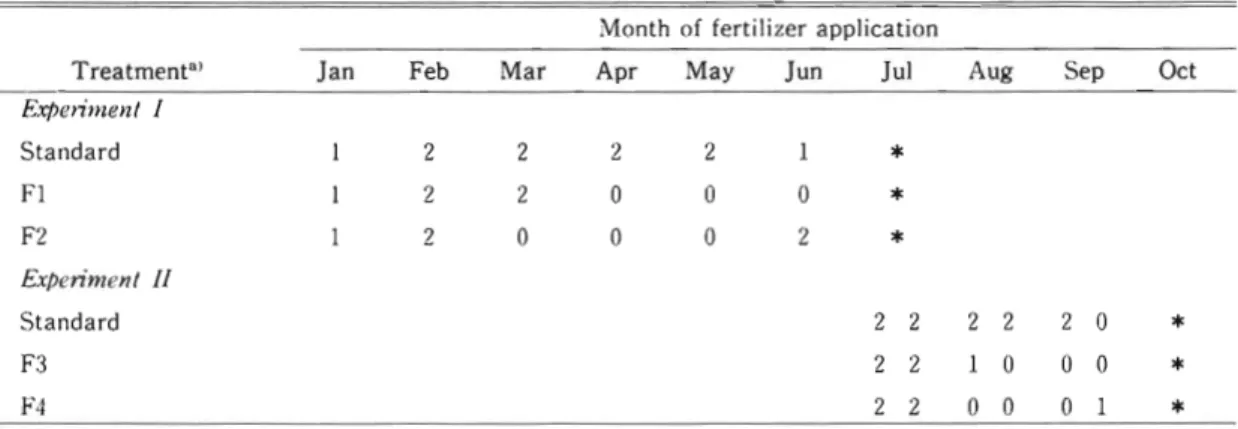
Table 1. Scheme of fertilizer application in experiment I and II from january to october, 1992 Month of fertilizer application
Treatment"' Jan Feb Mar Apr May Jun Jul Aug Sep Oct
Experiment /
Standard 2 2 2 2 1
*
Fl 2 2 0 0 0
*
F2 2 0 0 0 2
*
Experiment //
Standard 2 2 2 2 2 0
*
F3 2 2 0 0 0
*
F4 2 2 0 0 0
*
oj The amount of standard treatment was divided into 10 parts for 6 applications, which was applied every month in the Experiment I. For Experiment II, similar dose of fertilizer was applied 5 times in the standard treatment every two weeks. In ttl deficient fertilizer treatments, a half dose
t,"
standard treatment was applied 3 times in the Fl. F2. F3, and F4. See Materials and Methods for details.*
harvest timemeasurement of plants. Four pots were used for each treatment.
Measurement of plant growth At harvest time in each experiment, all plants were cut at the soil surface level and separated into leaves, stems, and roots. The numbers of stems and leaves were counted. The length of stems and the third internode from the apex on those stems were measured. The dry weights of plant parts were determined after oven-drying at 40·C for 72 h.
The dry weight ratio of top to root was calculated. In Experiment III, the number of mature pods was counted and collected as soon as they were completely brown or black (fully mature). The remaining pods on the plants at harvesting time were counted as immature pods.
Assay of tannin concentration Leaf blades from the third and fourth from the apex and whole stems were assayed for tannin in Experiment I and II. For experiment III, the total leaf blades on the one-year-old stems and on the new shoots emerged from the basal stems were separately assayed for tannin. Dried samples were grounded into a fine powder and 150 mg of leaves and 500 mg of stems were weighed for the analysis. The samples were extracted with 60%
acetone and assayed for the amount of tannin in extracts as a percentage of the original dry weight using a colorimetric procedure of the relative affinity of tannin to methylene blue based on the method of Okuda and co·workers.)) Tannic acid JP (Japanese Pharmacopoeia), Lot No.
M3B 9578, was purchased from 1':acalai Tesque, Inc., Kyoto, Japan, and used as the reference.
Statistical analysis Experiments were laid out in a completely radomized experimental design. All sets of data were subjected to ANOV A and significantly different means were separated by Duncan's multiple range test at p=0.05.
RESULTS
Experiment I The dry weight of plants which responded to standard treatment was signifi
cantly greater than Fl and F2 treatment (Fig. 1) _ The dry weight of the plants applied half the amount of fertilizer decreased conspicuously by less than 50% of the standard treatment. There was little difference in the number of stems and leaves between standard, Fl, and F2 treatments (Table 2). The dry weight ratio had no statistical difference between treatments. The mean length of the three longest stems was significantly shorter in Fl treatment. The tannin concentra
tion in leaf blades of plants under the influence of deficient fertilizer did not differ from those of the standard treatment (Fig. 2).
Experiment II As shown in Fig. 1, the growth responses of plants in October showed similar to those in Experiment I. The reduction of dry weight of aerial parts was 30-3:;% in the F3 and F4 treatments compared with the standard treatment. However, the root dry weight was not affected by the fertilizer application. The number of leaves and the dry weight ratio were significantly decreased in deficient fertilizer treatments (Table 2). The tannin concentration in leaf blades and stems did not differ between different fertilizer applications (Fig. 2).
Experiment III Figure 3 shows the effect of excessive fertilizer application on dry matter production. The dry weight of aerial parts increased with increase in the amount of nitrogen.
Marked increases in the dry weight of these plants were obtained when the nitrogen element was applied at rates of5 and 10 times. The dry weight was greatest in the plants applied 10 times (t\ : P : K) the standard treatment. It should be noted that the excessive applications of phosphorus and potassium did not increase the dry weight. The dry weight of roots was a little range of difference by excessive fertilizer. The increase of leaf and pod number were significantly greater than the 5-fold to 10-fold associated with consistently excessive nitrogen applied at 5 and 10 times (Table 3, and Fig. 4). The dry weight ratio increased about 2-fold by 5 times and 4-fold by 10 times application of nitrogen and compound fertilizer. On the contrary, tannin concentration decreased in the leaf blades both on one-year-old stems and new shoots (Fig. 5). The concentra
4
I
A
aB
a..
:c .. ..
:l:
>.
~
0
10
5 a
b b
b b
2 6
4 a
b b
b b
0 -
o
-St FI F2 St FJ F4 SI FI F2 SI FJ F4
~ 6
a
C
a
10 a
0
ns:c ..
.-
'" 4b b
b b
:l: 5
>.
~ b
c 2
0 0 ~
SI Fl F2 51 F3 F4 51 FI F2 SI F3 F4
Experiment I Experiment 1\ Experiment I Experiment \I Fig. 1 Dry weights of aerial parts W. leaves (8), stems (e). and roots (0) in the plants with
fertilizer deficiency
Data are means ± SD of five, four replicates in Experiment I and II, respectively. Bars with different letters for values from the same experiment show significant differences by Duncan's multiple range t tat p=O.05. ns, not significant.
tion in total leaves on the one·year·old stems decreased about 23% compared with the control (taken to be 100%) by 10 times application of nitrogen and compound fertilizer. The changes in tannin concentration in both assayed leaves were almost similar under different fertilizer applica- tions, although the appearances of leaf colour and shape were greatly different.
DISCUSSION
The reduction of dry weight was clearly recognized under insufficient fertilizer application with a sustained lower growth rate. A difference in results between different applications of deficient fertilizer at the level of a half amount of standard treatment was not noticeable in these experiment. The responses of plants in dry weight yield related to fertilizer rates were conspicu- ously more than the ways of the application. Hale and Orcutt') suggested that yield or growth rate are usually impaired before other symptoms of deficiency occur so that indications of at least the potential for a deficiency must be considered in any diagnosis procedures. Our n~:;ults showed that inhibited dry matter production by deficient fertilizer application did not reduce the tannin concentration as expressed in the standard treatment.
This experiment reveals that sufficient fertilizer rates brought about an increase of dry weight
4.0
til .c
~ o.D
til
...
...
~3.0
"C
:;;
~ ~...
"C ' -~ ' -
...
02.0
I:
...
o.D
~ I: I:
C Q)u
1.0
I:
...
~ Q)
f-c Co
° St Fl F2 Sf F3 F4
.c
.~0.75
til
...
~ ~
til
E
...
~...
"C-
til,-0.50
I: 0
Q)
I: o.D I: ~
c
~ ~0.25 f-c u
...
Q)
Co
° St Fl F2 St
F3 F4
Experi
ment
1 Experiment IIFig.2 Tannin cone ntration in I af blades (upper), and stem (I \ .r) in the plants with fertilizer deficien
Bars represent means _ 3D of fiv . four r plicate in Experim nl I and II, re ·pectively.
with appreciable nitrogen effects. This encourag s the effectives of supplementing with complete elements of N, P, and K. The increa in dry matter production w re cau d by nitrogen application. especially when the amount of nitrogen was increased - or 10 times. In this eXlJeri- ment, plant response without any t xicity or r idual effects was achieved by increasing the amount of ferlilizers gradually every month. Methods of supplying nitrog n are better matched to the growth of the plants and I by leaching were also minimized. However, more efficient utilization of nitrogen fertilizer is possible through a balanc of nutrients which would also contribute to a more efficient u of nitrogen as well as other nutrients.') Application of P or K
6 iliii\tj(~&l:7¥=$*C~ m29~ (1996)
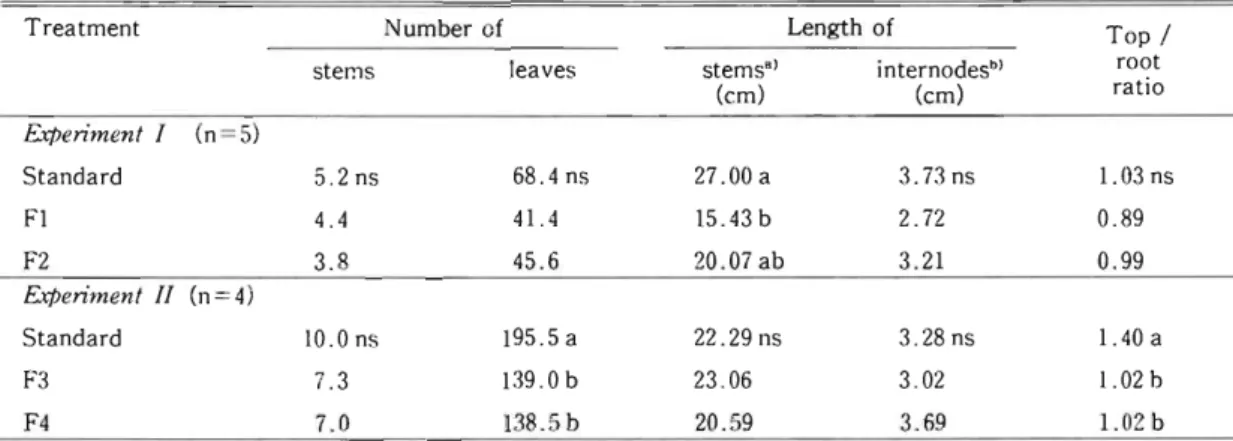
Table 2. Effects of deficient fertilizer applications on some morphological features
Treatment Number of Length of Top!
stems leaves stems'} internodes"} root
ratio
(em) (cm)
F..xpen·menl I (n=5)
Standard 5.2 ns 68.4 ns 27.00 a 3.73 ns 1.03 ns
FI 4.4 41.4 15.43 b 2.72 0.89
F2 3.8 45.6 20.07 ab 3.21 0.99
Expen'menl 1/ (n=4)
Standard 10.0 ns 195.5 a 22.29 ns 3.28 ns 1.40 a
F3 7.3 139.0 b 23.06 302 1.02 b
F4 7.0 138.5 b 20.59 3.69 1.02 b
Means with different letters for values from the same Experiment within columns show significant differences by Duncan's multiple range test at p=0.05. ns, not significant.
0) mean of the three longest stems.
u) on the third internode from the apex of the longest stem.
A B
ab"; 30 b
' - '
.c
...
.~20<:.I
~
>,
C
100
C
a 150
a..-.
OJ) 15
' - ' abe
...
10 ab.c
.~ 10 bed bed
1
Q.l bed bed
~
d
lL
d d>, d d d
...
5.r
C 5 ,I.
'--- ' -
0
o -
- -N 1 N
1 P 2 5 0
p 2151101 1 1
111~1
111111 1 1 2 5 21511010K 1 K 1 1 1 1 1 1 2 5 10 2 5 10
Fig.3 Dry weights of aerial parts 110, leave (B). stems (C). and roots 0) in the plant" given excessive fertilizer
Data are means _ Sf) of four replicates. Bars with different letters ho,," significant differenc . by Duncan's multiple range test at p=0.05.
Table 3. Effects of excessive fertilizer applications on some morphological features
Treatment Number of Length of Top/root Number of pods
N:P:K stems leaves stems·) (em) ratio mature immature
I I I b) 2.0 d 44.8 d 30.13 cd 1. 42 cde 65.3 ef 7.4 b
2 1 2.8 d 54.5 d 32.58 abed 1. 39 de 103.0cde 4.4 b
5 I 4.5 cd 227.0 c 36.88 abed 2.78 be 204.8 b 8.9 b
10: 7.0 be 564.0 a 44.42 a 4 26 a 188.9 b 8.4 b
2 3.0 d 37.3 d 30.38 cd 1. 25 de 59.1 f 4.0 b
5 3.3 d 77.8 d 26.Utl d 1. 54 cde 63.1 ef 9.9 b
: 10 : 3.0 d 86.5 cd 35.23 abed 1.47 cde 68.6 ef 10.1 b
I 2 3.3 d 44.5 d 28.21 cd 1.37 de 52.9 f 3.8 b
5 4.3 d 53.8 d 34.42 abed 1. 93 cde 5·1. 0 f 8.5 b
: 10 3.3 d 65.8 d 34.06 abed 1.39 de 40.5 f 8.4 b
2 2 2 3.0 d 93.5 cd 3121 bed 152 cde 120.9 cd 8.6 b
5 5 5 7.3 b 400.3 b 40.17 abc 2.76 bed 130.1 c 40.9 a
10: 10 : 10 10.5 a 471.tl ab 43.25 ab 3.69 ab 248.1 a 38.3 a Values are means of four replicat s. Means with different letters in the same column show significant differences by Duncan's multiple range test at p=O.05.
0) mean of the three longest stems.
b) standard treatment.
a
300
.."
be
0 0.
....
0
200 e
..
......0
c de
z = 100 ef
o
N 1 Z 5 10 1 1 1 1 1 1 Z 5 10P 1 1 1 1 Z 5 10 1 1 1 Z 5 10 K J 1 I 1 1 1 I 2. 5 10 Z 5 10 Fig.4 Number of total pods in the plants given exces.';ive fertilizer
Data are means _ SD of four replicates. Bars with different letters how 'ignificant differenc by Duncan's multiple range test at p=O.05.
..c
01)
~
~ III
III E ~
... 3.0
~
~
-
III ~...
('II
....
,Q ~ 0
....
-0.!. ~('01 ('II 01)
~
('01
2.5
~ ::.>
c
'"
c c0
'"
uC eJ
...
<:J
C ..c c..
C ('II C
f-o 0 ('II
'" 0
..c
.~3.5
Q)
:t:
...
eJ
'" ...
~
-
~ .&:I ('II'" ....
03.0
0....
..c 0 ~('01 01)
~
'"
('II~ c c it
eJ
2.5
C
.-
C Q)U
...
<:J
c ..c c..
C
('01 c
0 ('01
'" 0
1\ 1 2 5
10
1 1 1 1 1 I 2 510
P 1 1 1 1 2 5
10
1 1 1 2 510
K 1 1 I 1 1 1 1 2 5
10
2 510
Fig. 5 Tannin concentration in leaf blades on th one- ear-old stem (upper), and on the new hoots (lower) in th plant: giv n exce 'ive fertilizer
Bars repr sent means ± SO of four replicat s.
elements alone over the treatments did not exhibit beneficial enhancement of dry matter produc- tion.
Tannin concentration in leaf blades reduced by exces ive nitrog n application. Neera et a/G) studied in (lit1'O culture' of !::>'apill/il sebl/emm and showed that a larg amount of ge.raniin was produc d in the callus cultured of synthetic medium without l TH, 03 . The addition of nitrogen source to the medium \\'a' not effective to produce tannin. This suggests that f··rtilizer manipulation to increa,,~ plant dry \\'E ight may be feasible by the applying high rate~ of nitrogen, which also results in reducing the concentration of tannin in leaf blades when considered in dry weight.
In conclusion, appling chemical fertiliZer application stimulated the dry matter production of
Geranium thunbergii. The application of deficient fertilizer clearly decreased in dry weight. On the other hand, increasing the fertilizer rate, especially the amount of nitrogen, had important influences for obtainable dry weight. This plant exhibited a sensitive response to nitrogen application, which produced a larger yield by adding 5 or 10 times the compound fertilizer of standard treatment. However, tannin concentration in leaves decreased by adding chemical fertilizer.
REFERENCES
1) H.A. Mooney, W.E. Winner, E.]. Pell, "Response of Plants to Multiple Stresses," Academic Press, Inc., California, 1991, p. 422.
2) S. Fujita, "Yakuyoushokubutsu Saibai Zenka," Noson·Gyoson Bunka Kyokai, Tokyo, 1972, p.388.
3) T. Okuda, K. Mori, T. Hatano, Chern. Pharm. Bull., 33, 1424 (1985).
4) M.G. Hale, D.M. Orcutt, "The Physiology of Plants under Stress," John Wiley and Sons, Inc., New York, 1987, p. 206.
5) T.P. Hignett (ed.) , "Fertilizer Manual," Martinus Nijhoff, etherland,] 985, p.363.
6) S. ;\Jeera, H. Arakawa, K. Ishimaru, Phylochemisl1y, 31, 4143 (]992).
ll) 近鼓大学農学部紀要 第 29号 (1996)
N‑ p‑ K 施肥量が薬 用植物, ゲ ンノシ ョウコ, の成育 と収量 に及 ぼす影響
ス リン ニ ルサム ランナ ッ ト ・尾垣 光治 ・ 芦 田 馨 ・杉野 守
要 約 紘,本楯物 の成長皿 (地上部乾並) は約半分 に減少 典用植物の栽培においては,利用植物体の増収 に したが,薬のタンニン含血 はほ とん ど変わ らなかっ 加 えて,その薬効成分含iiの増加 とさらに特 に瞳床t た。 また施肥止,特 にN要紫 を 5倍,10倍 に して与 の面か ら,それ らの含有率の安定化が望 まれている。 えると,成長且 は 2‑ 4倍 に増加ル たが, タンニ ン 本報告で は, 日本 において薬草 として広 く利用 さ 舎兄 はやや減少 して,対照植物 のおよそ77‑95%と れて きたゲ ンノショウコについて,栽培条件の うち なった。これ らの結果 よ りゲ ンノシ ョウコの成育 は, 施肥条件 を大 きく変 えた場合 に本葬等 の成育 と収丑 施肥血によ り大 きく変化するがタンニ ン含Etの変化
に及ぼす砂廿 を調べた。 は比較的に少ない と考 えられる。
tF行施肥免 を対照 区 として その半 屯 の施肥 区で