(Research note)
Calorific Value of Japanese Coniferous Wood
By
Fusako
ABEmSummary : Calorific value is one of the most important factors for the evaluation of fuels. It is inevitable for combustion calculation, furnace designing, commercial fuel trading and potential estimation of forest resources.
But there is only limited information on common Japanese wood species, especially on coniferous wood.
In this paper, calorific values of nineteen Japanese coniferous species were determined and the mean value, the standard deviation, and the coefficient of variation were culculted as 4,972cal/g, 161.3 and 3.2% respectively. These values agree with SATONAKA's data for twelve coniferous wood samples produced in Hokkaido.
The correlation between chemical constituents and the calorific value was also examined, and a linear correlation was found between content of alcohol·benzene extracts and the calorific value.
The author also presented a convenient figure that shows the relationship between calorific value and moisture content of broad leaved and coniferous wood.
1.
Introduction
Calorific value is one of the most important factors for fuel evaluation. It is essential not only for trading commercial fuels, designing combustion furnaces, and selecting a suitable fuel for burning apparatus but also for estimating forest potentials.
Working in the Fuel Chemistry Laboratory with the main subject being Energy from Forest Biomass, the author frequently receives inquiries about the calorific values of wood and woody materials from the outside.
It is well known that the calorific value of coniferous wood is higher than that of broad leaved wood because the coniferous one has relatively higher contents of resinous material and essential oils. SATONAKA in his previous paper1l determined the calorific value on twelve
coniferous and fifty·nine broad leaved species produced in Hokkaido. He obtained 4820 mini-mum, 5170 maximini-mum, and the mean value of 4960caljg, OD* wood from measurement of coniferous samples; this mean value was about 200 cal/g higher than that of broad leaved wood, that is 4730 cal/g, OD wood. Surprisingly enough, we cannot see only a few official data of the determined calorific value, especially on the Japanese coniferous species, except SATONAKA'sll.
The calorific value of wood varies according to 1) place of production, 2) individual trees in the forest, 3) position in each tree; e. g. leaf, trunk, twig etc. Since it is very difficult to collect all kinds of sample classes for determination, we have to accumulate as much actual data of calorific values as possible in order to get precise, universal value.
In this paper the author determined the calorific value on nineteen Japanese coniferous
Received October 4, 1985
(1) Forest Products Chemistry Division
*
Oven Drysamples provided from undermentioned project and in addition, a Japanese alpine tree, Pinus pumila and five foreign coniferous samples. The first nineteen samples were selected from the samples used in a project carried out in our institute2'. This project named "The pro-perties of the Important Japanese Woods" started in 1963 and has been continuously carried out for more than ten years. The wood samples for this project were collected from many parts of Japan. Sampling from each log was conducted very carefully, and the physical and chemical properties of each sample were proved through intensive analyses over many items. This project, however, started more than ten years before the 1972 Energy shock. At that time only a few people had an interest in the forest biomass fuels which might have been one of the important alternative energy resources.
Next, the correlation between calorific value and content of chemical constituents which have been determined3 ' in the above project was estimated. A linear correlation was found between the contents of alcohol-benzene extracts or a-cellulose and calorific value.
Fig. 4 shows that the calorific value declines according to the increase of moisture con· tent. This figure is simple and convenient for evaluation of combustion characteristics for practical purposes.
2.
Method of determination and representation of
the measurement values
Calorimetrical determination was carried out in accordance with JIS M 8814-1985, and obtained values were represented by integral numbers. The apparatus used was Automatic Bomb Calorimeter CA 3, manifactured by Shimazu Corporation.
Simultaneously, the moisture content was determined by drying sample with an electric oven, keeping the temperature at 105°C, until the weight of the sample became constant, and percentages of weight loss were presented on a green wood basis. Then calorific value was expressed on a basis of oven dry wood. The advantages of this way is to normalize the calorific value and to make it easier to compare the determined value with that of the other woody materials.
3.
Results and discussion
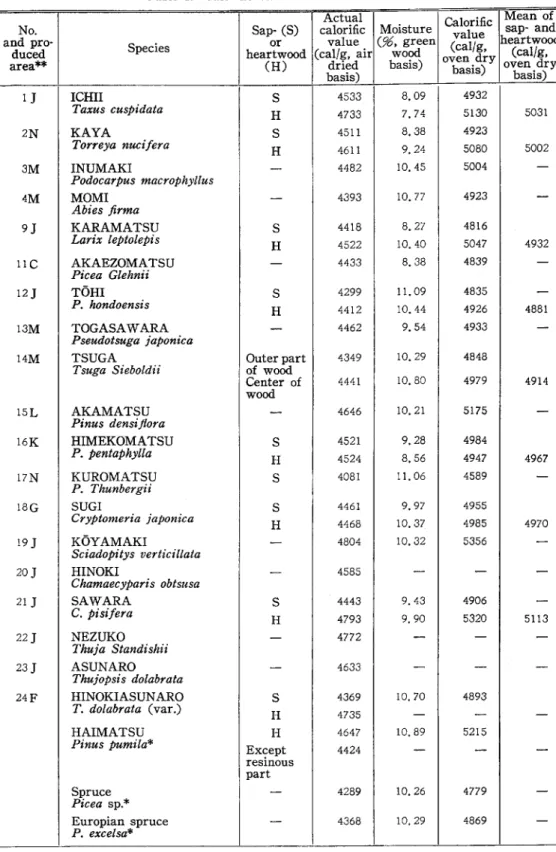
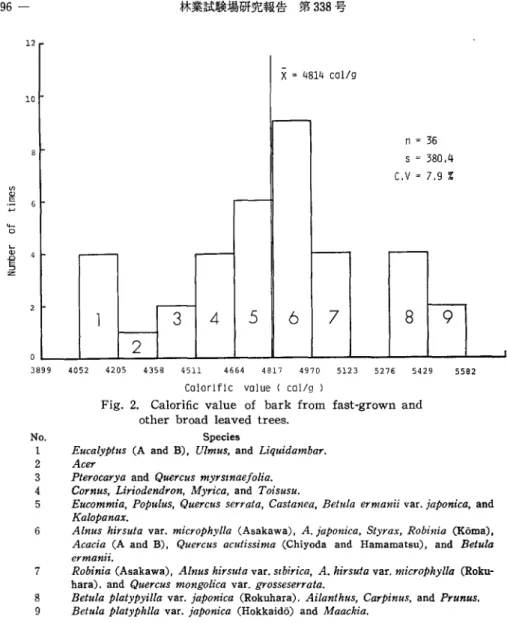
Obtained calorific value and moisture content from 1 J Taxus cuspidata to 24 F Thujopsis dolabrata and that of the other six samples are presented in Table 1. Twenty-four determined values are presented in the second column on the right of this Table, ranging from 4589 to 5356 cal/g : the mean value is 4972 cal/g, OD wood, and the standard deviation and the coef-ficient of variation are 161.1 and 3.2% respectively. These figures agree with SATONAKA's datall on twelve coniferous species produced in Hokkaido (Table 2). As indicated in Table 2 the coefficient of variation are quite small except that of the bark sample : they are 1% on the broad leaved and 2~3% on the coniferous wood. On the other hand, the coefficient of the bark sample is 8%. Thereby two histograms can be provided on thirty-six fast-grown and other broad leaved trees; 1) the coefficient of variation of wood is 1% (Fig. 1) 2) that of the bark connected with the wood is 8% (Fig. 2). There are two distribution patterns of the calorific values measured on the sample wood and bark. Owing to these histograms, a dif-ference among these distribution patterns can be seen quite clearly.
Next, the correlation between the chemical constituents and the calorific value was exa-mined. These chemical constituents had been difined by the successive analyses in the
above-Table 1. Calorific value of coniferous wood.
Actual Calorific Mean of
No. Sap· (S) calorific Moisture value sap· and
and pro· Species or value (%,green (cal/g, heartwood
duced heartwood (cal/g, air wood oven dry (cal/g,
area** (H) dried basis) basis) oven dry
basis) basis) 1
J
ICHIIs
4533 8.09 4932 Taxus cuspidata H 4733 7.74 5130 5031 2N KAYAs
4511 8.38 4923 Torreya nucijera H 4611 9.24 5080 5002 3M INUMAKI-
4482 10.45 5004 -Podocarpus macrophyllus 4M MOMI - 4393 10.77 4923 -Abies firma 9} KARAMATSUs
4418 8. 27 4816 Larix leptolepis H 4522 10.40 5047 4932 IIC AKAEZOMATSU - 4433 8.38 4839 -Picea Glehnii 12} TOHIs
4299 11.09 4835 -P. hondoensis H 4412 10.44 4926 4881 13M TOGASAWARA-
4462 9.54 4933 -Pseudotsuga japonica14M TSUGA Outer part 4349 10.29 4848
Tsuga Sieboldii of wood
Center of 4441 10.80 4979 4914 wood 15L AKAMATSU
-
4646 10.21 5175 -Pinus densijlora 16K HIMEKOMATSUs
4521 9.28 4984 P. pentaphylla H 4524 8.56 4947 4967 17N KUROMATSUs
4081 II. 06 4589 -P. Thunbergii 18G SUGIs
4461 9. 97 4955 Cryptomeria japonica H 4468 10.37 4985 4970 19J
KOYAMAKI-
4804 10.32 5356 -Sciadopitys verticiltata 20J
HINOKI-
4585-
-
-Chamaecyparis obtsusa 21J
SAWARAs
4443 9.43 4906 -C. pisifera H 4793 9.90 5320 5113 22J
NEZUKO-
4772-
-
-Thuja Standishii 23J
ASUNARO - 4633 --
-Thujopsis dolabrata 24F HINOKIASUNAROs
4369 10. 70 4893 T. dolabrata (var.) H 4735 --
-HAIMATSU H 4647 10.89 5215Pinus pumila* Except 4424
-
-
-resinous part Spruce - 4289 10.26 4779
-Picea sp.* Europian spruce-
4368 10.29 4869 -P. excelsa*Table 1. (Continued)
Actual Calorific Mean of
No. Sap- (S) calorific Moisture value sap- and
and pro- Species or value (%,green (cal/g, ~eartwood
duced heartwood (cal/g, air wood (cal/g,
area (H) dried basis) oven dry oven dry
basis) basis) basis)
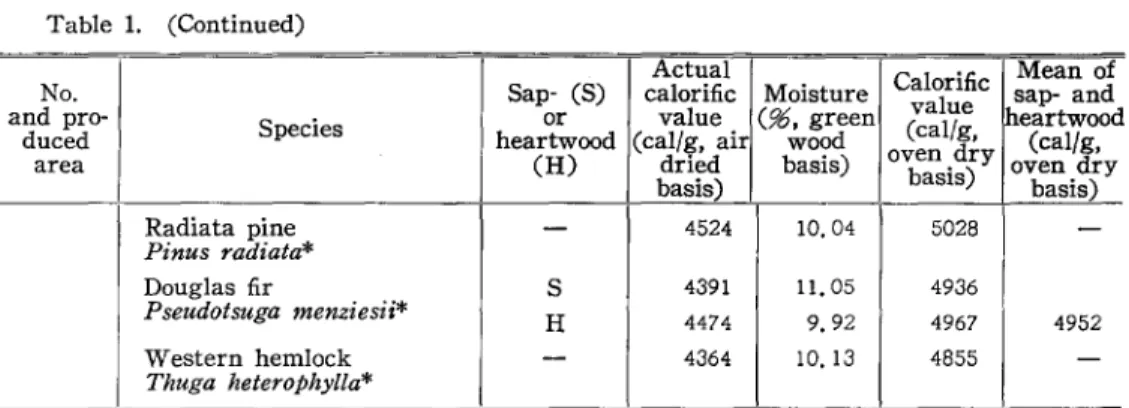
Radiata pine Pinus radiata*
-
4524 10.04 5028 -Douglas firs
4391 11.05 4936 Pseudotsuga menziesii* H 4474 9.92 4967 4952 Western hemlock-
4364 10.13 4855 -Thuga heterophylla**
Market species are out of series of the project.**
Produced area ; C: Obihiro (Regional Forestry Office, the rest is omitted.), F: Aomori, G: Akita, J : Nagano, K : Nagoya, LLOsaka, M : Kochi, N : Kumamoto.Table 2. Representatives for determined calorific values (cal/g, oven dry basis) on several reports.
Calorific value Coefficient
Sample n Standard of
I
I
deviation variationMax. Min. Mean
(%)
Coniferous wood 24 5356 4589 4972 161. 3 3.2
Coniferous wood 12 5170 4820 4963 114.7 2. 3
produced in Hokkaido
Broad Iieved wood 59 4970 4610 4727 60.3 1.3
produced in Hokkaido
Wood from fast-grown 36 4882 4624 4710 54.7 1. 2
and other broad leaved tree
Bank form fast-grown 36 5581 4052 4814 380.4 7. 9
and other broad leabed tree Author AeE, in this paper SATONAKAl> ditto AeE4> ditto
mentioned projects>. When single correlations were calculated, the analytical percentage of chemical constituents were to be the independent variables X1~X6 and the calorific value was to be the dependent variable Y (Table 3). The first column on the right in Table 3 in-dicates the mean calorific value of sap- and heartwood presented in Table 1, If the first column lacks these values, the second column provides for them.
As for the chemical constituent, although there is no data on ash content on Table 3, its values have been reported in the original papers>. The ash content ranges from 0.14% (Pseu-dotsuga japonica) to 0.73% (Thujopsis dolabrata) and the mean value is 0.38%. These per-centages are much lower than that of fossil fuels like coal, and this is very important for fuel evaluation.
Correlation between each X1~X6 and Y was calculated. It was found that the correla-tions between X2 (alcohol-benzene extracts) or x~ (a-cellulose) and Y were significant.
Regressions and coefficients of correlation are as follows; in a case of alcohol-benzene extracts;
Y = 29.0 X 2
+
4828.1 r = 0.588* (degree of freedom: 14)'-Q) .0
,.
10 t-..-r-X
=
4710 cal/g
--n
36s
54.7
c.v
=
1.2
%
5
z: 8 t-6 f-4 -2-l
2
I I I3
I
I 0 3899 4052 4205 4358 4511 4664 4817 4970 5123Calariflc value ( cal/g l
Fig. 1. Calorific value of wood from fast-grown andother broad leaved trees.
n : Number of samples, s : Standerd deviation, C. V : Coeffcient of variation. Fig. 2 is same.
No. Species
I
5276
1 Eucommia, Pterocarya, Ailanthus, Quercus acutissima (Hamamatsu), Q. serrata,
Betula ermanii, and Prunus.
2 Robinia (Asakawa and Koma), Alnus hirsuta var. mycrophylla (Asakawa and
Rokuhara), A. hirsuta var. sibirica, A. japonica, Cornus, Styrax, Populus, Betula
platyphylla var. japonica (Rokuhara and Hokkaido), B. ermanii, Liriodendron,
Acacia (A and B), Eucalyptus (A), Quercus acutissima (Chiyoda), Q. myrsinaefolia,
Q. mongohca var. grossesrrata, Castanea, Myrica, Acer, Toisusu, Carpinus, Ulmus,
Maackia, Kalopanax, and Liquzdambar.
4-0 12 X = 4814 calfg 10 r -n = 36 s = 380.4 C.V=7.9% , .
--
...--
f - - r--
:-1
3
4
5
6
7
8
9
-2
3899 4052 4205 4358 4511 4664 4817 4970 5123 5276 5429 5582Calorific value ( cal/g l
Fig. 2. Calorific value of bark from fast-grown and other broad leaved trees.
No. Species
1 Eucalyptus (A and B), Ulmus, and Liquidambar.
2 Acer
3 Pterocarya and Quercus myrstnaefolia.
4 Cornus, Liriodendron, Myrica, and Toisusu.
5 Eucommia, Populus, Quercus serrata, Castanea, Betula ermanii var. japonica, and
Kalopanax.
6 Alnus hirsuta var. microphylla (Asakawa), A. japonica, Styrax, Robinia (Koma),
Acacia (A and B), Quercus acutissima (Chiyoda and Hamamatsu), and Betula
ermanii.
7 Robinia (Asakawa), Alnus hirsuta var. szbirica, A. hirsuta var. microPhylla
(Roku-hara). and Quercus mongolica var. grosseserrata.
8 Betula platypyilla var. japonica (Rokuhara). Ailanthus, Carpinus, and Prunus.
9 Betula platyphlla var. japonica (Hokkaido) and Maackia.
and, in a case of a:-cellulose;
Y = -18.6 x~
+
5814.8 r = 0.456* (degree of freedom : 14)* :
Significant at 10% risk level.In Fig. 3, the correlation of X2 - Y was illustrated. No significant correlation was found between lignin content and calorific value : obtained coefficient of correlation was only r =
0.059 (degree of freedom : 14).
In general, about 6% of hydrogen is contained in oven dry wood, and in combustion with sufficient oxygen, the hydrogen escapes as water, which causes lowering calorific value about 300cal/g on moisture free wood. Fig. 4 shows the straight decline of calorific value in propor-tion to an increase of the moisture content of the wood.
This decline, that is, H N (net calorific value) can be calculated using the following equation.
Table 3. Chemical constituents and calorific value of sample wood.
Wood analysis (%*) Calorific
No. and Soluble in pro· Species duced area** 1 J Taxus cuspidata 2N Torreya nucijera 3M Podocarpus macrophyllus 4M Abies firma 9J Larix leptolepis 11C Picea Glehnii 12 J P. hondoensis 13M Pseudotsuga japonica 14M Tsuga Sieboldii 15L Pinus densiftora 16K P. pentaphylla 17N P. Thunbergii 18G Cryptomeria japonica 19 J Sciadopitys verticillata 21 J Chamaecyparis pisi/era
24F Thujopsis dolabrata (var.)
* :
Oven dry basis,** :
See Table 1. 5500 "' ' 5000 " v ~ Hot water X1 11. 1 6.7 3. 2 3. 6 9.5 2,8 3.3 4. 4 4. 1 3.9 3. 2 3.0 3. 1 6.6 7.4 4.5 0 > y = 29.0X + 4828.1 DF = 14, r = 0,5878"" ~ 0 c u 4500 0 10Alcohol -benzene extracts ( % l
Fig. 3. Correlation between alcohol· benzene extracts and calorific value.
*
Signifficant at 5% risk level.Ale· ben· zene
x2
11.5 6.6 1. 5 2. 3 3. 2 2.0 2.2 3.5 3.0 4. 1 8. 1 3.3 2. 6 11.0 9.4 4.2 valuePen· Hollo· t;t- (cal/g*)
tosan cellu· cellu· Lignin
"'
0 u"
"
0 > u .._ ~ 0s
~' "' :z lose loseI
Xs X4 X6 X a y Ref. 5. 5 58.5 38.2 28. 1 5031 4.9 63.8 45.3 34.5 5002 10.9 65.0 49.4 35.7 5004 5.2 69.8 49,0 33.5 4923 5. 6 68.5 47.8 28.0 4932 6. 7 73.5 49.9 27,8 4839 5.2 64.4 41.9 28.8 4881 5, 1 68. 1 47. 1 33. 1 4933 Heart· wood 4.3 71.0 51,0 31. 1 4914 7,0 65.8 43.6 26. 1 5175 4.7 68.4 44.5 27. 1 4967 6.7 62.9 44.0 25,8 4589 7. 3 73.3 48,6 32.3 4970 4.7 60.8 38. 7 28,5 5356 5. 1 60.2 41.0 30.7 5113 5.9 75,2 48.4 33.0 4893 X10
35
4
3
2
QL...----l--....J....-...L---1---1...0
2
3
4
5
xlQ
Moisture content ( % lFig. 4. Decline of calorific value with increasing moisture content. Note : Calculated with gross calorific values
of 4970 and 4710 cal/q for oven dried coniferous and broad leaved wood respectively.
there, H a : gross calorific value h : amount of hydrogen w : amount of moisture (cal/ g) (%) and
(%)
According to Fig. 4, calorific value is about 2000 cal/g when the moisture content is 50%, and when moisture content is 10~20% (air dry wood), the calorific value is 3800~4100cal/g.
Fig. 4 provides practical information for the combustion of wood fuels.
Acknoweldement
The author wishes to thank Mr. Saburo UEsUGI and Dr. Takateru AKASHI of Forest Products Research Institute for providing the sample woods and calculating the correlations, and to Mrs. Shizuko NAKAMURA for her helpful assistance in the calorimetry.
References
1) SATONAKA, S. : Fundamental study on wood carbonization. The Research Bulletin of the College Experiment Forest, College of Agriculture, Hokkaido University, 22, 609~814,
(1963)
2) UEMURA, T. and UMEHARA, M.: The properties of the important Japanese wood. Planning study. Bulletin of the Government Forest Experiment Station, 153, 2~14, (1963), and the serial reports.
3) YoNEZAWA, Y., KAYAMA, M., KIKUCHI, F., UsAMI, K., TAKANo, I., OGINO, T. and HoNDA, 0.: The properties of the important Japanese woods. Chemical analysis, kraft pulping and paper· making characteristics of the Japanese woods, ibid, 253, 55~99, (1973)
4) AsE, F., KIGURE, M. and ENoo, M. : Manufacture of charcoal from fast·grown trees and burning and gasifying characteristics of charcoal produced II. The bark ratio and calorific value of sample woods. J. of the Japan Wood Research Soc, 29, 915~924, (1983)
(研究資料)
日本産針葉樹材の発熱量について
阿部房子ω 摘要 木質エネルギーを考える上で,木材の発熱量は欠く乙とのできない燃料評価上のパラメータである。実 燃焼の際の燃料の選択,燃焼装置の設計または商取引だけでなく,エネルギー資源量調査における林分の ポテンシャノレ推定に際しでも必要な計算基礎となる。 一般に針葉樹は樹脂・精油分が多く広葉樹より発熱量が高いことが知られている。里中によれば,北海 道産針葉樹材 12 種について最小 4, 820,最大 5, 170,平均 4,960 cal/ g (全乾ベース〉が得られており, 乙れは同じく北海道産広葉樹 59 積の平均値 4, 730cal/g より約 200cal/g 高い。しかし既往文献には意外 と国産材,とくに針葉樹材についての実測発熱量の記載が少し産地や個体,個体内の部位その他の諸フ ァクター別に,それらを網羅した試料の収集は難しいので,やはり数多くのデータの積み重ねによる普遍 的な数値の推定が必要である。林業試験場では 1963 年より 10 年計画のプロジェクト「日本産主要樹種の 性質J の対象試料として針葉樹 24 種,広葉樹 46 種を収集しており, それらの材の採取地, 木取り,比 重,容積密度数,平均年輪帽をはじめ物理的,物理化学的および化学的諸性質が,極めて,ことこまかに 調査されている。乙のプロジェクト用試料の中より針葉樹 19 種を供試し, 同時に比較のための国産ハイ マツ材および外国産針葉樹材計 6 樹種についても発熱量を実測した。 試料の番号・記号は上記プロジェク卜と共通である。発熱量測定と同時に試料水分を測定し,実測値と 全乾ベース換算発熱量とを併記した。発熱量測定は]IS M 8814-1985 に準じて行った。使用機種は島津 製作所製自動ポンプ熱量計 CA-3 である。 Table1 の lJ イチイ ~24F ヒノキアスナロについて得られた数値は,最大 5, 356,最小 4, 589,平均 4, 972cal/g で,標準偏差 161. 3,変化率 3.2% で, 乙れらは前述した里中の北海道産材 12 種の値と極め てよく一致している (Tab!e 2)0 Tab!e 2 1ζ 同時に掲げた他の試料を含めて,樹皮以外の材についての 変化率は極めて小さく,広葉樹材で 1%,針葉樹材で 2~3%である。なお樹皮では変化率 8%である。 出現頻度を示す発熱量の階層別棒グラフを早生樹およびその他の広葉樹の材と,材に附着していた樹皮と について作成したものを参考までに示せば Fig. 1, 2 の通りで,変化率 1% の場合(材)と 8% の場合 (樹皮〉との分布の差が明らかである。 つぎに前記したように今回の試料は一連の試験・分析がすでになされているので,その中から木材分析 値を Tab!e 3 に表出し (Xl~X6 とする),今回実測した発熱量 Y との相関関係を調べた。材の発熱量 は Tab!e 1 の右端の列の辺・心材平均値とした。辺心材別の測定値を欠くものについては同表右から 2 列自の値を使った。 1985年10月 4 日受理 (1)林産化学部なお木材分析値の中,灰分%は表中に掲げているが, 0.14% (トガサワラ )~O.73% (ヒノキアスナロ) で平均 0.38% である。 この灰分値は石炭などに比べ非常に小さく,燃料評価上見逃せないことを附記す る。 Xl~X6 と Y との単相関の中, 危険率 5% で X2のアルコーノレベンゼン可溶分%と発熱量 Y との 相関関係が有意であった。 a- セルロース%との相関は負で,危険率 10% で有意であった。 前者を Fig. 3 ,と示す。なおリグニン%との相関は r =0.059 で有意でなかった。 つぎ l乙,会乾木材中には約 6%の水素が含まれ,十分な酸素存在下の燃焼時には当量の水が生成するた め,全乾時でも約 300caI/g の発熱量低下がある。 Fig.4 に材の水分と発熱量の関係を示す直線を示し た。縦軸はいわゆる低発熱量で,次式 lとより計算される。