1. Predictability of the Influence of Stratospheric Motions on the Troposphere after a Sudden Warming Event
1.1 Introduction
Recently, the downward influence of the stratospheric circulation on the troposphere has been a central issue of the stratosphere-troposphere dynamical interaction inspired by the work of Baldwin and Dunkerton (1999, 2001). They statistically revealed evidence of downward propagation of Arctic Oscillation (AO) signature from 10 hPa level to surface on a time-scale of about 3 weeks based on 90-day low-pass filtered data. Since the occurrence of stratospheric sudden warming (SSW) well corresponds to a large negative deviation in the AO signature time series in association with weak polar vortex, their results suggest the enhancement of the meridional meandering of tropospheric circulation after the warming peak of SSW events, which in turn causes anomalous weather conditions. In fact, Baldwin and
Dunkerton (1999, 2001) noticed that weak polar vortex events in the stratosphere precede anomalous tropospheric weather regimes with the southward displacement of the storm track from its climatological position. However, the dynamical mechanism of the downward propagation of AO signature has not been revealed as yet. Moreover, Ambaum et al. (2001) and Itoh (2002) argued that the observed AO itself is mainly a reflection of similar behavior on the Atlantic basin (i.e., North Atlantic Oscillation) and the Pacific basin, and the AO has no physical entity. Therefore, the framework based on the AO argument will not necessarily provide us a suitable direction to elucidate the downward influence of the stratosphere on the tropospheric circulation change after the SSW event.
The precise understanding of the stratosphere- troposphere dynamical coupling becoming prominent during SSW events will also improve extended-range forecast skill by pointing out robust tropospheric 京 都 大 学 防 災 研 究 所 年 報 第47号 C 平成16年3月
Annuals of Disas. Prev. Res. Inst., Kyoto Univ., No. 47 C, 2004
Analysis and prediction of anomalous weather and atmospheric hazards
Hiromasa KAWAI, Tatsuya IWASHIMA, Hiromasa UEDA,
Takashi MARUYAMA, Hirohiko ISHIKAWA, Hitoshi MUKOUGAWA,
Mitsuaki HORIGUCHI, Takao IGUCHI and Tokihiko ARAKI
Synopsis
This paper describes the analysis of various phenomena related with anomalous weather and its hazards, which consists of three parts. The first part describes predictability of the influence of stratospheric motions on the tropospheric circulation change just after the stratospheric sudden warming (SSW) event occurring in December 1998 using 1-month ensemble forecasts performed by Japan Meteorological Agency (JMA). In the second part, temporal changes in vegetation phenologies was investigate by remotely sensed Normalised Difference Vegetation Index (NDVI) data for the background of anomalous weather. An intensive numerical study was also conducted in the second part and the transformation processes are analyzed based on the simulated results. The last part shows the field investigation on the severe damages of structures induced by the typhoon 0314(Maemi) which attacked Miyako Island on 11th September 2003.
Keywords: anomalous weather, Arctic Oscillation, Stratospheric Sudden Warming, land-surface phenologies, vegetation forcing factors, GMS-5, PSU/NCAR MM5 , Typhoon, Tornado, Wind-induced damage, Wind mill
circulation changes associated with SSWs. Thus, in this study, using the operational 1-month forecast data provided by the Japan Meteorological Agency (JMA) based upon a state-of-the-art numerical weather prediction model (NWPM), the predictability of the downward influence of SSW occurring in December 1998 on the tropospheric circulation, especially, the downward propagation of the AO signature noted by Baldwin and Dunkerton (1999, 2001) just after the SSW event is examined in detail.
1.2 Data and Analysis Method
Operational 1-month (30-day) forecasts of JMA during 1998/99 winter were produced every Wednesday and Thursday based upon the GSM9603 model with triangular 63 truncation (T63) and 30 vertical levels (Kusunoki et al. 2001). The model top boundary is located at 1 hPa. Although 1-month forecasts in JMA during this winter season were carried out using ensemble integrations starting from the unperturbed initial condition (control forecast) and 4 perturbed initial conditions, only the control forecast data starting from 1200 UTC every Thursday have been stored every 12 hours for 30-day prediction period. Then, we have investigated 9 consecutive control forecasts during November and December 1998. Each forecast will be referred to as Run 1 (from 1200 UTC 5 November 1998), Run 2 (from 1200 UTC 12 November 1998), and so on. The data are presented on a 2.5 X 2.5-degree longitude-latitude grid at 17 levels from 1000 to 10 hPa. To verify model forecasts, JMA Global Analysis (GANAL) data set with 1.25-degree horizontal resolution at 17 levels from 1000 to 10 hPa from 1 November 1998 to 31 January 1999 was used.
We also used the operational ECMWF twice-daily data set during 1985--2001 with 2.5-degree horizontal resolution at 14 levels from 1000 to 10 hPa to obtain the AO signature index. First, the seasonal cycle, averaged over 17 years and subject to 5-day running average, is removed from the daily grid point heights to define the height anomalies. After applying a 10-day low-pass filter (Blackmon 1976) to the anomalies, we perform a combined EOF analysis which combines geopotential fields at 50, 500, and 1000 hPa levels as in Yamazaki and Shinya (1999) to the low-pass filtered wintertime (November--April) anomalies. The analysis domain is poleward of 20N, and the grid data are weighted by the square root of the cosine of latitude as well as the square
root of density at each level. The leading combined EOF mode corresponding to the AO mode accounts for 11.3% of the total variance. In fact, the regression map for geopotential height at each level corresponding to anomaly values associated with a one standard deviation of the leading principal component is almost identical to that obtained in Baldwin and Dunkerton (1999). Finally, the AO signature at each level is defined as the projection of the daily anomaly field onto the regression map associated with the first EOF mode (AO).
November December
1.3 Results
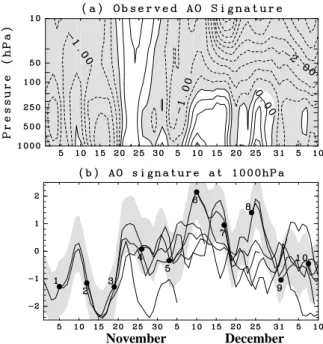
Figure 1a shows the time-height cross section of the observed AO signature from November 1998 to January 1999. The time variation is also similar to that in Fig. 2 of Baldwin and Dunkerton (2001). The weakening of the stratospheric polar vortex associated with the SSW in late December is evident while the downward propagation of the negative AO signature into the troposphere is obscure just after the SSW. The tropospheric AO signature has the opposite sign to the stratospheric signature in late December as described by Fig.1. (a) Time-height cross section of the observed AO signature during November and December 1998. Negative values are shaded. (b) Time variation of the observed (thick line) and the predicted AO signature at 1000 hPa during the same period. The closed circles with numbers denote the initialization time for each forecast (Run 1, Run 2, , Run 10). The shade indicates the range of standard deviation of the AO signature variation during the period of November 1998--January 1999.
Baldwin and Dunkerton (2001). The predicted AO signature at 1000 hPa by JMA 1-month forecast is shown by thin lines of Fig. 1b. The shade indicates the range of standard deviation of the observed AO signature variation for November 1998--January 1999. From this figure, we find that the build up of the observed positive AO signature (thick line) in late December within the troposphere is not predicted at all for all predictions. Moreover, the predicted AO signature gradually decreases for this period, opposite to the observation. Thus, we have to find another predictable component of the tropospheric circulation change just after the SSW.
(a) Analysis (b) Run 4
(c) Run 5 (d) Run 6 (e) Run 7
For this purpose, geopotential height distribution at 500 hPa averaged for 23--25 December 1998 just after the SSW is closely examined (Fig. 2). Focusing upon the Pacific sector, we find a common distinctive circulation pattern among the observation (Fig. 2a) and the predictions (Fig. 2b--e). A prominent blocking high is developed over Alaska in the observation, and this feature is also seen in all predictions except for some differences in its position and strength. On the contrary, in the Atlantic sector, there is no coherent feature among the observation and the predictions. Thus, the prediction of the tropospheric circulation change just after the SSW using the AO signature is not successful since the AO signature represents the hemispheric circulation change.
The dynamics of the blocking formation just after the SSW is also inferred from Plumb's (1985) three-
dimensional wave activity flux for the stationary waves at the 500 hPa as shown in Fig. 3. The flux is calculated from the planetary wave with zonal wavenumber (WN) 1—3 component based on consecutive 5-day mean data as in Kodera and Chiba (1995). At the peak period of the SSW (top panel in Fig. 3b), the northeastward propagation of the wave activity from the low pressure located north of Japan is evident. This propagation persists for the next pentad (middle panel in Fig. 3b), and the blocking high attains its peak amplitude. The blocking, then, fades away through downstream and upward propagation of wave activity in the last pentad (bottom panels in Fig. 3a,b). Figure 3a also suggests that the simultaneous enhancement of the anticyclone over Alaska in both the stratosphere and the troposphere just after the warming peak is an accidental coincidence since the anticyclone has a node structure near the tropopause without vertical propagation of wave activity across the tropopause (top panel in Fig. 3a).
From these observations, we could conclude that the
(a) (b)
Longitude Longitude
Fig.3. (a) Longitude-height cross section for x and z components of Plumb's wave activity vector for stationary waves at 60N calculated from the planetary wave component (WN 1--3) averaged over 5 days: 16--20 December 1998 (top panel); 21--25 December 1998 (middle panel); 26--30 December 1998 (bottom panel). The magnitude of the vector is multiplied by 10 above 100 hPa. Contours show the geopotential height field of the planetary wave component. Contour interval is 100 m and negative values are shaded. Arrows in the right bottom corner correspond to (100.0, 0.5) m2s-2. (b) Same as (a) but for the horizontal components of Plumb's wave activity flux for stationary waves at 500 hPa. Arrows in the right bottom corner correspond to (25.0, 25.0) m2s-2 during the period of November 1998--January 1999.
Fig.2. Three-day mean geopotential height field at 500 hPa for the period of 00 UTC 23 December 1998--12 UTC 25 December 1998. (a) Observation; (b) Run 4 from 12 UTC 26 November 1998; (c) Run 5 from 12 UTC 3 December 1998; (d) Run 6 from 12 UTC 10 December 1998; (e) Run 7 from 12 UTC 16 December 1998. Contour interval is 100 m. during the period of November 1998--January 1999.
most important process for the blocking formation over Alaska is the poleward propagation of the wave activity from the upstream low pressure system north of Japan. Moreover, the persistent enhancement of the cyclonic circulation with northwest-southeast phase tilt in the troposphere is associated with the amplification of tropospheric WN 1 component triggering the SSW by poleward and upward propagation of the wave activity. This type of dynamical coupling between the stratosphere and the troposphere through the meridional phase structure of planetary waves just after some SSWs has been also reported by Kodera and Chiba (1995). Therefore, we could expect that the blocking formation just after the SSW is robust and has an extended predictability. Indeed, the time series of the observed and the predicted zonal index at 500 hPa over the Pacific sector will indicate that this is the case as shown in Fig. 4. Here, the zonal index over the Pacific sector is defined as geopotential height difference between 40N and 70N averaged over the longitudes between 135E and 135W. The observed zonal index (thick line) shows a clear transition from the high-index state to the low-index state just after the SSW in association with the blocking development. The shade again shows the standard deviation of zonal index variation during November 1998--January 1999. Focusing upon the zonal index transition just after the SSW, we find that forecasts starting after 1200 UTC 3 December (Run 5) well predict this transition although the predicted transition in Run 5 takes place a few days earlier than the observation. Furthermore, Run 4 starting from 1200 UTC 26 November also predicts the transition except for 7-days delay in its timing. Thus, the zonal index transition over the Pacific sector associated with the blocking formation is predictable from at least 3 weeks in advance and has a prolonged predictability. However, we also have to mention that the persistence of the low-index state is not well predicted at the end of December.
The blocking formation is usually considered as a highly unpredictable component of the tropospheric circulation change due to its abrupt occurrence taking account of the role of synoptic scale disturbances in the blocking formation (Arai and Mukougawa 2002). In fact, Kimoto et al. (1992) reveals that a blocking event occurring over the Pacific sector in early February 1989 is unpredictable by forecasts initialized 6 days or more prior to the onset of the blocking; this blocking is formed without preceding major stratospheric sudden warming
November December
event. Thus, the prolonged predictability of the blocking formation in late December 1998 revealed in the current study reflects a control effect of the tropospheric circulation by the stratospheric motion through the meridional structure of planetary waves with long time scale. It is also interesting to remark that the persistence of the high index state during early December prior to the peak period of the SSW is also well predicted by JMA 1-month forecasts, corresponding to the enhancement of the cyclonic circulation north of Japan associated with WN 1 amplification. Therefore, we could conclude that the transition from the high index state to the low index state over the Pacific sector associated with the occurrence of the SSW is one of the most promising candidates for the predictable component of the tropospheric circulation change during the SSW event.
1.4 Concluding Remarks
We examined the predictability of the Arctic Oscillation (AO) signature variation in the troposphere just after the stratospheric sudden warming (SSW) event occurring in December 1998 by the use of control runs of the 1-month ensemble forecasts performed once a week by Japan Meteorological Agency (JMA).
Although the downward propagating property of the AO signature from the stratosphere into the troposphere statistically revealed by Baldwin and Dunkerton (1999, 2001) suggests a prolonged predictability of the AO signature, the 1-month forecasts of JMA fail to reproduce
Fig.4. Time variation of the observed (thick line) and the predicted zonal index defined as the 500 hPa geopotential height difference between 40N and 70N averaged over the longitudes between 135E and 135W. The closed circles with numbers denote the initialization time for each forecast (Run 1, Run 2, Run 10). The shade indicates the range of standard deviation of the zonal index variation during the period of November 1998--January 1999.during the period of November 1998--January 1999.
the time variation of the AO signature in the troposphere due to incoherent circulation properties in the Atlantic sector among predictions. On the contrary, we found an extended-range predictability of the transition from the high index state to the low index state in the troposphere over the Pacific region just after the SSW event associated with the formation of the prominent blocking over Alaska. The prolonged predictability of the transition is explained by the robustness of the blocking formation caused by the poleward propagation of planetary waves in association with the preceding SSW event as reported by Kodera and Chiba (1995). Therefore, our study succeeded in pointing out the existence of a tropospheric circulation change with an extended-range predictability through the stratosphere-troposphere dynamical coupling during the SSW event beyond the limit of the predictability of the respective weather systems.
For further study, we are now examining the predictability of other warming events in 2001/2002 winter using all the ensemble members of JMA1-month forecast. The dynamical scenario concerning the stratospheric effect on the tropospheric circulation after the SSW will be verified in detail by this investigation. Of course, we are also planning to perform hind cast ensemble forecasts using JMA 1-month prediction model to ensure the predictable circulation change during the SSW event when the dynamical linkage between stratosphere and troposphere becomes prominent.
1.5 Acknowledgments
We would like to thank all the members in Numerical Prediction and Climate Prediction Divisions in JMA for providing us 1-month forecast data sets of JMA. The GFD-DENNOU Library was used for the graphics.
2. Anomalous weather and severe wind storms 2.1 Deriving parameters from remotely sensed data
and applications in the climate models
Remote sensing is increasingly used for investigating land-surface phenologies by capitalizing on the recent availability of space borne optical and radar data. This research detects temporal changes in vegetation phenologies and attempts to attribute these changes in vegetation to some identifiable vegetation forcing factors, such as human activities, climate, and natural factors. Human activities, such as settlement, agricultural practices, and pollution, can significantly impact
vegetative cycles. In the absence of human influences, vegetative growth (recurring biological cycles) is seasonally regulated and primarily a function of temperature and precipitation. Remotely sensed Normalized Difference Vegetation Index (NDVI) data from the National Oceanographic and Atmospheric Administration’s (NOAA) Advanced Very High Resolution Radiometer (AVHRR) is used to model the impact of both anthropogenic influences and natural disturbance regimes/climate on vegetation phenologies at regional and national scales. Specifically, NDVI NOAA AVHRR data from 1982 to 2000 is used to discriminate the influence of human activities from climatic and natural factors using the Discrete Fourier transform (DFT). Harmonic analysis of temporal NDVI in southern China shows that the first harmonic is in-phase with atmospheric temperature, while the second and third harmonics capture the combined influence of human activity information and climate on vegetation. But in northern China and the Qingzang plateau, sandstorms and snow cover obfuscate the second and third harmonics, making correct interpretation difficult. In all, meteorological data from 560 observations are analyzed in order to detect changes to land-surface phenologies. This work can be extended by attempting to attribute changes in vegetation to specific climate forcing factors, such as greenhouse gases and human influences such as deforestation.
2.2 Long-term Estimation of ground surface temperature of the Tibetan Plateau
The Tibetan Plateau has an important role on the Asian Monsoon, hence it strongly affect the weather around Japan. The Tibetan Plateau protrudes in the middle of troposphere. The plateau surface acts as a strong heat source in the middle troposphere, since the plateau surface is heated as much as 50 Celsius in the daytime. The long-term variability of the Plateau surface was retrieved using GMS-5 data. Oku and Ishikawa (Journal of Applied Meteorology, Vol. 43, No. 4, 548-561(2004)) established the methodology to retrieve the ground surface temperature using GMS-5 data. Using this method, long-term variability of the Plateau surface temperature was estimated as shown in Fig.5. The trend of increasing surface temperature is clarified in this research. The impact of this surface temperature increase on the Asian Monsoon and the weather condition will be investigated in the future research.
2.3 Development of Integrated Regional Water circulation model and its application to hydrology in the western Asia
This research is one of the research projects of Research Renaissance 2002 supported by Ministry of Education, Science, Sports and Culture of Japan. The objectives are the development of ‘Hydrological circulation modeling system’ applicable to local and Regional scale hydrology and its application to the impact of greenification of desert.
In order to combine various software modules such as atmospheric model, ocean model, wave model, land-surface model, sea-surface model etc., a series of model coupler software was developed. For the land-surface model, a new model, SOLVEG, was developed. This model is characterized by the better resolution of the canopy layer and the consideration of bacterium processes in the soil layer for the Carbon Dioxide emission. The performance of the model is assessed against field data.
The modeling system was applied to the maritime desert area at the southeast of Saudi Arabia. A preliminary assessment of the impact of greenification was conducted. The increase of convective- and non-convective-clouds and the associated increase of precipitation were computed by the modeling system.
2.4 Typhoon Research
The typhoon is one of the most hazardous meteorological disturbances affecting Japan. Especially, the typhoons interact with mid-latitudes’ baroclinic environment and the structure is transformed. During this transformation various meso-scale disturbances emerged, which cause hazardous weather conditions. For the Typhoon
Bart(T9918), an intensive numerical study was conducted and the transformation processes are analyzed based on the simulated results.
The Bart landed at the northwest of Kyushu island and passed trough the Japan Sea and was weakened. When it came to the sea of Okhotsk, however, it was strengthened again. This life cycle of Bart was successfully simulated by the PSU/NCAR MM5. The piecewise potential vorticity inversion method was applied to the simulated result and the mechanism of the re-intensification was investigated. The potential vorticity was split to various components and each contribution to the typhoon intensity was evaluated. It is found that the negative anomaly located at the upper portion of the typhoon vortex, which was produced by the latent heat release at the middle level of the typhoon, act as weaken the typhoon itself. In the re-intensification stage, a strong interaction was found between typhoon positive potential vorticity in the lower levels and the upper level positive anomaly associated with planetary wave trough.
Accompanying to the passage of Bart, Several tornadoes are spawned. This event was also simulated by the finer resolution simulation. It is found that a series of meso-scale disturbances developed in the outer-rainband associated with Bart, one of these was strongly intensified when it passed over the shoreline. The detailed analysis suggests the topographic effect of Japan Alps on the intensification of the meso-scale disturbance.
3. Investigation of Damage in Miyako Island by Typhoon 0314
3.1 Introduction
Typhoon 0314(Maemi) approached and passed by Miyako Island, one of the southern west islands of Japan, during the early morning of September 11, 2003 as shown in figure 6. The maximum peak gust of 74.1m/s has been recorded at 3:00 September 11 as shown in figure 7, which is the 7th strong wind ever measured at weather stations in Japan.
3.2 Overview of damage
According to the report of damage amount by Typhoon Maemi published by the Miyakosicyo, the branch office of Okinawa prefecture, 97 people were injured, including 1 was dead, and 7 were badly injured. A total of 1,402 buildings were damaged, including 18 houses that were completely destroyed, 86 that were badly damaged, 1206 that were partially damaged, Fig.5. Time series of monthly mean of the GMS
retrieved surface temperature averaged across the Tibetan Plateau from 1996 to 2002.
as well as 19 public buildings and 73 others were damaged to varying degrees. The population of Miyako Island was 58,059 and the total number of buildings was 18,356, meaning that 0.17 and 7.6% of its residents and buildings suffered, respectively. The damage was mainly due to strong wind and the cost of damage amounted to ¥13,189,581 (about US$120,000). The completely destroyed and badly damaged houses were spread over the island as shown in figure 8.
The island is almost flat with the highest place of 115m above sea level. Open fields widely spread other than the towns shadowed in figure 8. The strong wind damaged to the main crop, sugarcane, and vehicles as shown in Photo 1 and 2. Many electric and telephone poles along roads were also broken and prevented from rescuing injured persons as shown in Photo 3. The area where the electric and telephone poles were damaged were spread all over the island along the road located in the open field as in figure 9. Some wind farms were located near the sea and all the wind turbines were damaged. Total of 7 turbines were out of work, three towers were fallen, three blades were broken and one nacelle cover was blown off as shown in photo 4.
3.3 Damage of houses
Here we describe the detail of damage of houses. Most of the completely destroyed houses were wooden ones as shown in photo 5. But they were old and very few compared to the rest of modern houses that were consist of reinforced concrete (RC). RC houses and buildings were fundamentally wind resistant but had some kind wind damage. Photo 6 shows the representative damage of RC buildings with blow off of
town damaged area
Fig.9. Damage area of electric and telephone poles in Miyako Island.
N
0 10km
wind farm
Fig.8. Distribution of completely destroyed and badly damaged houses in Miyako Island.
completely destroyed badly damaged RC N 0 10km maximum minimum mean
maximum peak gust
Fig.6. Records of wind speed at Miyako weather station.
path of Typhoon
Miyako Island
N
3:00, Sep. 11
Fig.7. Location of Miyako Island and the path of Typhoon 0413.
the roof. Also window brakes were typical without window shutters. The RC houses equipped window shutters as shown in figure 7 suffered almost no damage. In Miyako Island and also in the southern west islands RC houses and buildings are popular nowadays and have flat roof without roof tiles. Otherwise a few buildings such as public hall, airport or summerhouse have roofs or porch designed with roof tiles as shown in photo 8. They had blown off damage to the roof tiles.
3.4 Concluding remarks
The damage in Miyako Island caused by Typhoon 0314 was investigated and the outline of the damage such as buildings, sugarcane fields, wind turbines and electric poles was summarized. The details of damage to houses were also presented. Finally we derive some lessons from these results as follows;
1:Decrease the blown off objects with considering the design of roof and the attachment of the roof tiles are prevents secondary disasters.
2:Defense against the frying objects using window shutters are very effective.
3:Prevention of window breaks using tempered or wired glass are injury defensive.
4:Design criteria of wind load for electric or telephone poles and wind turbine should be reexamined again.
Photo 6. Blow off of a gymnasium roof. Photo 3. Broken electric and telephone poles prevents
the traffic from passing.
Photo 4. damaged wind turbines fallen tower of wind turbine
broken blades
Photo 5. Completely destroyed wooden house.
References
Ambaum, M. H. P., B. J. Hoskins, and D. B. Stephenson, (2001):Arctic Oscillation or North Atlantic Oscillation. J. Climate, Vol. 14, 3495--3507.
Arai, M., and H. Mukougawa, (2002): On the effectiveness of the eddy straining mechanism for the maintenance of blocking flows. J. Meteor. Soc. Japan, Vol. 80, 1089-1102.
Baldwin, M. P., and T. J. Dunkerton, 1999: Propagation of the Arctic Oscillation from the stratosphere to the troposphere. J. Geophys. Res., Vol. 104, 30937-30946. Baldwin, M. P., and T. J. Dunkerton, 2001: Stratospheric
harbingers of anomalous weather regimes. Science, Vol. 294, 581--584.
Blackmon, M. L., 1976: A climatological spectral study of the 500 mb geopotential height of the Northern Hemisphere. J. Atmos. Sci., Vol. 33, 1607-1623. Itoh, H., 2002: True versus apparent arctic oscillation.
Geophys. Res. Lett, Vol. 29, 10.1029/2001GL013978. Kimoto, M., H. Mukougawa, and S. Yoden, 1992:
Medium-range forecast skill variation and blocking transition: A case study. Mon. Wea. Rev., Vol. 120, 1616-1627.
Kodera, K., and M. Chiba, 1995: Tropospheric circulation changes associated with stratospheric sudden warmings: A case study. J. Geophys. Res., Vol. 100, 11055-11068.
Kusunoki, S., M. Sugi, A. Kitoh, C. Kobayashi, and K. Takano, 2001: Atmospheric seasonal predictability experiments by the JMA AGCM. J. Meteor. Soc. Japan, Vol. 79, 1183-1206.
Plumb, R. A., 1985: On the three-dimensional propagation of stationary waves. J. Atmos. Sci., Vol. 42, 217-229.
Yamazaki, K., and Y. Shinya, 1999: Analysis of the Arctic Oscillation simulated by AGCM. J. Meteor. Soc. Japan, Vol. 77, 1287-1298.
Photo 7. RC house with window shutters had few damage.
異常気象とそれに伴う災害の実態把握と予測に関する研究 河井宏允・岩嶋樹也・植田洋匡・ 石川裕彦・丸山敬・向川均 堀口光章・井口敬雄・荒木時彦 要旨 本報告は,異常気象を引き起こす原因の解明と,それによってもたらされる災害の実態について述べたも ので3部からなっている。第1部では,異常気象を引き起す原因の一つとして注目されている北極振動 (Arctic Oscillation;AO)が,顕著に大きくなった1998 年12月に生じた成層圏突然昇温(Stratospheric Sudden Warming; SSW)直後における大気運動の予測可能性について解析した。第2部では,異常気象をもたらす背 景としての生物気候学的な植生の時間変化を,人工衛星データを用いて植生強制因子で説明するともに,気 象災害の主要因である台風について詳細な数値解析を行った。第3部では,2003年9月10日から11日にかけ て宮古島を襲った台風14号による強風被害の実態について,現地調査結果および統計資料を用いて解析し, 過去の当地を襲った台風による被害結果と比較した。 キーワード:異常気象,北極振動,成層圏突然昇温,広域陸面過程,生物気候学,植生強制因子GMS-5, PSU/NCAR MM5,台風,竜巻,強風被害,風車
異常気象とそれに伴う災害の実態把握と予測に関する研究 河井宏允・岩嶋樹也・植田洋匡・ 石川裕彦・丸山敬・向川均 堀口光章・井口敬雄・荒木時彦 要旨 本報告は,異常気象とそれを引き起こす要因を,メソスケールから地球規模に至る様々なスケー ルの現象の解析によって明らかにするとともに,それによってもたらされる災害の実態について述 べたもので3部からなっている。 第1部では,気象庁一ヶ月予報結果を用いて,AOシグナルが顕著に大きくなった1998 年12月に 生じた成層圏突然昇温(Stratospheric Sudden Warming; SSW)直後における大気運動の予測可能性に ついて解析した。近年,異常気象を引き起す原因の一つとして,北極振動(Arctic Oscillation; AO) が注目されている。AO は,北極域の極渦の強さの変動を表しており,極渦が弱まる状態のときには, 対流圏内で南北流が強まり世界各地で異常気象が発生しやすくなると考えられる。また最近の統計 的研究により,AO シグナルは成層圏から対流圏へ3週間程度の時間スケールでゆっくり下方伝播す る性質を持つことが示唆されており,この下方伝播シグナルを利用することで,対流圏循環の中長 期予報を改善できると期待される。解析の結果,この時期におけるAOシグナルの変動は,気象庁一 ヶ月予報ではうまく予測できていないことが示された。それに対して,このSSW直後に北太平洋域で 発生したブロッキングの予測可能性は極めて高いことが示された。これは,ブロッキングが,長い 時間スケールを持つ惑星波がSSWに伴い極向きに伝播することで生じたことが原因と考えられる。従 って,SSW直後には,対流圏循環に対する成層圏の影響が強くなることが示唆される。 第2部では,異常気象をもたらす背景としての、広域陸面過程の変化を明らかにするため、人工 衛星データを用いて中国大陸の,生物気候学的な植生の時間変化を捉え,植生におけるこれらの変 化を,人間活動,気候,自然因子のような確認しうる植生強制因子で説明することを試みた。1982 年から2000年までのNDVI NOAA AVHRRデータを用い,離散フーリエ変換(DFT)を使用して人間活動 の影響を気候,自然の因子から識別した。南中国におけるNDVIの時間変化に対する調和解析により, 第一主成分は気温と同位相であり,第二および第三主成分は人間活動の情報と気候とが結合した植 生への影響を捉えていることを示した。 また、アジアモンスーンの変動に大きな影響を与えているチベット高原に関して、GMS-5のデータ を用いて、高原地表面温度の長期変化傾向を明らかにした。 広域水循環統合モデルの開発と西アジア域の水文・水循環とその変動の予測・解明に関する研究 を進めた。各種のモデルコンポーネントを統合するためのカップラーの作成、新しい陸面モデルの 作成を行った。この統合モデルをサウジアラビア地域に適用し、サウジアラビア南東部の海洋砂漠 を緑化した場合の降水増加に関して、予備的な結果を得た。 台風に関しては、1999年のT9918(Bart)を対象に、数値シミュレーション結果に基づく詳細な解析 を行い、その発達-衰弱-再発達-消滅過程に関わる力学を、中緯度傾圧大気との相互作用の観点 から解析した。また、この台風に伴って豊橋市周辺で発生した竜巻に関しても、詳細なシミュレー ションとその解析を行った。 第3部では,昨年の9月に沖縄県の宮古島を襲った14号台風による,構造物の被害について現 地調査を行った結果について述べた。宮古島は台風の通り道にあたり,過去何度も大きな台風に襲 われている。本台風時に宮古島地方気象台において観測された最大瞬間風速は74。1m/sで気象観測 史上7番目,最低気圧は912HPaで観測史上4番目であったが,過去に宮古島を襲った台風に比べて, 住居の被害は著しく少なかった。これは,過去の強風被害の経験から,宮古島の住居が木造から鉄 筋コンクリートに建て替えられたことが大きく寄与している。しかし,体育館や公民館など災害の 避難所として指定されている建物に大きな被害が生じたことは,今後に大きな課題を残している。 また,生活インフラを支える電柱の倒壊も著しく,電気の完全復旧には2週間,電話の完全復旧に は18日間を要した。また,近年,建設が奨励されている風力発電施設についても,設置されてい る8台の風車全てが大きな被害を受け,耐風安全基準の見直しも必要であることが明らかになった。