T
ra
ce
N
u
tr
ie
n
ts
R
es
ea
rc
h
Vol
.30
2013
Ja
p
an
T
ra
ce
N
u
tr
ie
n
ts
R
es
ea
rc
h
S
o
ci
et
y
ISSN 1346−2334Trace Nutrients Research
Vol. 30
微 量 栄 養 素 研 究
2 0 1 3
Japan Trace Nutrients Research Society
委員長 松
井
徹 (京都大学)
委 員 荒
川
泰
昭 (労働安全衛生総合研究所)
同
江
崎
信
芳 (京都大学)
同
河
村
幸
雄 (京都女子大学)
同
鈴
木
鐵
也 (クイーンズランド大学)
同
矢
野
秀
雄 (家畜改良センター)
同
吉
田
宗
弘 (関西大学)
同
渡
邊
敏
明 (兵庫県立大学)
編 集 委 員
(50音順)
第 31 回日本微量栄養素学会 学術集会開催のお知らせ
日本微量栄養素学会は,第 31 回学術集会を平成 26 年 6 月 7 日(土)に,関西大学 100 周年記念会館で開催 いたします。 つきましては,発表ご希望の方は下記の要領でお知らせいただきたくご案内申し上げます。 開 催 日 平成 26 年 6 月 7 日(土) 会 場 関西大学 100 周年記念会館 大阪府吹田市山手町 3335 会 頭 吉田宗弘(関西大学) 演題形式 口頭発表,ポスターセッション ポスター賞を設けております。優秀なポスターには懇親会で表彰を行います。 申込方法 講演申込,講演要旨は下記要項に従って作成し,電子メールでご応募ください。 万が一,電子メールがご使用できない場合は事務局までお問い合わせください。 なお,講演申込は,原則として会員に限らせていただきます。非会員の場合は理事または評議員の推薦が 必要です。 講演申込要項 メールタイトルは「第 31 回日本微量栄養素学会講演申込」としてください。 下記項目を明記してください。 演題名,演者名(漢字およびカタカナ),所属機関(大学名),住所,電話番号,FAX 番号,E-mail(平成 27 年 1 月まで連絡の取れるもの),ポスター賞エントリー有無(35 歳以下),演者生年月日。 共同研究者氏名,共同研究者所属機関(大学名),共同研究者住所。発表形式(「口頭」,「ポスター」)。 演者が非会員の場合は,紹介理事または紹介評議員氏名。 演題申込用紙がホームページにございます。ダウンロードしてご使用ください。 http : //jtnrs.com/ 講演要旨要項 Word 形式,あるいはテキストファイルで作成し,電子メールに添付してください。 要旨原稿は演題,研究者名(発表者は後にアスタリスク(*)をつける),所属機関名(略称),本文の順に 記述してください。 本文は 1,000 字以内で,「目的」,「方法」,「結果」,「考察」を明確に記述してください。 要旨原稿は講演要旨集に掲載されます。原稿は A4 サイズ半頁に縮小し,印刷されます。写真,図表等は 原稿内に貼り付けてください。(大きすぎる写真は入らない場合がありますので,ご了承ください)問い合わせ・申込先 日本微量栄養素学会事務局 [email protected](担当:松田,福田,春松) 申込締切日 平成 26 年 3 月 31 日(月) 交通費および宿泊について 交通費については演者の方 1 名のみ支給いたします。 宿泊費に関しては各自ご負担ください。ご了承くださいますようお願いいたします。 演題受付通知 お申込みいただいた応募演題には,演題受付通知を電子メールでお送りいたします。 1 週間以内に演題受付通知のない場合は事務局までお問い合わせください。 その他 演題の採否,発表形式はプログラム委員会にて決定後,通知いたします。 口頭発表,もしくはポスター発表いずれかの希望者が多数の場合,プログラム委員より発表形式の変更をお 願いする場合もございます。 いずれの発表形式でも,機関誌用論文の提出をお願いする予定です。
日本微量栄養素研究 第 30 集
目 次
第 31 回日本微量栄養素学会学術集会開催のお知らせ
原 著
Estimation of the nutritional balance of food dishes by color analysis of photographs
- using salad as a model dish ... 1 Yukari Muramoto, Momoko Yaeo, Motoko Matsui, Kimiko Ohtani
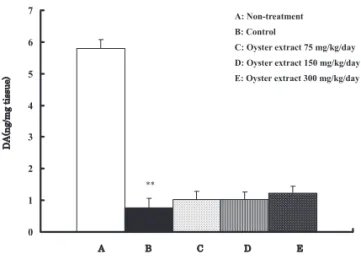
災害後の避難所における食事およびビタミン強化食品による体内ビタミン栄養状態への影響 ... 7 湯浅 正洋,橋本 知美,松本 希美,澤村 弘美, 松井 朝義,岸本 祐樹,石神 昭人,渡邊 敏明 サリチル酸誘導体による活性酸素生成 ... 13 村上 恵子,細川 好孝,吉野 昌孝 使用年数の異なる鉄鍋を用いた調理中の鉄溶出量と鉄鍋表面の金属元素の化学状態 ... 17 細見 亮太,下地 葵,野口伸之助,福永 健治,吉田 宗弘 NMDA レセプターアンタゴニスト投与がマグネシウム欠乏ラットの肝臓における酸化ストレスおよび 炎症反応に及ぼす影響 ... 21 山本 茜,友永 省三,舟場 正幸,松井 徹 日本食品標準成分表 2010 に新規収載された微量栄養素摂取量の検討―ヨウ素・セレン― ... 27 松本 希美,吉田 宗弘,澤村 弘美,渡邊 敏明 ランタン投与ラットにおける高血清カルシウム濃度と低腎臓銅濃度には低リン状態が寄与している ... 31 野口伸之助,湯川 法子,福永 健治,西山 利正,吉田 宗弘 エピガロカテキンガレート(EGCG)による摂食抑制に関する研究 ... 35 石黒真理子,滝澤 麻紀,藤野 佳穂,大貫 里沙, 後藤由里香,久保 静香,神山 伸,曽根 英行 かき肉エキスのアセトアミノフェンによる肝障害抑制作用の検討 ... 41 春松 槙,福田 卓,松井 博之,松田 芳和 日本と中国における味覚についての比較調査 ... 44 前川 隆嗣,香西 彩加,飯塚 敦子,松本 希美, 澤村 弘美,服部 優紀,渡邊 敏明 マウスを用いたカキ抽出物の学習・記憶能力およびパーキンソニズムに対する作用の評価 ... 48 鈴木孝太郎,野々村 徹,山崎 則之, 高橋 尚彰,松井 博之,松田 芳和
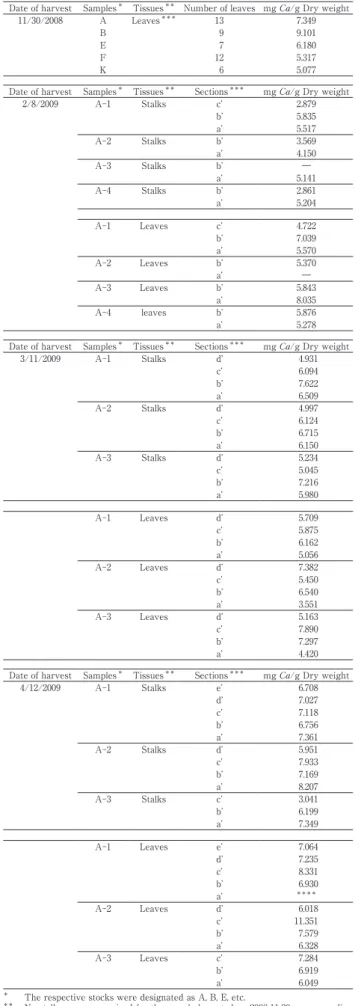
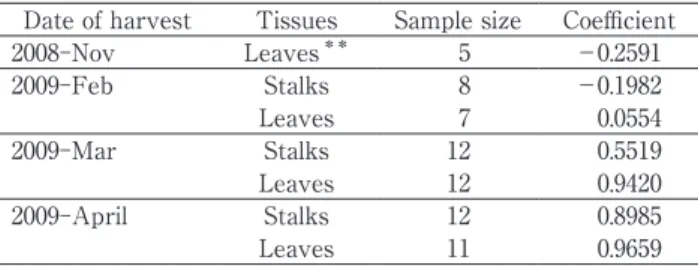
Accumulation of arsenic and calcium during the growth of Hijiki plants ... 52 Masayuki Katayama, Motohiro Kasama and Yohko Sugawa-Katayama
Mg 欠乏食―甘味料溶液継続摂取がマウス脳内セロトニン濃度に及ぼす影響 ... 58 隅田有公子,川村美笑子
Estimated daily intake of biotin in hospital meals in Japan through dietary surveillance ... 64 Toshiaki Watanabe, Atsushi Fukushima, Kimi Matsumoto,
Hiromi Sawamura and Hidetaka Mizohata
サプリメントによる微量元素過剰摂取の可能性について―サプリメントの使用実態・意識調査― ... 74 吉田 香,桐木 麻紀,久保田祐子,上甲 有利,北村 真理
黒大豆由来の黄大豆新品種 ‘ 京白丹波 ’(Glycine max (L.) Merr.)の特性について ... 79 野村 知未,古谷 規行,大谷貴美子,村元由佳利,松井 元子
Questionnaire study on the dietary environment for nutritional improvement of the elderly in
unit care type special nursing homes in the Kinki district ... 86 Terumi Aiba, Motoko Matsui, Keiko Tomita, Kimiko Ohtani
健常な若年日本人成人における尿中セレン,モリブデン,ヨウ素濃度の個人内,および個人間変動 ... 93 六釜安祐実,吉田 宗弘
ミニレビュー
ビタミン C の不足が胎児の発生や成長,老化や老年病に及ぼす影響 ... 97 石神 昭人 高齢者における亜鉛の栄養状態と身体機能 ... 101 菊永 茂司,小坂 和江 味覚障害と亜鉛 ... 110 池田 稔学会記事
事務局からのお知らせ ... 資1 日本微量栄養素学会歴代会頭 ... 資1 日本ビタミン学会第 66 回大会 ... 資2 日本微量栄養素学会 定款 ... 資3 「Trace Nutrients Research 微量栄養素研究」原稿投稿規程 ... 資6 日本微量栄養素学会役員名簿 ... 資7 日本微量栄養素学会会員名簿 ... 資7Introduction
At present, there are a number of dietary relat-ed issues in Japan. In particular, the increase in lifestyle-based diseases, including cancer and cardiovascular dis-ease, is an important social issue. A National Health and Nutrition Examination Survey conducted in 2011 reported that 30.3 % of men and 21.5 % of women over the age of 20 were obese, and 15.7 % of men and 7.6 % of women had pre-diabetes, about 1.3 times higher than reported in 2006.
In response to these issues, the Shokuiku Basic Act was passed by the Cabinet Office in 2005 and the Shokuiku Promotion Basic Plan was implemented in 2006 in order to promote Shokuiku, or food education, for all Japanese in order to promote healthy dietary habits. That is to say the cultivation of the ability to manage one’s healthy dietary life is expected. However, it may be difficult for individu-als who lack adequate knowledge about nutrition and food to make appropriate food choices. In addition, opportuni-ties to learn how to select and prepare food in order to
maintain and/or promote one’s health are decreasing due to changes in lifestyle and the increasing prevalence of ready-made meals and dining-out.
On the other hand, due to the progress of IT and the widespread use of digital cameras, mobile phones and smart phones, many studies have been reported describ-ing the estimation of the describ-ingested nutrients of a meal from a photograph1-5). Although the photographic diet record
method was easy for diners, the determination automati-cally the menu and the estimation of the amounts of ingre-dients from a one-dimensional photograph were difficult and inaccurate.
For proper dietary management, not only are the amounts of nutrients ingested important, but also the nu-tritional balance. Therefore, in the present study the pos-sibility of evaluating nutritional balance using color analy-sis of photographs of food dishes was demonstrated using salad as a model.
Original Article
Estimation of the nutritional balance of food dishes by color analysis of photographs
- using salad as a model dish
Yukari M
uramoto1), Momoko Y
aeo1), Motoko M
atsui2), Kimiko O
htani2)1)
Kyoto Prefectural University
*2)
Graduate School of Kyoto Prefectural University
**Summary
The possibility of the estimation of nutritional balance using color analysis of photographs of food dishes was in-vestigated in the case of salad. A total of 78 photographs of different salad varieties obtained from a recipe book and recipe website were analyzed. The ingredients of each salad were painted with 10 different colors and the area % of each color was calculated using the Feelimage Analyzer (VIVA Computer Ltd.). The weight average food com-position was determined for each color using recipes indicating trace nutrients and dietary fiber. The amounts of in-gredients estimated by color analyses were corrected using correlation equations obtained from the correlation anal-yses between the amount of nutrients estimated from the area % of the color and the amounts calculated per 100 g of salad from the recipe. The estimated nutrient content obtained using the weight average food composition for each color was then compared with those calculated per 100 g of salad based on the recipe. Of the 78 varieties of salad analyzed, in more than 50 % of cases the contents of potassium, dietary fiber, vitamin B1 and phosphorus
could be estimated to within ±30 % of those calculated from recipe. In order to validate this method, an additional three varieties of salad were analyzed. While the possibility of the evaluation of nutritional balance using color analy-sis of salad photographs was suggested by the results of this study, an increase in accuracy to estimate the amounts of ingredients and the weight average food composition for each color will be required.
*Address: 1-5, Hangi-cho, Shimogamo, Sakyo-ku, Kyoto, 606-8522, Japan
**Address: 1-5, Hangi-cho, Shimogamo, Sakyo-ku, Kyoto, 606-8522, Japan
― 1 ― Trace Nutrients Research 30 : 1−6(2013)
amounts of nutrients in the salads.
6. Validation of the use of color analysis of salad photographs to estimate nutritional balance
In order to verify the possible use of color analyses to estimate the nutritional balance from salad photographs, three additional varieties of salads (pumpkin salad, greens and chicken salad , Bagna Cauda salad) as shown in Fig. 1 were analyzed using the correlation formulae and weight average food composition. The estimated amounts of nu-trients were then compared with those obtained per 100 g of salads using the recipes and Excel eiyou-kun Ver.6.
7. Statistical analysis
Correlation analyses were performed by using Micro-soft Excel 2010.
Results and Discussion
1. Color analyses
The area % of each of 10 different colors in photographs of 78 varieties of salads is shown in Fig. 2, and the weight % of the ingredients represented by each color is shown in Table 1. The area % of white was the largest (30.2 %) followed by yellow-green (22.1 %) and green (21.5 %). The total area % of white, yellow-green, and green colors in 78 varieties of salad accounted for more 70 % of the area, due
Materials and Methods
1. Materials
A total of 78 photographs of different varieties of salads obtained from a recipe book6) and recipe website7), where
the amount of each ingredient was indicated, were ana-lyzed. In this study, salads which consisted primarily of seafood, such as conger eel, salmon roe, crab, shrimp, and scallop, and those containing a large amount of sauce were excluded from the analyses.
2. Color analysis of salad photographs
Using Adobe Photoshop 7.0, the ingredients in each sal-ad photograph were painted with one of 10 colors, i.e., black, white, green, yellow-green, yellow, orange, red, brown, pink or purple, and the serving dish and back-ground were painted blue in order to exclude it from color analysis. The area % of each color in the salad was calcu-lated by using the Feelimage Analyzer (VIVA Computer Ltd.).
3. Revision the estimated amounts of ingredients
Correlation analyses between the amounts estimated from the area % of color and those calculated from the recipe per 100 g of salad were performed for all 10 colors. Using the correlation equation obtained for each color, the estimated amounts were revised to approximate the amounts calculated for all 78 varieties of salads.
4. Nutritional analysis
Based on the amounts of ingredients per 100 g of each of the 78 varieties of salads shown in the recipes, a weight average food composition table was prepared for all 10 colors using Excel eiyou-kun Ver.6 indicating the amount of potassium, calcium, magnesium, phosphorus, iron, reti-nol equivalent, vitamin B1, vitamin B2, folic acid, vitamin C
and dietary fiber.
5. Revision of the estimated amount of nutrients
The estimated nutritional content was obtained using the revised % area and the weight average food composi-tion, and was calculated per 100 g of salad using the reci-pes for each of the 78 salads. A correlation analysis was performed for the amounts of 11 different nutrients; potas-sium, calcium, magnepotas-sium, phosphorus, iron, retinol equiv-alent, vitamin B1, vitamin B2, folic acid, vitamin C and
di-etary fiber, and the resulting correlation equations were used to revise the estimated nutrient contents to more closely reflect the calculated amounts. This method was then used to compare the estimated and calculated
a b c
Fig. 1 Three additional varieties of salad used for validation a. pumpkin salad
b. greens and chicken salad c. bagna cauda salad
White 30.2% Yellow-green 22.1% Green 21.5% Red 5.9% Yellow 5.7% Orange 5.0% Brown 4.3% Black 2.7% Pink 2.1% Purple 0.4%
White Yellow-green Green Red Yellow
Orange Brown Black Pink Purple
White 30.2 % Yellow-green 22.1 % Green 21.5 % Red 5.9 % Yellow 5.7 % Orange 5.0 % Brown 4.3 % Black 2.7 % Pink 2.1 % Purple 0.4 %
White Yellow-green Green Red Yellow
Orange Brown Black Pink Purple
recipes, the area % of each color was corrected using a correlation equation as shown in Table 2.
to the fact that the ingredients classified into these colors (potato, onion, lettuce, cucumber) were used more fre-quently regardless of the variety of salad. On the other hand, the small area % of brown and pink colors repre-sented animal foods such as sausage, ham and bacon. The purple color consisted of only seaweed (tosakanori) in the 78 varieties of salads examined.
2. Correlation of the estimated amounts of ingre-dients with those calculated from the recipes
The correlation coefficients obtained from the correla-tion analyses between the estimated amounts, shown as the area %, and the calculated amounts of ingredients per 100 g of salad using the recipes, is shown in Table 2 for each of the 10 color categories. A representative correla-tion analysis for the color green is shown in Fig. 3. The es-timated amounts of ingredients classified as the color brown showed the highest correlation coefficient (r = 0.94) among the 10 colors. In the case of the other 8 colors, with the exception of purple which consisted of only one ingre-dient, the correlation coefficients were greater than 0.70. However, the estimated ingredients classified into the white and red colors were found to be less than when cal-culated from recipe.
In order to more closely approximate the estimated amounts shown as area % to the amounts calculated from
Table 1 Weight % of the ingredients in each color category
Color Weight % of the ingredient in each color
White potato (17.5 %), onion (13.4 %), japanese radish (8.7 %), tofu (6.4 %), cauliflower (6.0 %), bean sprout (5.9 %), tuna
(4.6 %), apple (3.2 %), celery (3.1 %), soybean (2.2 %), cuttlefish (2.0 %), yam (2.0 %), macaroni (2.0 %), turnip (1.9 %), egg white (1.8 %), lotus root (1.6 %), zucchini (1.5 %), sweet potato (1.4 %), eggplant (1.3 %), udo (1.2 %), radish (1.2 %), agar (1.1 %), shiitake mushroom (1.1 %), minced chicken (1.1 %), fried tofu (1.1 %), enoki mushroom (1.0 %), hiratake mushroom (0.7 %), boiled scallop (0.5 %), boiled crab (0.5 %), cheese spread (0.4 %), chicory (0.4 %), asparagus (0.4 %), mushroom (shimeji) (0.4 %), cod roe (mentaiko) (0.4 %), kidney beans (0.3 %), peanut (0.3 %), steamed fish paste (0.2 %), white radish sprouts (0.2 %), pickled cucumber (0.1 %), process cheese (0.1 %), sesame (0.1 %), roasted sesame (0.1 %)
Yellow-green lettuce (30.4 %), cucumber (24.5 %), cabbage (21.6 %), green soybean (6.7 %), lettuce (saladana) (6.2 %), celery (3.4 %),
broccoli (2.1 %), red leaf lettuce (1.5 %), endive (1.3 %), asparagus (1.2 %), string been (sayaingen) (0.7 %), bitter melon (0.3 %)
Green string been (sayaingen) (24.9 %), spinach (14.7 %), corn marigold (8.6 %), string been (sayaendou) (6.8 %), cucumber
(6.5 %), lettuce (saladana) (5.5 %), green pepper (4.4 %), broccoli (3.9 %), seaweed (kukiwakame) (3.7 %), bitter melon (3.6 %), watercress (2.4 %), rape blossoms (2.4 %), potherb mustard (2.4 %), dried wakame (1.9 %), asparagus (1.6 %), parsley (1.5 %), endive (1.4 %), white radish sprouts (0.9 %), zucchini (0.8 %), raw wakame (0.7 %), wakegi (0.6 %), pumpkin (0.6 %)
Red tomato (64.4 %), red pepper (16.0 %), mini-tomato (14.4 %), apple (1.6 %), bacon (1.2 %), sweet potato (1.0 %), radish
(1.0 %), crab (0.3 %)
Yellow grapefruit (24.3 %), sweet potato (19.5 %), sweet corn (18.4 %), yellow pepper (14.4 %), egg yellow (7.1 %), bean
sprout (6.8 %), process cheese (4.1 %), young corn (2.9 %), pineapple (2.6 %)
Orange carrot (63.1 %), pumpkin (32.0 %), tomato (4.9 %)
Brown sausage (17.8 %), common mushroom (14.9 %), mushroom (shimeji) (11.0 %), shiitake mushroom (9.1 %), tuna (8.0 %),
enoki mushroom (6.8 %), mushroom (maitake) (6.8 %), dried fry (shirasu) (5.9 %), kidney bean (5.0 %), raisin (4.2 %), bacon (3.9 %), red leaf lettuce (2.1 %), black olive (2.0 %), umeboshi (1.1 %), pleurotus mushroom (1.1 %), dried bonito (0.5 %)
Black dried wakame (28.9 %), salted kombu (18.9 %), hijiki (18.6 %), eggplant (12.1 %), black olive (11.6 %), raw wakame
(9.9 %)
Pink ham (53.4 %), bacon (14.4 %), sausage (9.1 %), salami (8.8 %), red pea (8.7 %), japanese ginger (5.5 %)
Purple seaweed (tosakanori) (100.0 %)
Table 2 Correlation analyses between the estimated and calculated amounts of ingredients in each color category
Correlation
coefficient Correlation equation Revision equation
Brown 0.94 y = 0.8939x × 0.8939 Red 0.89 y = 1.2649x × 1.2649 Yellow 0.88 y = 0.8147x × 0.8147 White 0.87 y = 1.2636x × 1.2636 Yellow-green 0.82 y = 0.8073x × 0.8073 Pink 0.82 y = 0.8172x × 0.8172 Green 0.73 y = 0.7059x × 0.7059 Black 0.73 y = 0.2738x × 0.2738 Orange 0.72 y = 0.7101x × 0.7101 Purple 1.00 y = 1.0956x × 1.0956 y = 0.7059x R² = 0.5312 0 10 20 30 40 50 60 70 80 90 0 20 40 60 80 100 cal cul ated amoun t estimated amount
Fig. 3 Representative correlation analysis in the case of green color category
the calculated values in the 78 varieties of salads. In the case of potassium, dietary fi ber, vitamin B1 and
phospho-rus, they could be estimated to within ±30 % of the
calcu-3. Nutritional analyses
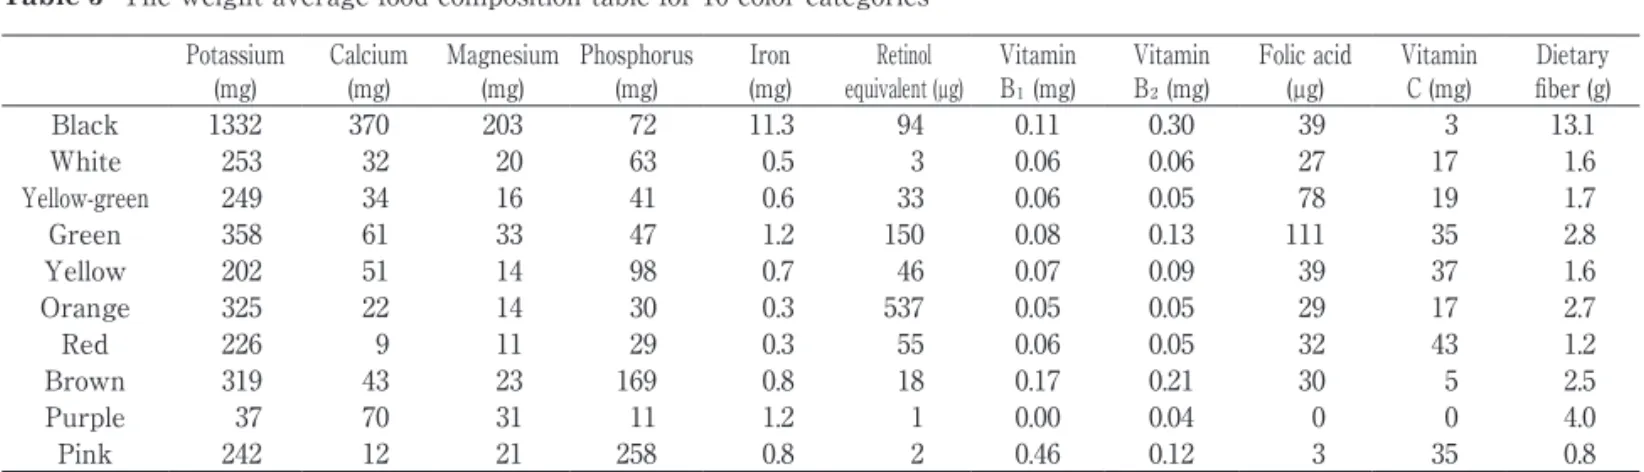
In order to carry out the nutrition analyses, the weight average food composition for each of the 10 colors was ob-tained using the weight % of ingredients shown in the recipes as shown in Table 3.
According to the weight average food composition of each color category, the ingredients classified into the black color category were found to contain more potassi-um, calcipotassi-um, magnesipotassi-um, iron and dietary fiber, while those classified into the green color category contained more folic acid, those classifi ed into the orange color cate-gory had higher retinol equivalent, and those classified into the pink color category contained more phosphorus and vitamin B1.
4. Correlation analyses between the estimated and calculated nutrient contents
Correlation analyses between the estimated nutrient contents obtained by using the revised area % and the weight average food composition table, and the calculated nutrient contents per 100 g of salads were performed. The correlation coefficients for the 11 different nutrients are shown in Table 4, and a representative correlation analy-sis in the case of vitamin B2 is shown in Fig. 4. The
corre-lation coeffi cient of iron was the highest (r = 0.71) among the nutrients analyzed, followed by vitamin B2 (r = 0.67),
dietary fiber (r = 0.63) and retinol equivalent (r = 0.61). However, that of folic acid was the lowest (r = 0.28). Green and yellow-green vegetables are generally thought to be the main sources of folic acid. Although green and yellow-green vegetables are often the main ingredients in salad, their nutrient estimation was diffi cult, since they were in some cases underestimated by being covered with other colorful vegetables used as toppings, but also overestimat-ed due to the large surface area when servoverestimat-ed in shallow plate in spite of their light weight per volume.
Fig. 5 shows the percentage of 11 different nutrients which were estimated to within ±30 % and/or ±50 % of
Table 3 The weight average food composition table for 10 color categories Potassium
(mg) Calcium(mg) Magnesium(mg) Phosphorus(mg) Iron(mg) equivalent (µg)Retinol VitaminB1 (mg)
Vitamin
B2 (mg)
Folic acid
(µg) Vitamin C (mg) Dietary fi ber (g)
Black 1332 370 203 72 11.3 94 0.11 0.30 39 3 13.1 White 253 32 20 63 0.5 3 0.06 0.06 27 17 1.6 Yellow-green 249 34 16 41 0.6 33 0.06 0.05 78 19 1.7 Green 358 61 33 47 1.2 150 0.08 0.13 111 35 2.8 Yellow 202 51 14 98 0.7 46 0.07 0.09 39 37 1.6 Orange 325 22 14 30 0.3 537 0.05 0.05 29 17 2.7 Red 226 9 11 29 0.3 55 0.06 0.05 32 43 1.2 Brown 319 43 23 169 0.8 18 0.17 0.21 30 5 2.5 Purple 37 70 31 11 1.2 1 0.00 0.04 0 0 4.0 Pink 242 12 21 258 0.8 2 0.46 0.12 3 35 0.8 y = 1.0344x R² = 0.3678 0.00 0.05 0.10 0.15 0.20 0.25 0.30 0.35 0.00 0.05 0.10 0.15 0.20 cal cutated nu tr ient estimated nutrient
Fig. 4 Representative correlation analysis in the case of
vita-min B2
Table 4 Correlation analyses between the estimated and calculated nutrients
Correlation
coeffi cient Correlationequation Revisionequation
Iron 0.71 y = 1.1109x × 1.1109 Vitamin B2 0.67 y = 1.0344x × 1.0344 Dietary fi ber 0.63 y = 1.0163x × 1.0163 Retinol equivalent 0.61 y = 0.8550x × 0.8550 Magnesium 0.51 y = 1.0206x × 1.0206 Calcium 0.47 y = 1.0246x × 1.0246 Vitamin B1 0.47 y = 0.9801x × 0.9801 Vitamin C 0.39 y = 1.0177x × 1.0177 Phosphorus 0.39 y = 0.9743x × 0.9743 Potassium 0.37 y = 1.0019x × 1.0019 Folic acid 0.28 y = 0.9348x × 0.9348 0 % 20 % 40 % 60 % 80 % 100 % Potassium Dietary fiber Vitamin Phosphorus Magnesium Vitamin Folic acid Retinol equivalent Calcium Iron Vitamin C
≦±30 % error ≦±50 % error ±50 % error<
Dietary fiber VitaminB1 Magnesium VitaminB2 0% 20% 40% 60% 80% 100% Potassium Dietary fiber Vitamin Phosphorus Magnesium Vitamin Folic acid Retinol equivalent Calcium Iron Vitamin C
≦±30 % error ≦±50 % error ±50 % error<
B1 B2
Fig. 5 Percentage of salad estimated to within ±30 % or ±50 % of calculated nutrients
coeffi cients in this study were relatively high may be due to the fact that this study restricted the analyses to only salad. That is to say, there are diffi culties in judging the menu and estimating the amounts of ingredients from one-dimensional photographs of various dishes. Moreover, the relative nutritional balance instead of the amounts of nutrients was analyzed in this study.
In order to manage a healthy dietary life, it is necessary to estimate the nutritional balance of one’s meals. Howev-lated value in more than 50 % of the 78 salads. These
re-sults would suggest that color analysis may be a possible method to estimate the amount of nutrients in salad.
5. The verifi cation of the estimation of nutritional balance using color analysis
In order to further validate the use of color analysis to estimate nutritional balance, an additional three varieties of salad (Fig. 1) were analyzed using the correlation for-mula and the weight average food composition obtained in this study. The estimated nutritional balances per 100 g for the three varieties of salads were compared to those calculated from their recipes, and are shown in Fig. 6-8. In the case of pumpkin salad, 8 of the 11 nutrients were estimated to within ±30 % of the calculated value. In the case of greens and chicken salad, calcium, magnesium and vitamin B1 were estimated to within ±30 % of the
calcu-lated value. In the case of bagna cauda salad, many of the nutrients were overestimated, primarily because it was served in a large and shallow plate.
Salad is prepared by a simple procedure and is rich in colors. Thus, salad photographs were analyzed in order to investigate the possibility of estimation of the nutritional balance by applying color analysis. The results of the present study using salad photographs suggested that col-or analysis may potentially be a useful technique to esti-mate the nutritional balance of foods; however a number of issues would still need to be addressed. In order to clas-sify the ingredients into the 10 color categories as used in this study, the ingredients in photographs must be pre-painted using computer software (Adobe Photoshop). This step would need to be automatically performed when the essential conditions to classify the color of ingredients be-come clear through further investigation. And more salad photographs will need to be analyzed in order to increase the accuracy in estmating the amounts of ingredients and the weight average food composition. In particular, the weight average food composition of the color purple in this study consisted of only seaweed (tosakanori), and sal-ads which consisted primarily of meat or seafood were ex-cluded in this study. In addition, the energy intake was not analyzed. Finally, the estimation of the amounts of sal-ad dressing, some of which are not photographed, is im-possible. In order to solve this problem, the average amounts of energy obtained from dressing must be added evenly.
The correlation coeffi cient of the famous dietary man-agement system called “FoodLog” invented by Miyazaki etc. 1) was reported to be 0.32, which could carry out the
analysis of various dishes. The reason why the correlation
Fig. 8 The comparative amount of nutrient estimated for those calculated per 100 g of the bagna cauda salad
Fig. 7 The comparative amounts of nutrients estimated for those calculated per 100 g of the greens and chicken salad
Fig. 6 The comparative amounts of nutrients estimated for those calculated per 100 g of the pumpkin salad
0 100 200 300Potassium Calcium Magnesium Phosphorus Iron Retinol equivalent Vitamin Vitamin Folic acid Vitamin C Dietary fiber
calculated amount of nutrient estimated amount of nutrient
B1 B2 0 50 100 150Potassium Calcium Magnesium Phosphorus Iron Retinol equivalent Vitamin Vitamin Folic acid Vitamin C Dietary fiber
calculated amount of nutrient estimated amount of nutrient
B1 B2 0 50 100 150Potassium Calcium Magnesium Phosphorus Iron Retinol equivalent Vitamin Vitamin Folic acid Vitamin C Dietary fiber
calculated amount of nutrient estimated amount of nutrient
B1 B2 0 100 200 300Potassium Calcium Magnesium Phosphorus Iron Retinol equivalent Vitamin Vitamin Folic acid Vitamin C Dietary fiber
calculated amount of nutrient estimated amount of nutrient
Vitamin Vitamin B1 Vitamin B2 0 50 100 150Potassium Calcium Magnesium Phosphorus Iron Retinol equivalent Vitamin Vitamin Folic acid Vitamin C Dietary fiber
calculated amount of nutrient estimated amount of nutrient
Vitamin Vitamin B1 Vitamin B2 0 50 100 150Potassium Calcium Magnesium Phosphorus Iron Retinol equivalent Vitamin Vitamin Folic acid Vitamin C Dietary fiber
calculated amount of nutrient estimated amount of nutrient
Vitamin
Vitamin B1
Vitamin B2
3) Matsuzaki S, Ando F, Koike K, Gomibuchi H, Shi-bata A, Okano Y, Takei H, KawaShi-bata T (2006) The Validity of the Dietary Survey Method (Pho-tographic Diet Record; PDR) Using Digital Photo-graphs. Kagawa Nutrition University 37: 5-12. 4) Suzuki A, Miyauchi M, Hattori I, Egami I, Wakai K,
Tamakoshi A, Ando M, Nakayama T, Ohno Y, Kawamura T (2002) Inter-Observer Agreement and Validity of Photographic Dietary Assessment. Japanese Society of Public Health 49 (8): 749-758. 5) Joutou T, Hoashi H, Yanai K (2010) 50-Class
Food-Image Recognition Employing Multiple Kernel Learning. The Institute of Electronics, Infoemation and Communication Engineers J93-D (8): 1397-1406. 6) Onoue T (1997) New Welldish Vol.3 Menu of
Veg-etables/Salad
7) Bob & Angie, http://www.bob-an.com/ er, there have been no successful reports of doing so
us-ing computer software without human support. Additional work will be required to further validate the effectiveness of this technique, and investigate its use for estimating the nutritional balance of not only salads but also for the anal-ysis of main dishes and side dishes.
References
1) Miyazaki T, Gamhewage C S, Aizawa K (2011) Im-age-based Calorie Content Estimation for Dietary Assessment. IEEE International Symposium on Multimedia: 363-368.
2) Hasegawa S, Yoshida T, Egami I, Yokota M, Mu-rakami Y (2006) Dietetic Education Using a Nutri-tion Management System with Camera Phones. Computer & Education 21: 107-113.
生労働省は 2011 年 4 月に,震災後 3 ヵ月間の栄養摂取基 準として,「避難所における食事提供の計画・評価のため に当面の目標とする栄養の参照量(以下,栄養参照量)」 を提示した5)。1 日当たりの栄養参照量は,エネルギー 2000 kcal,たんぱく質 55 g,ビタミン B11.1 mg,ビタミ ン B21.2 mg,ビタミン C100 mg とされており,これらの 栄養素は生命維持に必要不可欠であると同時に,災害後に 不足・欠乏しやすいことが懸念されている。 以上のように,災害後の避難所ではビタミン摂取が不足 災害後の避難所では,被災者への食事の確保が非常に重 要である。災害後の避難所における食事は,主に救援物資 や備蓄食品で賄われる。しかし,1995 年に発生した阪神・ 淡路大震災1, 2)や,2011 年に発生した東日本大震災3, 4)な どの災害後の避難所においては,栄養素摂取が十分でな かったことが報告されている。これらの報告によると,ご はんやパンなどによるエネルギーの摂取は十分であるのに 対して,ビタミンやミネラルなどの微量栄養素の摂取が不 十分であると指摘されている。このような状況を受け,厚 *所在地:兵庫県姫路市新在家本町1-1-12(〒670-0092) **所在地:東京都板橋区栄町35-2(〒173-0015)
原 著
災害後の避難所における食事およびビタミン強化食品による
体内ビタミン栄養状態への影響
湯 浅 正 洋
1),橋 本 知 美
1),松 本 希 美
1),澤 村 弘 美
1),
松 井 朝 義
1),岸 本 祐 樹
2),石 神 昭 人
2),渡 邊 敏 明
1) (1)兵庫県立大学環境人間学研究科 食環境解析学教室*,2)東京都健康長寿医療センター研究所 分子老化制御**)Effects of Diets and Vitamin-Enriched Food on the Nutritional State of Victims in
Disaster Shelters
Masahiro Y
uasa1), Tomomi H
ashimoto1), Kimi M
atsumoto1), Hiromi S
awamura1),
Tomoyoshi M
atsui1), Yuki K
ishimoto2), Akihito I
shigami2)and Toshiaki W
atanabe1)1)
Department of Dietary Environment Analysis, School of Human Science and Environment,
University of Hyogo, Hyogo, Japan
2)
Molecular Regulation of Aging, Tokyo Metropolitan Institute of Gerontology, Tokyo, Japan
Summary
After disaster, relief foods and food storage meals are served. However, in the temporary shelters, it is known that the nutrition intake from these foods is not sufficient for victims. Therefore, a dietary goal for energy, protein, vitamin B1, vitamin B2 and vitamin C for dietary reference intake after disasters was presented by the Ministry of
Health, Labour and Welfare in Japan. However, it was reported that the vitamin intake was not sufficient in the shelters, because the serving meals were mostly staple food (rice or breads). At that time, we developed vitamin-en-riched bread for vitamin intake in the shelters. In this study, we examined the effects on vitamin status by taking meals to temporary shelters. Also, the usefulness of vitamin-enriched bread for improvement of vitamin nutrition was determined. Subjects were 10 women, aged 20 years old. The total experimental period lasted 10 days; stage 1 was the first 5 days, and stage 2 was the remaining of 5 days. Experimental diets, which were the same as the menus in the shelters, were prepared. Also, the main of daily breakfast course in stage 2 was substituted for vita-min-enriched bread. On the 1st, 5th and 10th days, blood and urine were collected. The vitamin B1, vitamin B2 and
vitamin C concentrations were determined by HPLC. On the 5th day, the level of vitamin B1 and vitamin C in the
blood and urine decreased compared to the 1st day. On the 10th day, the level of vitamin B2 and vitamin C in the
blood and vitamin B1, vitamin B2 and vitamin C in the urine increased compared to the 5th day. From these
find-ings, it is suggested that the diet vitamin distributions were not sufficient for maintaining a balanced nutrition and health condition of the victims, and vitamin-enriched bread is effective for improvement of vitamin nutrition intake.
― 7 ― Trace Nutrients Research 30 : 7−12(2013)
目とし,最初の 5 日間をステージ 1,後の 5 日間をステー ジ 2 とした。ステージ 1 では,実験食 1 を,ステージ 2 で は実験食 2 を摂取させた(Table 2)。実験期間中の生活活 動については,特に制限を行わなかった。 0,5,10 日目の 8:00 − 9:00 に採血,採尿および体 重測定を実施した。また,5,10 日目においては,自覚症 状に関する質問表を用いて,不定愁訴などの自覚症状の有 無を調査した。質問内容は先行研究6)を参考に作成し (Table 3),調査用紙は自己記入式とした。 3)実験食 本研究では,東日本大震災後の避難所において提供され た食事3)に基づいて実験食を作成し,対象者に摂取させ た(Table 2)。ステージ 1 では,避難所の食事に基づいた 「実験食 1」を摂取させ,ステージ 2 では,実験食 1 の朝 食の菓子パンをビタミン強化パンに置き換えた「実験食 2」を摂取させた。飲料は麦茶および水のみで,自由摂取 とした。 4)ビタミン強化パンの作製方法 ビタミン強化パンは,パネトーネ酵母を用いたロングラ しており,特にビタミン B1,ビタミン B2,ビタミン C が 欠乏する可能性が高い事が問題となっている。しかし,避 難所で生活する被災者のビタミン栄養状態についての詳細 は不明である。そこで,本研究では,避難所で提供されて いる食事を摂取した時のビタミン栄養状態について明らか にすることとした。さらに,パンは避難所で提供される頻 度が高く,かつ調理を要さないことから,ビタミンを添加 したロングライフパン(以下,ビタミン強化パン)を開発 し,その有用性についても検討した。
実験方法
1)対象者 対象者は,健康な 10 − 20 代の女性 10 名とした。全て の対象者において喫煙および飲酒の習慣はなく,規則正し い食生活をしていた。対象者についての基礎情報は, Table 1 に示す通りである。 なお,本研究は兵庫県立大学倫理委員会(受付番号 034, 平成 24 年 10 月 9 日)の承認を受け,インフォームド・コ ンセントに基づいた上で実施した。 2)実験プロトコール 実験プロトコールを Fig. 1 に示す。実験開始日を 0 日Table 1 Characteristics of subjects and change of body weight
Day 0 5 10
Age year 22 ± 2.9
Body height cm 157.7 ± 5.4
Body weight kg 53.7 ± 7.4 52.7 ± 7.4 52.0 ± 7.0
Body mass index kg/m2 21.6 ± 2.9 21.2 ± 2.9 20.9 ± 2.8
mean ± SD n = 10 (Scheffe’s F test)
Table 2 Experimental diets
Diet 1 Diet 2 Day 0 B1 Jam bun Day 5 B Vitamin-enriched bread
L2 Rice ball, miso soup L Rice ball, miso soup
D3 Rice ball, miso soup, loin ham D Rice ball, miso soup, loin ham
S4 Rice cracker S Rice cracker
Day 1
B Roll of bread with peanut butter
Day 6
B Vitamin-enriched bread
L Rice ball, miso soup L Rice ball, miso soup
D Rice ball, miso soup, takuan-zuke5 D Rice ball, miso soup, takuan-zuke
S Rice cracker S Rice cracker
Day 2 B Melon bread6 Day 7 B Vitamin-enriched bread
L Rice ball, miso soup L Rice ball, miso soup
D Rice ball, boiled egg D Rice ball, boiled egg
S Rice cracker S Rice cracker
Day 3 B Chocolate bun Day 8 B Vitamin-enriched bread
L Rice ball, furikake7, miso soup L Rice ball, furikake, miso soup
D Rice ball, Takuan-zuke, kabayaki8 of pacific saury D Rice ball, Takuan-zuke, kabayaki of pacific saury
S Rice cracker S Rice cracker
Day 4 B Melon bread Day 9 B Vitamin-enriched bread
L Rice ball, miso soup L Rice ball, miso soup
D Rice ball, miso soup, ume-zuke9 D Rice ball, miso soup, ume-zuke
S Rice cracker S Rice cracker
1B; Breakfast, 2L; Lunch, 3D; Dinner, 4S; Snack, 5Pickled with rice bran and salt, 6Japanese sweet bun, 7Dried bonito, egg, seaweed,
vegetables flakes, 8Baked and seasoned fillet, 9Mume (Japanese apricots) of salted pickles.
19 Fig. 1 Experimental protocol
Stage 1 Stage 2
Blood and urine collection Measurement of body weight
Day 0 Day 5 Day 10
Blood and urine collection Measurement of body weight Questionnaire of subjective symptom
7)統計処理 得られたデータの集計・解析は,エクセル統計 Statcel 3(有限会社オーエムエス出版,埼玉)を用いた。すべて の値は,平均値±標準偏差(mean ± SD)で示し,p < 0.05 の場合に統計学的に有意であると判定した。
結 果
1)体内のビタミン栄養状態の変化 Fig. 2 A は血中および尿中のビタミン B1の変化を示し たものである。血中ビタミン B1濃度は,有意差はみられ なかったが,経時的に減少傾向が見られた。尿中ビタミン B1濃度は,5 日目に約 50%まで低下したが,10 日目で約 1.7 倍に上昇した(p < 0.05;5 日目 vs 10 日目)。 Fig. 2 B に血清および尿中のビタミン B2の変化を示す。 血清ビタミン B2濃度に有意差はみられなかったが,経時 的に増加傾向がみられた。尿中ビタミン B2濃度は,10 日 目で 0,5 日目の約 7 倍に上昇した(p < 0.01;0・5 日目 vs 10 日目)。 Fig. 2 C に血中および尿中のビタミン C の変化を示す。 血中ビタミン C 濃度は,0 日目と比べ,5 日目で約 78%ま で低下し,10 日目で 0 日目と同等の値を示した(p < 0.05;5 日目 vs 10 日目)。尿中ビタミン C 濃度は,有意 差はみられなかったものの,血中濃度と同様の変化が見ら れた。 イフパンとし,焼成前の材料にビタミンを混合して作製し た。なお,ビタミン添加量は,調理損失7)を考慮し,栄養 参照量を目安に,ビタミン B1(0.65 mg/100 g),ビタミン B2(0.71 mg/100 g) お よ び ビ タ ミ ン C(59.5 mg/100 g) となるように添加した。 5)栄養素摂取量の算出方法 主食のおにぎりは,1 個当たりのめしの重量を 150 g, 塩分はめし重量の 0.8%とした。全ての食材の重量を測定 し,日本食品標準成分表 2010 を用いて栄養素摂取量を算 出した。ビタミンの摂取量は,ビタミン強化パンの焼成後 に残存していると推定されるビタミン量を足した量を示し ている。なお,比較に用いた栄養参照量では,炭水化物お よび脂質の基準が設定されていないため,栄養参照量のエ ネルギー 2000 kcal/ 日に対して,炭水化物は 60%,脂質 は 25%のエネルギー比率で算出した。 また,東日本大震災後の避難所で提供された献立3)を もとに,食品重量の推定および栄養計算を行い,実際の避 難所における栄養素の推定摂取量を算出した。参考にした 食事は,震災後 12 − 16 日目の 5 日間で,宮城県の K 避 難所で提供された食事である3)。 6)血液・尿中のビタミン測定方法 血液・尿中のビタミン B1は文献 8),ビタミン B2は文 献 9),ビタミン C は文献 10)の方法に準じて,HPLC 法 にて測定した。Table 3 Questionnaire and prevalence rate of subjective symptom
【Subjective symptoms】 0 1 Prevalence rate(%)
Day 5 Day 10
Q, Anorexia, depression of spirit No Yes 50 60
Q, Tiredness, I want to lie, day-night reversal, hard to get
out of bed morning No Yes 60 70
Q, Low back pain, joint pain,
cramp of foot, edema of foot No Yes 50 40
Q, Dry skin and lip condition No Yes 80 70
Q, Oral mucositis, angular
stomatitis No Yes 10 10
Q, Glossopathy, glossitis No Yes 20 20
Q, Gingival bleeding, tooth
mobility No Yes 0 0
Q, Taste impairment No Yes 10 10
Q, Nail disorder No Yes 30 30
Q, Infection; pharyngodynia,
pyrexia No Yes 0 0
Q, Concentrated urine No Yes 10 40
Q, Constipation No Yes 50 70
Q, Diarrhea No Yes 30 20
n = 10 (Fisher’s exact probability test)
20 Fig. 2 Vitamin concentration of blood and urine
A, Vitamin B1; B, Vitamin B2; C, Vitamin C
mean±SD n=10 a-bp<0.05 (Scheffe's F test) b a ab a a b b a ab A B C
Fig. 2 Vitamin concentration of blood and urine
A, Vitamin B1; B, Vitamin B2; C, Vitamin C
mean ± SD n = 10
a-bp < 0.05
(Scheffe’s F test) ― 9 ―
た時のビタミン栄養状態について検討したところ,血中ビ タミン B1,ビタミン B2,ビタミン C が低下した6)。これ らのことから,避難所で提供される食事ではビタミン摂取 量が不十分であり,避難所生活が長期にわたる場合,ビタ ミン欠乏症が起こる可能性が示唆される。本研究では,災 害後の避難所で提供された食事に基づいた実験食を摂取し た時のビタミン栄養状態への影響をより詳細に明らかにす ることとした。さらに,ビタミン摂取方法の 1 つとして, ビタミン強化パンを開発し,その有用性についても検討し た。 まず,実験食の摂取によって,0 日目と比べて 5 日目に おいて血中・尿中ビタミン B1およびビタミン C の低下が みられた。このことから,災害後の食事によってビタミン 栄養状態が悪化している事が再確認された。 次に,5 日目と比べて 10 日目において,血中ビタミン B2,ビタミン C および尿中ビタミン B1,ビタミン B2,ビ タミン C が上昇した。このことから,本研究で用いたビ タミン強化パンは,ビタミン栄養状態の改善に有効である 事が示唆された。東日本大震災では,被災地である宮城県 および岩手県に対し,ビタミン強化米の配布が行われた11)。 ビタミン強化米を使用した場合のビタミン摂取量は,米 1 合当たりで,ビタミン B1が 0.8 − 1.0 mg,ビタミン B2が 0.1 mg,ビタミン C が 0 mg である。ビタミン強化米では, ビタミン B1は十分に摂取できるが,ビタミン B2および ビタミン C は十分に摂取できないことが懸念される。本 研究で開発したビタミン強化パンは,ビタミン B1のみで なくビタミン B2およびビタミン C も摂取できるという点 で,優れていると言える。今回は,避難所で必ず摂取され る主食に着目してビタミン強化食品の開発を行ったが,今 後は避難所におけるビタミン摂取を効果的に行えるような ビタミン強化食品の更なる開発が望まれる。 今回算出した避難所の推定栄養素摂取量から,震災後約 2 週間の避難所における食事の栄養素量が非常に低かった 事が確認できた。宮城県保健福祉部健康推進課の報告4) によると,2011 年に発生した東日本大震災後の避難所に 2)体重の変化 体重の変化を,Table 1 に示した。有意差は見られな かったが,0 日目と比較して,5 日目で平均 1.0 kg,10 日 目で平均 1.7 kg の減少が見られた。 3)栄養素摂取量の変化 実験期間中の栄養素摂取量と栄養参照量との比較を Table 4 に示す。ステージ 1 では,栄養参照量と比べてエ ネルギー,炭水化物,たんぱく質,脂質,ビタミン B1, ビタミン B2,ビタミン C の摂取量が有意に低値を示した。 ステージ 2 では栄養参照量と比べてエネルギー,炭水化 物,たんぱく質,脂質は有意に低値を示したが,ビタミン B1およびビタミン B2は有意に高値を示した。また,ビタ ミン C には有意差が見られなかった。 避難所の推定摂取量は,栄養参照量と比べてエネルギー, 炭水化物,たんぱく質,脂質,ビタミン B1,ビタミン B2, ビタミン C が有意に低値を示した。 4)自覚症状の有訴者の割合 自覚症状に関する質問表によって調べた,有訴者の割合 について Table 3 に示す。5 日目において約半数が,「食 欲不振,気分の沈み」,「だるい,横になりたい,昼夜逆転, 朝がつらい」,「腰痛や関節痛,足がつる,力が入らない, 足がむくむ」,「便秘」の項目を「ある」と回答した。また, 10 日目では,上記の項目のほとんどが増加した。また, 「皮膚の乾燥:かさかさ,唇が乾いている」の項目では,5 日目で 80%,10 日目で 70%と高確率で有訴者が現れた。 さらに,「便秘」や「下痢」といった消化器症状を訴える 者も見られた。
考 察
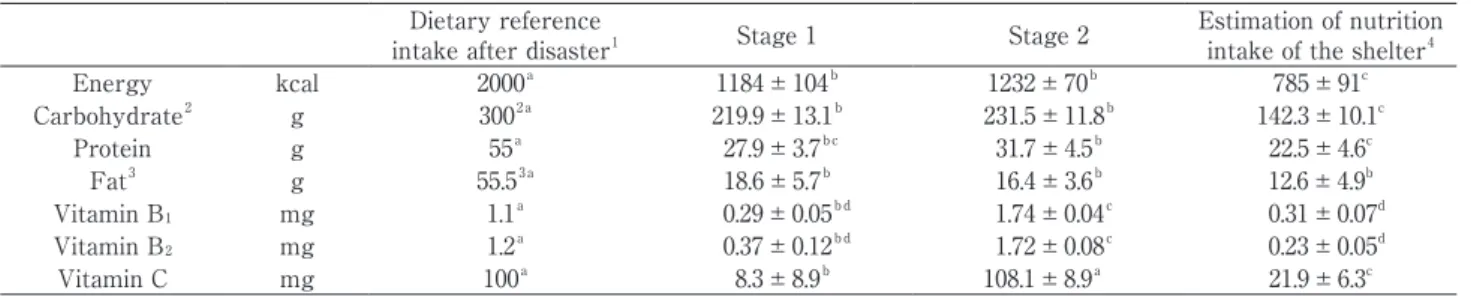
これまでに,東日本大震災後の避難所において,ビタミ ン B1,ビタミン B2,ビタミン C の摂取量が低かったこと が報告されている4)。また,先行研究でめしのみを摂取しTable 4 Nutrition intake of experiment and estimation of nutrition intake of the shelter Dietary reference
intake after disaster1 Stage 1 Stage 2 Estimation of nutritionintake of the shelter4
Energy kcal 2000a 1184 ± 104b 1232 ± 70b 785 ± 91c Carbohydrate2 g 3002a 219.9 ± 13.1b 231.5 ± 11.8b 142.3 ± 10.1c Protein g 55a 27.9 ± 3.7bc 31.7 ± 4.5b 22.5 ± 4.6c Fat3 g 55.53a 18.6 ± 5.7b 16.4 ± 3.6b 12.6 ± 4.9b Vitamin B1 mg 1.1a 0.29 ± 0.05bd 1.74 ± 0.04c 0.31 ± 0.07d Vitamin B2 mg 1.2a 0.37 ± 0.12bd 1.72 ± 0.08c 0.23 ± 0.05d Vitamin C mg 100a 8.3 ± 8.9b 108.1 ± 8.9a 21.9 ± 6.3c
1Presented by Ministry of Health, Labour and Welfare in Japan5).
2The rate of an energy ratio was assumed to be 60% of 2000 kcal/day, and these values were calculated.
3The rate of an energy ratio was assumed to be 25% of 2000 kcal/day, and these values were calculated.
4Food weights was estimated by consulting a report of diet menus in the shelter3), and these values were calculated.
mean ± SD n = 10
a-cp < 0.05
血液・尿中の生化学的検査をして頂きました,東邦大学 医療センター大橋病院・臨床検査部の柿木孝志先生に深謝 いたします。
参考文献
1) 溝畑秀隆(2011)ビタミン・ミネラルからみた避難所 における栄養管理 −阪神・淡路大震災から学ぶ−. ビタミン 85:408-411 2) 森下敏子,久保加織(1997)阪神大震災後の避難所に おける支給食の実態および補食の効果 −神戸市東灘 区の場合−.日本調理科学会誌 30:41-48 3) 迫和子(2011)災害時の栄養問題と管理栄養士・栄養 士の必要性.日本栄養士会雑誌 54:470-473 4) 宮城県保健福祉部健康推進課(2011)みやぎの食育通 信 復 興 応 援 版 Vol. 1. http://www.pref.miyagi.jp/ uploaded/attachment/49407.pdf 5) 厚生労働省健康局総務課生活習慣病対策室(2011)避 難所における食事提供の計画・評価のために当面の目 標とする栄養の参照量について.http://www.mhlw. g o . j p / s t f / h o u d o u / 2 r 9 8 5 2 0 0 0 0 0 1 a 1 5 9 - i m g / 2r9852000001a29m.pdf 6) 湯浅正洋,澤村弘美,榎原周平,松井朝義,渡邊敏明 (2011)災害時におけるビタミン栄養の確保.ビタミ ン 85:389-399 7) 下田吉人(1971)調理と科学,株式会社朝倉書店,東 京:pp.90-106 8) 木村美恵子,藤田登美雄,糸川嘉則(1981)高速液体 クロマトグラフィーによる血液中総ビタミン B1定量 法.ビタミン 55:185-189 9) 美濃眞(2000)日本ビタミン学会が推奨する臨床検査 検体試料のビタミン測定法.ビタミン 74:501-515 10) Sato Y, Uchiki T, Iwama M, Kishimoto Y,Taka-hashi R, Ishigami A (2010) Determination of dehy-droascorbic acid in mouse tissues and plasma by using tris(2-carboxyethyl)phosphine hydrochloride as reductant in metaphosphoric acid/ethylenedi-aminetetraacetic acid solution. Biol Pharm Bull.33: 364-369 11) 中村丁次(2011)災害時における栄養・食事管理 . ビ タミン 85:459-462 12) 蔭士安,董彩霞(2011)四川省汶川大地震の被災地に おける約 1 年後の妊婦・授乳婦および小児の栄養状態 と改善方法.ビタミン 85:519-530
13) Askew EW (1995) Environmental and physical stress and nutrient requirements. Am J Clin Nutr. 61: 631S-637S
14) Ward MM, Mefford IN, Parker SD, Chesney MA, Taylor CB, Keegan DL, Barchas JD (1983) Epi-nephrine and norepiEpi-nephrine responses in continu-おける栄養素摂取量は,約 2 ヵ月後においてもビタミン摂 取量が十分でなく,災害後のビタミン摂取量が長期的に低 下していた。また,海外の例であるが,2008 年に発生し た中国四川省汶川大震災では,1年後の被災地において, 2 − 5 歳児および妊婦・授乳婦を含む成人女性の約半数の 者にビタミン D および鉄欠乏がみられたことが報告され ている12)。本研究においては,上記の報告よりも短期間 の実験食の摂取によって,ビタミン栄養状態が低下した。 今後は,長期化する避難所生活に対して,ビタミン強化食 品および栄養機能食品を活用するなどして,ビタミン摂取 のための十分な対策が必要である。さらに,中国の報告12) では,被災地の乳幼児に対して微量栄養素のサプリメント を配布する事で,鉄欠乏の改善がみられたと報告されてい る。海外では,被災地においてサプリメントの有用性が報 告されている事から,サプリメント配布も積極的に行うべ きである。 本研究では,自覚症状の有訴者が多くみられた。このこ とから,避難所の食事の摂取により,精神的・身体的スト レスが生じていたことが推察される。ストレス時には,エ ネルギー消費量が上昇することが知られており13),ビタ ミン B1,ビタミン B2をはじめとするエネルギー代謝に関 わるビタミンを平時よりも多く消費する可能性がある。ま た,ストレスによって,ストレス応答ホルモンであるカテ コールアミンの分泌が増加することが知られている14)。 カテコールアミンの生成にはビタミン C が必要であり, ストレスによってビタミン C を多く消費する可能性も考 えられる。このように,ストレスの増加によってビタミン の消費量が増加することが予想される。東日本大震災後の 避難所では,避難所生活が長引くにつれ被災者の精神症状 が増加したことが報告されている15)。避難所では非日常 的な生活を強いられていたため,本研究よりも強いストレ スが生じていた事が推測される。以上の理由からも,避難 所においては十分なビタミン摂取が重要であるといえる。 国立健康・栄養研究所および日本栄養士会は,2011 年 に「災害時の栄養・食生活支援マニュアル」を作成し,4 日目以降に「ビタミン,ミネラルの不足への対応」が明記 されている16)。しかし,ビタミン・ミネラルの摂取方法 について,具体的にどのように対応すべきかは明記されて いない。短期的なビタミン・ミネラルの摂取不足による欠 乏症の発症は考えにくいが,東日本大震災では長期の避難 所生活が強いられた例もみられた。今後は,避難所におけ るビタミンの摂取に関するマニュアルの整備や,被災地で 利用可能なビタミン強化食品の開発など,災害発生時への 対策を整える事が急務である。
謝 辞
本研究を行うにあたり,血液・尿中のビタミン B1の測 定についてご指導頂きました,ハウスウェルネスフーズ株 式会社の山本憲朗先生に心より御礼申し上げます。 ― 11 ―ously collected human plasma to a series of stress-ors. Psychosom Med. 45: 471-486
15) 高山真,沖津玲奈,岩崎鋼,渡部正司,神谷哲治,平 野篤,松田綾音,門馬靖武,沼田健裕,楠山寛子,平 田 宗, 菊 地 章 子, 関 隆 志, 武 田 卓, 八 重 樫 伸 生 (2011)東日本大震災における東洋医学による医療活 動.日本東洋醫學雜誌 62:621-626 16) 独立行政法人 国立健康 ・ 栄養研究所,社団法人 日本 栄養士会(2011)災害時の栄養・食生活支援マニュア ル.http://www.dietitian.or.jp/eq/pdf/5.pdf
5- アミノサリチル酸(メサラジン Fig. 1)は潰瘍性大 腸炎に対して使用される薬剤であり1),抗炎症作用を持つ と考えられる一方で,細胞毒性,特に DNA 損傷に由来す ると考えられる抗ガン効果も報告されている2)。5- アミ ノサリチル酸の異性体 4- アミノサリチル酸(PAS Fig. 1) は抗結核剤として用いられる3)。今回,サリチル酸誘導体 の細胞毒性発現において活性酸素の関与を考え,これら化 合物の活性酸素生成能を金属イオンに対する反応性との関 連において検討した。
材料と方法
試薬,実験材料-パン酵母,NADP 依存性イソクエン 酸脱水素酵素はオリエンタル酵母,サリチル酸,4- アミ ノサリチル酸,5- アミノサリチル酸は和光純薬,ジピコ リン酸,ネオクプロイン(2,8- ジメチル -1,10- フェナン トロリン塩酸塩)は片山化学,バソフェナンスロリンジス ルホン酸,トリス(Trizma base)はシグマ,NADP はロ シュ・ダイアグノスティックス,DPPH(2,2- ジフェニル -1- ピクリルヒドラジル)はカルビオケムの製品をそれぞ れ用いた。 低分子物質透過性パン酵母の調製-市販のパン酵母 1 g を 0.5 M ソ ル ビ ト ー ル を 含 む 0.2 M リ ン 酸 緩 衝 液(pH 7.4)4 ml に懸濁し,2.5 ml のトルエンを加えた。43℃で 2.5 分間加温後,遠心分離によって上清を除き,0.5 M ソ ルビトールを含む 50 mM トリス・塩酸緩衝液(pH 7.1) 4 ml に懸濁した。これによって酵母は低分子の物質に対 する透過性を増しアコニターゼ活性を細胞そのまま(in situ)で測定できるようになる4)。酵母 1 g を 1 ml と仮定 し,以後この懸濁液を酵母 200 mg/ml として計算した。 アコニターゼ活性測定資料の調製-上記の透過性パン酵 母懸濁液 50 µl を 50 µM FeSO4,Fig. 5-7 に示した各濃度 の化合物,1 mM KCN(Cu/ZnSOD5),シトクロムオキシ ダーゼを阻害6))を含む 40 mM トリス・塩酸緩衝液(pH 7.1)0.95 ml に加えて酵母の濃度を 10 mg/ml とし 37℃に て 5 分または 10 分間加温後,800 × g にて 5 分間遠心し, 沈殿した酵母を 40 µl の 0.5 M ソルビトールを含む 50 mM *所在地:愛知県長久手市岩作雁又1-1(〒480-1195)原 著
サリチル酸誘導体による活性酸素生成
村 上 恵 子,細 川 好 孝,吉 野 昌 孝
(愛知医大・医・生化*)Generation of reactive oxygen species by salicylate derivatives
Keiko M
urakami, Yoshitaka H
osokawaand Masataka Y
oshinoDepartment of Biochemistry, Aichi Medical University School of Medicine, Nagakute,
Aichi 480-1195, Japan
Summary
5-Aminosalicylate (mesalazine) and 4-aminosalicylate (PAS) are used for treatment of ulcerative colitis and for tuber-culosis, respectively. Biological effects of these compounds were analyzed in relation to the generation of reactive oxy-gen species. 5-Aminosalicylate/iron complex inactivated aconitase, the most sensitive enzyme to oxidative stress. The inactivation required cyanide, an inhibitor of Cu/Zn SOD and cytochrome c oxidase, indicating that this compound can generate superoxide anion radical as a principal product. 5-Aminosalicylate stimulated the autooxidation of Fe2+
suggesting that this compound promoted the activation of dioxygen molecule by reduced iron. Salicylate and 4-amino-salicylate were ineffective on aconitase activity and did not stimulate the autooxidation. Cellular damage by 5-amino-salicylate can be partially explained by its transition metal complex-mediated generation of reactive oxygen species.
Fig. 1 Structure of salicylate derivatives.
― 13 ― Trace Nutrients Research 30 : 13-16(2013)
リプロンより強く(p < 0.05),ジピコリン酸より弱かっ た(p < 0.05)。サリチル酸,4- アミノサリチル酸は全く 失活効果を示さなかった(Fig. 5) 5- アミノサリチル酸によるアコニターゼ失活は時間依 存性(Fig. 6),かつ用量依存性(Fig. 7)であった。なお トリス・塩酸緩衝液(pH 7.1)に懸濁した。これをアコニ ターゼ活性の測定に用いた。このとき各資料を同時に 3 本 調製して活性の平均値と標準偏差を算出し,Dunnet 検定 によって対照との有意差を判定した。 アコニターゼ活性の測定-上記の酵母懸濁液 5 µl を 5 mM クエン酸,0.25 mM NADP,4 mM MgCl2,10 mU/ ml NADP- イソクエン酸脱水素酵素を含む 0.1 M トリス・ 塩酸緩衝液(pH 7.8)1 ml に加えて混合し,分光光度計 UV1600(シマヅ)を用いて 340 nm の吸光度増加を 2 分 間測定した。この時の酵母濃度を 1 mg/ml として反応速 度を算出した。 二価鉄イオンの自動酸化- 0.1 mM FeSO4と Fig. 4 に示 した各濃度の化合物を含む 10 mM トリス・塩酸緩衝液 (pH 7.0)2 ml 中で 37℃に加温し,この溶液 0.2 ml を経時 的に採取し 96 穴マイクロプレート上で 1 mM バソフェナ ン ス ロ リ ン ジ ス ル フ ォ ン 酸 0.05 ml と 反 応 さ せ た 後 に 535 nm の吸光度をマイクロプレートリーダー SpectraMax M5(モレキュラーデバイス社)にて測定した7)。 還元力の測定- 0.1 mM CuSO4,0.5 mM ネオクプロイ ン,10 mM トリス・塩酸緩衝液(pH 7.1)と Fig. 1 に示 した各濃度の化合物を最終容量が 0.25 ml となるよう 96 穴マイクロプレート上で混合し 456 nm の吸光度をマイク ロプレートリーダー SpectraMax M5(モレキュラーデバ イス社)にて測定した。 ラジカル吸収能-安定なラジカル DPPH 0.2 mM と Fig. 2 に示した各濃度の化合物を 100%エタノール中で混合し て室温に 10 分放置した後,その 0.25 ml を 96 穴マイクロ プレートに移し,516 nm の吸光度をマイクロプレート リーダー SpectraMax M5(モレキュラーデバイス社)に て測定した。
結果と考察
5- アミノサリチル酸は銅イオンに対してアスコルビン 酸と同程度の還元力(Fig. 2)を,DPPH に対してはアス コルビン酸以上に強いラジカル吸収能(Fig. 3)を示した。 4- アミノサリチル酸とサリチル酸にはほとんど効果は見 られなかった(Fig. 2, 3)。この結果は 5- アミノサリチル 酸の薬理作用抗炎症作用を説明する基礎(炎症の原因とな る免疫細胞由来のラジカルを消去)と考えられる。 二価鉄イオンの自動酸化に対して 5- アミノサリチル酸 は強力な促進作用を示したが,サリチル酸,4- アミノサ リチル酸には酸化促進は認められなかった(Fig. 4)。 アコニターゼは活性酸素に対して最も感受性の高い酵素 であり活性酸素のセンサーとして利用できる8, 9)。5- アミ ノサリチル酸は鉄/シアン存在下でパン酵母アコニターゼ を失活させ,活性酸素の生成を示唆した。この効果を以前 に報告したデフェリプロン10),及びジピコリン酸11)と比 較した。両者とも鉄酸化促進作用を持ち,かつアコニター ゼを失活させるが,5- アミノサリチル酸の作用はデフェ 0 0.04 0.08 0 0.2 0.4 Additives (mM) C u +(m M ) 0 0.3 0.6 0.001 0.01 0.1 1 Additives (mM) A 51 6 0 0.05 0.1 0.15 0 20 40 Time (min) Fe 2+(m M)Fig. 2 Reduction of Cu2+ by ascorbate and salicylate derivatives.
Each compound was mixed with 0.15 mM CuSO4, 0.5
mM neocuproin-HCl and 10 mM Tris-HCl (pH 7.0) on mi-croplate. Absorbance at 456 nm was measured by plate reader. ◆ , ascorbate; ▲ , 4-aminosalicylate; ■ , salicy-late; ● , 5-aminosalicylate added.
Fig. 3 Scavenging of DPPH radical by ascorbate and salicylate derivatives. Each compound was mixed with 0.2 mM DPPH in 100% ethanol. Absorbance at 516 nm was mea-sured. ◆ , 5-aminosalicylate; ▲ , salicylate; ■ , 4-amino-salicylate; ● , ascorbate added.
Fig. 4 Effect of salicylate derivatives and dipicolinic acid on the
autooxidation of Fe2+. FeSO
4 of 0.1 mM was incubated in
10 mM Tris-HCl (pH 7.0) at 37ºC. Aliquot of 0.2 ml was mixed with 0.05 ml of 1 mM bathophenanthroline disul-fonate at the indicated time and the absorbance at 535 nm was measured. ◆ , no addition ; ▲ , 0.2 mM salicy-late; ■ , 0.2 mM 4-aminosalicysalicy-late; ○ , 0.2 mM dipicolinic acid; ● , 0.2 mM 5-aminosalicylate added.