(注意)この論文には正誤表があります
香川大学農学部学術報告 第16巻第1号 正誤表 URL
http://www.lib.kagawa-u.ac.jp/metadb/up/AN00038339/AN00038339_16_1_e.pdf
Notice
Technical Bulletin of Faculty of Agriculture, Kagawa University Vol.16 No.1 Errata
URL
Tech Bull. Fac Agr Kagawa Univ
EFFECT OF VITAMINS K, D, AND C ON CALCIUM
AND PHOSPHORUS IN GOAT'S
MILK
m
On the Effect of vitamin C injection Toyoki MIY ABEAs in the case of bone, vitamin C a s well as D has an influence on the structure and miner
-
alization of the teeth and their effects are exerted particularly during the period of dental developement. In general, however, calcium and phosphorus of well-developed teeth under- g o a continual replacement by the help of vitamin C , although there are fairly less r e - sponsive than vitamin D against these metabolic actions. Little is yet known concerning the agency of vitamin C by which casein is changed to calcium phosphocaseinate in mammary.In the previous paper('. 2 ) , vitamins D and K were demonstrated to be an active ingredient affecting the synthetic process of calcium phosphocaseinate in mammary gland. This investi- gation in the third report was performed mainly to demonstrate whether or not there is an effect in the same experiment of vitamin C , as mentioned above
Materials and Methods
Three dairy goats of the Saanen breed were employed in this experiment for each injected vitamin C. Five hundred mg of vitamin C ( t h e products of Takeda Yakuhin Co ) was i n - jected into the intramuscular portion of buttock of goat. These experimental dairy goats
( I ,
n
, anda)
were in the later lactation period of 7,8,
and 8.5 months respectively. The milk yields per day in the course of the present experiment were 3.2, 1.8, and 0.3 L, respectively. All milks used in the analytical experiments for this report were obtained from each goat that had been fed exactly on the same ration and milked in the same way twice a day a t8
or24
hours' lapse after injsction early in the morning. During the first 30 days before this practical experimental period, the animals were accustomed to the diet.I n the determinations of calcium and phosphorus, the color which appeared after the r e - agent was added to each sample was measured by the T6kyB KBden photometric calorimeter ( ANA - 7 A t y p e ) using the appointed wave-length filter. Calcium was determined by Yanagisawa method@) and phosphorus by Fiske Subbarow methodc4) as described in the previous paper . ( I ')
The examinations of alcohol test and t i t ~ a t a b l e acidity were conducted in accordance with the same procedure as mentioned earlier. Slrimmilk obtained from fresh millr soon after milking was used for analysis in this experiment. Seperator was operated thrice for 3 minutes a t 3,000 r
.
p. m. in order to get rid of milk f a t . For the purpose of antisepsis, approxi- mately 3 to 5 drops of Toluole were added to skimmilk.The procedure of diffusible calcium or phosphorus p ~ i o r to these colorimetric determinations was similar to the one used in the previous reports(' '). The apparatus used for dialysis of skimmilk was prepared a s follows : first a glass pipe ( I cm in diameter by 5 cm in length )
Vol. 16, N o . . I (1964) 67
was prepared with fishskin membrane (Aidearu Co. ) a t its lower end. This membrane which involved the 1 ml content was tightly wrung with rubber band. Following this, dialysis was allowed to stand for 3 houxs, duxing which the distilled water was kept at approximately
22'C in thermostat, by stirring a t 30-minute interval.
T o the dialysed skimmilk was added double distilled water t o make a total volume of 10 or 20 ml. This skimmilk was analysed as samples f 01 bound -calcium and bound -phosphorus. In this case, since the sharp rise of dialysis percentage was shown a t a point of 3 h o u ~ s on t h e curve, the values analysed at this point were expressed a s diffusible calcium or phos- phorus in milk. The figure of bound calcium was expressed as calcium (mg) per casein (g) the value of which, obtained from setting off the diffusible calcium against the total calcium (mg%), was divided by casein amount (g) per 100 ml of milk to which vitamin C had been applied or not. Similarly, the expression of bound-phosphorus was also taken in t h e same way as mentioned above. The content of nitrogen i n milk was determined by the Kjeldahl method, and the content of protein was obtained by multiplying that of nitrogen by 6.38.
Results and Discussion
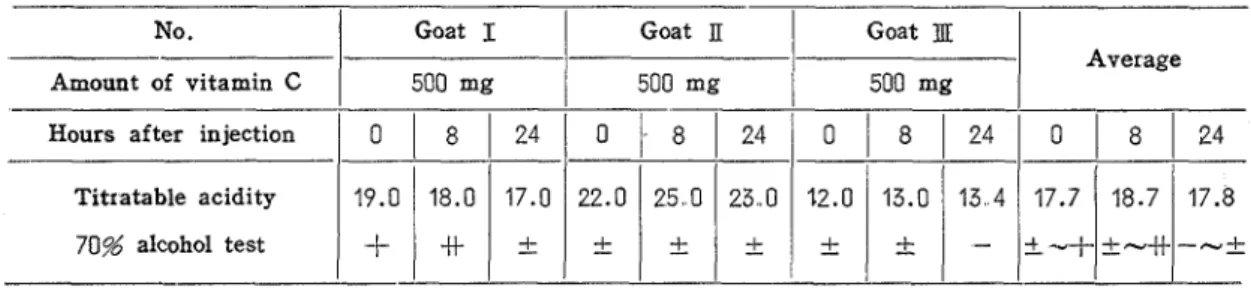
Table 1 gives the effect of injection of vitamin C on titratable acidity and alcohol test of milk. Three goats, which were already late in lactation in the course of the present experi- ment and whose milks were high in titratable acidity, were used in this experiment. There- fore the alcoholic reaction in a l l showed a fairly strong positive a t the s t a r t before injection. Following this, however
,
due to the iniection of vitamin C was found a slight decrease of alcohol-coagulation power. The alcoholic reaction was changed from positive into negative. On the other hand, there was little change in the titratable acidity.Although the intensity of alcoholic reac- tion in goat I
,
above a l l , increased temp- orarily a t 8 hours after injection of vitaminLapse of time C , its intensity a t the following
24
hoursFig 1 . Determination of dialysis percentage by declined again, and i n this case exhibited fishskin membrane procedure
a,. diffusible calcium much more weaker degree than in the case b. diffusible phosphorus when no vitamin C was injected. Of these goats, the value of titratable acidity i n goat
II
was markedly higher than i n both of the other goats I andIII,
the value for goatTI
being approximately 22.0 t o 23.0. The milk acidity of goatJII
was observed to be lower than that of the standard value. Namely, this was low-acidity milk. But the milk acidity of goat1
was normal.68 Tech. Bull
..
Fac. Agr.
Kagawa Univ. T h e milk acidity of goatII
was higher than that of the others, but this milk was not liable to bring about the coagulation by alcohol test. The figures of protein, calcium, and phos- phous contents and of Ca : P ratio or dialysis percentages, which were obtained as the results of the injection of vitamin C , are presented i n Table2,
together with the corresponding meanTable 1. Effect of injection of vitamin C on titratable acidity and alcohol test of milk,
values. As seen in this table, there appeared to be no direct relationship between calcium and phosphorus contents in milk due to vitamin injection, a t least i n the present experiment though only three goats were employed.
Moreover, the injection of vitamin C brought about no marked variation, not only in calci- um and phosphorus contents, but also i n their dialysis percentages and Ca : P ratio except for a small increase of the protein and casein contents. In this respect, any signifi,- cant influence of vitamin C could hardly be observed as in the case of vitamins D a n d K.
As i s often the case with the later lactation period, however, the milk of goats
a
and El showed the high -protein content ranging from about 4.5 to 5.396 throughout this experiment. The total protein content tended to decline slightly a s time passed b y , and t h e n the max- imum rate of decrease a t24
hours after injection was so small, being about only7
% per 100 of the value ( 0 hour) without injection, a s seen i n goat I.
Conversely, t h e same r a t e of goatsII
and El seemed t o increase slightly, a t least at 8 or24
hours. T h e maximum rate of increase of protein content i n milk was about 6%
a t24
hours in goat'a
and about 9 % a t 8 hours i n goat El.Judging from these results (
IT
and 111 ), the injection of vitamin C may bring about a n i n - crease in the protein content, although this effect was small in all cases, averaging about 0%
over the entire experimental period. The maximum rates of change in casein distribu- No.Amount of vitamin C Hours after injection
-
Titratable acidity 70% alcohol test
tion (so-called casein numbers, i. e . ,
%
casein in total protein) for goats I,
a,
and El were 4, 11, and-7 % respectively. The amount of calcium i n all goats ( 1,
a ,
a n d El) was ranged from 122.9 to 130.4 mg per 100 ml of milk, with a n average of 128.0 mg per 100 ml obtained on pooling all figures.No definite trend due to the injection of vitamin C was observed i n calcium content indi- cating that the maximum rate of increase 01. decrease per 100 before the injection was only less than about 3 % during lapse of time. In addition, neither calcium nor diffusible calci- um was affected markedly by vitamin C. In this respect, the calcium and its ionization in the case of vitamin C differed from those of vitamins K and
D
; their variations wereGoat I 500 mg 0
1
81
24 GoatII
500 mg 01
4
24 17.0 19.0 18.0 22.0 23 0 Goat JlT, 500 mg 01
81
24 Average 01
81
2.4 25 0+
S
t
+
-
+
+
-
+
+
&
-12.0 17.8
---+
13.0 17.7+
--f 13 4 18.7*-+
Table 2. Effect of injection of vitamin C on protein, calcium, and phosphorus in milk..
Hours after injection
(
0/
81
24 No..
Amount of vitamin C
Total protein g/dl 3 3 4 3 1 5
Casein g/dl 2.29 2 21
% Casein in total protein 68.6 70.2
Total Ca mg/dl 124.5 128.3 Diff
.
Ca mg/dl % Diff..
Ca in total Ca Total P mg/dl 115.2 100.0 Diff.
P mg/dl 63.9 48.7 % Diff. P in total P1
55.6 48,7higher for the K and lower for the D , i n particular those for the latter being remarkable, Average
when comparisons a r e made with differences i n the data obtained from the serial reports of Goat X
500 mg Goat I
500 mg
vitamins K , D, and C concerning calcium metabolism. Goat
II
500 mg
On t h e other hand, the phosphorus content was 98.8 to 125.4 mg, being 111.9 mg a s aver- age for all goats with and without the injection of vitamin C and so decreased fairly in the case of goats I and
a .
This range is normal. Although the depression of total and diffusi- ble phosphorus contents in milk was not markedly caused by the injection of vitamin C, when i t was compared with the case of vitamins K and D, these results had a greater change in the rate of increase or decrease per 100 of the value without injection in any o t h e ~ .I n other words, this fact showed that its effect would not be so noticeable as in the case of vitamin K indicating the maximum rate of increasing by about 25% (about 15% as aver., a g e ) per 100 of value before injection. This rate of decrease was approximately
7 %
for all values. Such a trend, however,
seems to be reliable, for both total and diffusible phos- phorus contents tend to decline for all goats regardless of their small variation. The value of Ca : P ratio after injection was somewhat h i g h e ~ than 'that before injection. This value vari-
e d from about 1
.I
to 1.2 for three goats.The figures of bound-Ca (mg) per casein (Ig) calculated from the absolute value of bound-
Table 3. Effect of injection of Vitamin C on calcium and phosphorus combined with casein. No..
Amount of Vitamin C Hoursafter injection Bound-Ca(mg per g casein) B o u n d - P ( m g p e r g c a s e i n ) Bound-Ca : P
7--
Goat 11 Goat 500 mg 500 mg PA-Goat 1 500 mg 01
81
24 Average 01
8/
24 29.4 18..5 1.59 01
81
24 26,,8 22..4 1.20 18.6 11.3 1.65----
01
8/
24 22.1 14.1 1,,57--
28.9 23.2 1.25 21.4 14..8 1.54 18.7 10.6 1,,76 21.4 15.8 1.39 18.1 11.3 1.60--
15..8 10.,2 1.55 17.1 12.9 1.33 21.1 13.5 1.56 --70 Tech.. Bull. Fac. Agx ,, Kagawa Uuiv..
calcium or phosphorus (mg) and of casein amount (g) per 100 ml of milk are summarized i n Table 3. As seen i n this Table, in the bound-calcium a s well as the bound-phosphorus against casein (I g)
,
the immediate change following the initiation of vitamin C injection was not so evident. Then these values obtained without injection averaged 21.4 mg, being 18.6 to 26.8 mg for calcium (mg) combined with casein (1 g) while 14.8 mg, 10.6 to 22.4 mg for the same phosphorus (mg).
But, if then, observed i n detail, the injection of vitamin C to goat, but not always, elicited a fairly great increase by about 10 and
27%
for goats 1 andm ,
in particular being evident in the latter, in the bound-calcium (mg) against casein (1 g) of goats I anda
duringTable 4 , The average rates of increase and decrease after injecton of vitamin C .
Total protein (%) .-5.7
Casein (%)
1
-3.5No
-
Amount of vitamin C Hours after injection
% Casein in total protein (%)
/
2 . 3Total Ca (5%)
/
3 . 1Goat I Goat Goat Ave of
- I E , Total 500 mg 500 mg 500 mg and * v e 8 2 4 avezage 8
/
24 81
24 Diff. Ca (%) % Diff. Ca in total Ca (%) -1.2 Total P (%)I
I.' -13.2 Diff..
P (%) -23 8 % Diff. P in total P (%) -12.4 Ca : P (%)/
18.524 hours' lapse. Conversely, there was a slight decrease by about 15% in goat ]I a t the same 24 hours. On the other hand, the rate of change in the bound-phosphorus (mg) against casein (1 g) was about 7 and 10% lower in goats I and
It
and about 28% higher in goat than the values without injection.On pooling the data of the three goats, the mean value of 1 . 7 and 1 .I% at the rate of increase per 100 without injection were obtained for bound-Ca and P (mg) per casein ( I g ) respectively, while the corresponding Ca and P were about 1.4 and -6.1%.
T h e value of the bound-Ca : P ratio after injection became progressively smaller in goats I and 11 except that a single instance was found indicating an opposite tendency a s seen in goat
a.
And this value ranged from 1.20 to 1.76 throughout the experiment. The difference of 0.1 to 0.4 for the bound-Ca : P ratio indicates that the response to vitamin C was slightly larger than 0.1 to 0.2 for the total Ca : P ratio.By comparing the value of Ca : P ratio with that of the bound-Ca : P ratio, the evidence suggests that the difference due to the injection of vitamin C was very much similar or parallel with each other. Neverthless, as described above, the values for three goats show that there was a little change i n the bound-Ca : P ratio during the lapse of time a f t e ~ initi-
7 1 V O ~ . . 16, No. 1 (1964)
ating vitamin C injection. Then the bound-Ca : P value was about 1.
50
higher than about 1.20 of the total Ca : P value as the mean value obtained on pooling the figures of all goats.I t may be attributed to the normality of salt balance that the alcoholic reaction, even i n the high-acidity as i n goat
JI,
showed t o be relatively weak positive, although there was abnormal value showing about 11 mg lower than the normal value in the bound.phosphorus.From the entire results, these small fluctuations are to be expected since vitamin C itself is a weak contributor to calcium metabolism a s compared with vitamins K and D.
In short, except for the contents of
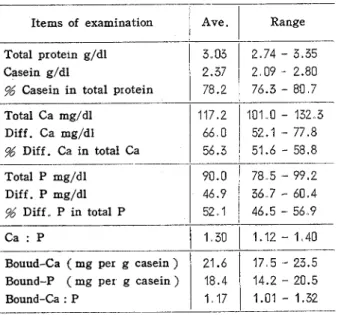
Diff. Ca mg/dl 52.1 - 77.8 4 )
.
To be brief, this seemed evident % Diff. Ca in total Ca 51.6-
58.8.- only in the phosphorus content.
Table 5 The results of six analyses in normal cow's milk. total and diffusible phosphorus and the
- ratio of bound
-
Ca : P to casein, theItems of examination
I
Ave./
Rangeover -all variation of the rest constitu-
-
Ca : P
-
1
301
- 40 i n the calcium content as mentionedBouud-Ca ( m g Per g casein)
/
21.61
17 5 .- 25.5 above. Also the ratio of bound-Ca :P
2 7 4 - 3 3 5 ents was found to be small or unchange 2 09-
2.80 able from the comparative observation76.3 - 80 throughout the lapse of time both with
-
Total protein g/dl Casein g/dl
% Casein in total protein
Total P mg/dl Diff. P mg/dl % Diff. P in total P
Bound-P ( mg per g casein ) 18.4 14.2 ,- 20.5
generally did not seem to follow a d e - Bound-Ca : P
1
1,171
1.01-
1.32- finite trend.
Total Ca mg/dl
/
117 2/
101 0 - 132.3 and without vitamin C injected ( T a b l e3.03 2.37 78.2
Vitamin C , however, was most like
-
ly to regulate the balance of Ca : P in milk, so that less coagulation of milk was brought about by alcohol test.The results of 6 analyses a s to calcium, phosphorus and their ionization in cow's milk are summarized in Table
5
i n comparison with those i n goat's milk in this experiment.-
ard value, since there was no change90,O 46'9 5 2 1
Summary
78 5 - 99.2 Accordingly, the Ca : P ratio appeared 36
-
'Oe4to approach gradually toward the stand-
4 6 . 5 - 5 6 9
The major objective of this investigation was to demonstrate the behaviors of calcium and phosphorus against calcium phosphocaseinate in the milk of dair y goat when vitamin C was injected.
I n the present experiment
500
mg of vitamin C was injected into the intramuscular portion of buttock of goats late i n lactation. Samples of goat's milk milked twice at 8 or 24 hours after injection were subjected t o dialysis to determine their nature.Although the alcoholic reaction exhibited positive i n all already at the start before i n - jection, i t showed a tendency to decline slightly due to the injection of vitamin C. And any significant change of milk acidity could hardly be observed.
72 Tech. Bull. Fac. Agr. Kagawa Univ.
occurred in protein, casein, and the percentage of casein in total protein and in total calci- um, diffusible calcium, and i t s ionization percentage except that there appeared definjte t ~ e n d toward decrease, although to a lesser degree, in total and diffusible phosphorus con- tents and its ionization percentage. In brief, due to the injection of vitamin C , dairy goat had a small change only i n phosphorus than in any other.
The bound-Ca : P value to casein was about 1.50 higher than about 1.20 of the total Ca : P. Then the bound-Ca : P values did not seem to follow a definite trend. And then vita- min C had no action of binding or releasing calcium and phosphorus against casein i n milk.
The Ca : P ratio appeared to approach gradually toward the standard value a s the result of vitamin C injection. Accordingly vitamin C was most likely to regulate the balance of total Ca : P i n milk, so that less coagulation of milk was brought about by alcohol test.
From the entire result, these small variations are to be expected since vitamin C itself i s a weak contributor to calcium metabolism a s compared with the case of vitamins D and K .
(Received June 10, 1964) References
(1) MIYABE, T. : Tech.. B u l l . Fac.. Agr., Kagawa (3) YANAGISAWA, F . : Seikagaku Zikkenho, 1,
Unk'v., 15, 149 (1964).. Tbky6, Bunk6d6 (1953).
(2) MIYABE, T.. : T e c h . B u l l . Fac. A g r . , Kagawa ( 4 ) SUBBAROW, F . S . . : J.. Bi'ol.. Chem., 66, 375
U n i v . , 15, 155 (1964).. (1925).
$ @ ~ % D B @ J M @ $ L ~ ~ ~ F K Y ~ $ ' J C % ~ ~ & L k k $ - D y / @ D j 5 . . t f . I Y ,, h l v i / p A # @ @ @ (calcium
phosphocaseinate) Kir.%-j-6 h ~ v i / 9 L, k@$D@FqBSab;t,~Ucucf 6 Z, k KR& 3 k
$%&kTM.500mgD Y P 5 ./C a ~ U \ $ i , % ~ D h % D y i 4 % K ~ % ~ & H S hk. -? L T&4$f&D 8 E$Pd 224@PdK#?R L . B f i % @ K 1 7 C @ f % % R 7 k ,
+D%E, Y P
:
Y C ~ 8 8 $ K a 9 . 7/v3-/l.E.~&~E&$JK%K.~-b-d~CP%l&T&77",2M.b~k, &H~&K.B,B fibK@,&DfiZiFq%ZL, 7 L D & ~ K E 3 % 7 k @ 4 k k L Z + b h 7 k f ~ h 7 k3 k Y 9 <, Y C DE83K 2 5 , &#, Bfi@%X G # D 4 % Y ~ L @ D @ K , B f i ~ ~ T M & 6 ~ 3 ~ , - ~ ~ D ~ @ & b D # Z i ~ ~ ~
& b i h k . z.~!&~$D&EQU, n u 4 Y ~ B . . P B Q B I O O ~ ~ ! - ~ C D ~ - V ~ Y D ~ J & % ~ U & ~ ) V V ~ A , B;Uit&n
I l / i / 9 A , h / V i / 3 A D 4 % Y . I L @ K B . ~ % ~ ~ L B Z + ~ ~ ~ ~ S ~ ~ ~ % ? 6 h ,
. ~ & D & % K & ~ E ~ L M I ' C ~ ~ ~ . ~ ~ ; ~ , S @
E K B @ s l K Z I d L k .
h,.tfd
as.;?
Ca : PDf&.M.I. 5 0 T & ~ , T , Ca : PD1..20K&<2&75~7k.. 3 L -C LCD,$&& Ca : Pc31E:K- . ~ C D # ~ F q B ~ b \ X r) K , E ; h h k . 3 k Y P E ~ C K M . $ t @ D h . . t f 1 Y K ~ L . T ~ ~ / ~ / ~ / + I A + # % @ ~ S V ~ D ,
2$
% S . @ k g , j - 6 ? ~ M B ,
it
, - c b ~ 7 k ; t , ~ , k Y 9 5 Y C D ~ M K ~ Q,-C Ca : PD~!~@.M,Z%Z%, $ % W B : C D ~ - Z ~ $ ,71v3-.lvy);: f. R X 6 $ L B H & . & % $ h k , g7 T Y P
:
Y C B.YL+oCa : PDi%%jBtj%Bg~.?& 25
5,E;hhk.C L ~ D, K