Design method of Cockpit module in consideration of
switch type, location of switch and display
information for older drivers
Atsuo MURATA, Keita YAMADA and Makoto MORIWAKADept. of Intelligent Mechanical Systems, Division of Industrial Innovation Sciences, Graduate School of Natural Science and Technology, Okayama University
3-1-1, Tsushimanaka, Kita-ku, Okayama-shi, Japan
E-mail: {murata, khyamada0923, moriwaka}@iims.sys.okayama-u.ac.jp Abstract― In this paper, the effects of switch type,
location of switch, and display information on the primary driving task and the secondary switch operation were investigated. The switch type included an integrated and a non-integrated switch. These switches were located on the front left, on the left side, or around a steering wheel. We prepared three displays with different display information (2.0, 4.1, and 5.9 bit). The tracking error, the mean operation time, the percentage of correct answer, NASA-TLX mental workload, and the subjective evaluation of usability were measured in order to analyze how these measures were affected by experimental factors above.The results suggested that young adults are better than older adults at both abilities on processing displayed information and operating switches. The integrated switch was found to affect driving performance than the non-integrated switch, and had little influence on switch operation. In addition, it was clarified that the switch located around a steering wheel had little influence on driving performance. Low display information was also found not to affect the performance.
1. Introduction
With the growth of intelligent transportation systems (ITS), such as car navigation systems or hands-free cellular phones, driving is becoming more and more complex[1]. As much of the information provided
contains texts and images, drivers are apt to become distracted and inattentive. Driving a car places a characteristically heavy workload on visual perception, cognitive information processing, and manual responses[2]. Drivers often simultaneously perform two
or more tasks; for example, they adjust the volume of a radio or CD player and control the air conditioner to adjust the temperature while driving. Such sharing of attention may lead to dangerous situations.Previous research in the area of displays and controls for secondary devices in automobiles is notable for the lack of reported work on compatibility. Most research discusses design of the display or the control, but not the way in which they are to operate together, which includes effects of compatibility.
Lambel, Kauranen, Laakso, and Summala and Lambel, Laakso, and Summala discussed the relationship between
display location and performance in car driving situations[3],[4]. Lambel, Laakso, and Summala reported that the driver's ability to detect the approach of a decelerating car ahead was affected by the display location[4]. Waller and Green[5] examined switch type and
its location, and pointed out a lack of consensus as to where the control should be located. Proper control (switch) location must be one of the important factors to assure fast responses of drivers.
Makiguchi et al. [6] demonstrated that steering wheel
mounted controls were more effective than controls on the instrumental panel. However, they did not examine the effectiveness of steering wheel-mounted switches by taking the display location factor into account. Although Wierwille[7] stated that in-car controls and displays
should be designed by taking visual and manual demands into account, he did not give guidelines for where the displays and controls should be located. Murata and Moriwaka[8] investigated how the number and
arrangement of steering wheel mounted switches interactively affected performance. They found that the cross-type arrangement with three switches provided best performance and highest psychological rating.
These studies did not take the memory factors into account to the design of display with layered structures. The display design also should consider the findings on eye movement characteristics that horizontal eye movement is faster and easier than vertical eye movement. Although Murata and Moriwaka[8]
investigated how the control should be designed without taking the display factors into account, the interaction between display and control factors must be investigated in order to obtain a more proper design guideline.
A variety of knob, lever, press switch, rotary switch, and toggle switch is arranged in the automobile cockpit module [9]. These controls are mainly used to operate an
AM/FM radio, or adjust the temperature in the vehicle. The operation of such controls induces operational workload [7], [10]. The usability of controls is affected by
installation location, frequency of use, ease of differentiation, etc. Moreover, it has been suggested that the controls should be placed taking the display system into account [11].
Dukic et al.[12], [13] showed that the switch (control)
location close to the gear stick which has highest eccentricity produced a shorter time off road (the time Fifth International Workshop on Computational Intelligence & Applications
period when drivers look aside). Moreover, Dukic et al.
[13] showed that older adults spent longer visual time off
road when pushing the switches and had larger steering wheel deviations. Although Dukic [12], [13] did not use an
integrated switch, they predicted, on the basis of their results, that the integrated switch should be installed on the drivers’ side from the viewpoint of decreasing time off road.
With the progress of by wire technology in automobile utilization, it is possible to install controls to a variety of sites of a cockpit and carry out a lot of secondary tasks using these controls. Although the integrated switches are practically used in IDrive of BMW or Honda Odessay, the effectiveness or the design guideline has not been explored thoroughly. In spite of the importance of proper design of controls (McCormick et al. [9]), there seem to be few detailed studies that
specified how to design and utilize such an integrated control (switch).
Older adults may have more difficulty in operating a vehicle than younger adults. There are many reports suggesting that older adults exhibit deficits in various cognitive-motor tasks[14]-[15]. Imbeau et al. [16] discussed
how the aging factor affected display design and driving performance. They made an attempt to provide designers with integrated performance data that helped them answer design questions and evaluate design alternatives. They presented a model that can predict performance (glance time of the display) using age, character size of the display, and contrast of the display. However, they did not discuss the effects of controls. Smith et al. [17]
reviewed the current databases applicable to automobile design. They pointed out that design approaches and data used in automobile design are mostly for a young population. The controls that are usable even for older adults must be developed.
In this study, age (young and old), type of switch(control) (integrated and non-integrated) , install location of a switch, and quantity of display information was selected as experimental factors, and how these factors should taken into account was explored in automotive simulated driving environment where the participant simultaneously carry out a simulated driving task and a secondary switch pressing task such as adjustment of air conditioner or setting of audio. Some implications for the design of a cockpit module were given.
2. Method
Drivers in the experiments performed a simulated steering task. The secondary tasks included the control of an air conditioner, the operation of a radio, and the operation of a CD/MD.
2.1 Participants
Twenty participants took part in the experiment. Ten were male adults aged from 66 to 75 years. All had held a driver’s license for 30 to 40 years. Ten were male
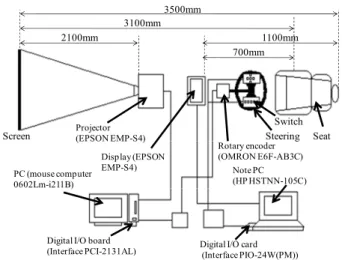
Fig. 1 Outline of experimental systems.
undergraduate students aged from 21 to 24 years and licensed to drive from 1 to 3 years. The visual acuity of the participants in both young and older groups was matched and more than 20/20. They had no orthopedic or neurological diseases.
2.2. Apparatus
The experimental system is illustrated in Fig.1. The main components were (i) a pursuit tracking system (a personal computer with an I/O board, rotary encoder, and steering wheel). This PC was connected to a projector to display a tracking task in front of the participant.), (ii) a personal computer that was used to display speedometer and operational information and (iii) a personal computer equipped with an I/O card and used to enable the participant to operate switches. The CRT was in front of the participant.
2.3 Display
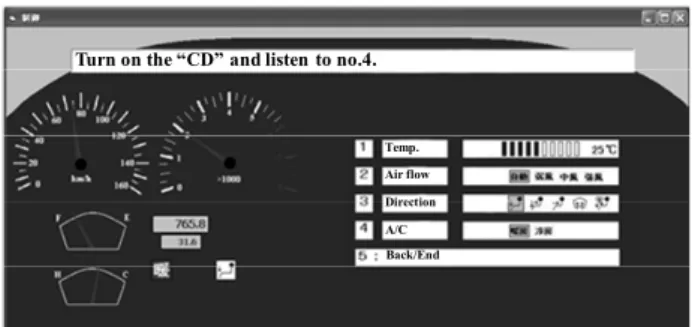
The display includes two static meters (speedometer and tachometer). Three displays show different kinds of information. One displays a task that the participant must perform using the switches. This display did not change until the task was completed. The second display informs the participant of the current state as the task is performed. The third displays a group of selectable menus. The related icons are also shown on the lower left. An icon related to an air conditioner is shown on the left. An icon related to a CD/MD and an AM/FM radio is shown on the right. The icons are for cooling (air conditioning), heating, CD, MD, repeat functions of CD or MD, and AM and FM radio. When these functions are selected, the corresponding icon appears. Examples of four types of displays are shown in Fig.3-Fig.5. In the easy task, using a display shown in Fig.5, one of the five alternatives is selected by a single key press. In the difficult task (Fig.3, Fig.4). according to the instruction displayed on the top, the task is performed using multiple key presses.
Screen Projector(EPSON EMP-S4)
PC (mouse computer 0602Lm-i211B)
Digital I/O board
(Interface PCI-2131AL) Digital I/O card(Interface PIO-24W(PM)) Note PC (HP HSTNN-105C) Steering Switch Seat Display (EPSON EMP-S4) Rotary encoder (OMRON E6F-AB3C) 3500mm 3100mm 2100mm 700mm 1100mm
Photo 1. Integrated switch.
Photo 2. Non-integrated switch.
2.4 Task
There were three types of secondary tasks: (i) control of an air conditioner (temperature, air flow, direction of Fig.3. An example of display ((a) difficult condition: one layer, (b) difficult condition: two layers, (c) difficult condition: three layers, (d) easy condition. Only one switch pressing is necessary to complete a task.)air flow, and A/C -when the air conditioner is on, this switch must be on); (ii) MD/CD operation (selection of music, volume, set up of the repeat function, and switching between MD and CD) and (iii) radio operation (selection of radio station, volume, auto-tuning function, and switching between AM and FM.
A sample task was presented as follows: "Please turn on the air conditioner and adjust the temperature to 27 ℃. "Conducting such a task required pressing a switch a minimum number of times. The participant, however, did not always complete the pre-specified task with the minimum number of switch pressings. It is possible to perform the task with more switching than the minimum required. The participant must first touches switch 1 and select the air-conditioner control. Second, the participant selects A/C from the menu, which allows switching from heating to air-conditioning. Next, the information on the current temperature was shown on the second display (status display). The participant adjusted the temperature to 27 ℃ by operating the left- and right- arrow
(a)
(b)
Fig. 2 Arrangement of switches. (a) plane figure, (b) side view
switches. When the participant determined the final state, the "enter" switch placed on the right side was pressed. It was not until the participant pressed the "enter" switch that the task was completed. Once the task was completed, a new task was shown on the task window to be performed by the participant.
The tracking task (main) was one-dimensional with the horizontal position of a target line changing pseudo-randomly. The participant was required to follow the movement of a target line with the shorter vertical line controlled by a steering wheel. The target signals were produced by summing a number of harmonically related sinusoids of different phases (fundamental frequency 0.007Hz). This allowed several pseudo- random signals that were non-periodic within the duration of the tracking task. The signal bandwidth was set to 0.2 Hz (±0.1 Hz). In such a way, the position of the 23mm 30mm 16mm 11mm 3mm Steering switch Front-left side switch Left-side switch 300mm 350mm 350mm 100mm Seat 540mm 370mm 600mm 970mm Left-side switch Front-left side switch Seat
Fig. 3 Display used in the experiment (High information (5.9bit)).
Fig. 4 Display used in the experiment (Moderate information (4.1bit)).
Fig. 5 Display used in the experiment (Low information (2.0bit)).
vertical target line was generated. The position of the vertical target line changed every 1.5 s. The position of the shorter vertical line controlled by the steering wheel was sampled every 0.1s. This means that the tracking task was one of step input types, rather than continuous. The tracking dynamics were first order in which the cursor responded proportionally to the time integral of the steering wheel (control) position. These dynamics simulate the yawing response of a motor vehicle and hence approximate the visual information processing demands of driving. The error of the vertical cursor from the target line was measured during the tracking duration. The root mean square of the error values was calculated and automatically written to the computer data file.
2.5 Design
The experimental factors were participant age (young and older adults), switch type (integrated and non-integrated), location of switch installation (steering, left-side, and front left-side) and amount of display information (high (5.9bit), moderate (4.1bit), and low
(2bit)). Age was a between-subject factor; others were within- subject factors. Two switch types, that is, integrated and non-integrated switches are shown in Photo.1 and Photo.2, respectively. The location of switch installation is shown in Fig.2 (a) and (b). Examples of three different amount of display information are depicted in Fig.3-Fig.5. If there are alternatives in one display, the amount of display information can be calculated using log n. In this study, for simplicity, the occurrence probability of each alternative was assumed to be equal to 1/n.
2.6 Procedure
The participant was asked to adjust his seat so that the task could be comfortably performed and the left-side console switches could be pressed by reaching his hand naturally (see Fig.1). Before the experimental tasks, the contents of primary and secondary tasks were explained to each participant. The participants were allowed to make practices.
The order of performance of 18 conditions of switch type (integrated and non-integrated), location of switch installation (steering, left-side, and front left-side) and amount of display information (high (5.9bit), moderate (4.1bit), and low (2bit)) was randomized across the participants. The participants were required to keep the primary task stable and also to perform the secondary task as fast and accurately as possible.
3. Results 3.1 Tracking error
In Fig.6, the tracking error is shown as a function of age and amount of display information. In Fig.7, the tracking error is plotted as a function of switch location and switch type. A four-way (age by switch type by switch location by amount of display information) ANOVA carried out on the tracking error revealed main effects of age (F(1,18)=42.756, p<0.01), switch type (F(1,18)=7.517, p<0.05), switch location (F(2,36)=5.822,
p<0.05), and amount of display information (F(2,
36)=110.379, p<0.01). As a result of Fisher’s PLSD (Protected Least Significant Difference) multiple comparisons, the significant differences were detected between steering and front left-side (p<0.05), between steering and left-side (p<0.05), between low and moderate quantity of display information (p<0.05), and between low and high quantity of display information (p<0.05).
3.2 Secondary task completion time
In Fig.8, the task completion time is shown as a function of age and amount of display information. Fig.9 shows the task completion time as a function of age and switch type. In Fig.10, the task completion time is shown as a function of switch location and switch type. Four way (age by switch type by switch location by amount of display information) ANOVA carried out on the task completion time revealed main effects of age (F(1,15)=59.312, p<0.01), switch type (F(1,15)=5.690,
p<0.05), switch location (F(2,30)=451.983, p<0.01), and
amount of display information (F(2,30)=451.983,
Temp. Air flow Direction A/C Back/End
Turn on the “CD” and listen to no.4.
Please turn on the heater and adjust the temp. at 27℃
Temperature Air flow
Direction of air
Back
Please select the “Auto lock”
light Wiper Hazard Auto lock
Fig. 6 Tracking error as a function of age and amount of display information.
Fig. 7 Tracking error as a function of switch type and switch location.
Fig. 8 Task completion time as a function of age and amount of display information.
p<0.01). As a result of Fisher’s PLSD (Protected Least
Significant Difference) multiple comparisons, the significant differences were detected between front left-side and left-side (p<0.05), between moderate and high quantity of display information (p<0.05), between low and moderate quantity of display information (p<0.05), and between low and high quantity of display information (p<0.05).
Fig. 9 Task completion time as a function of age and switch type.
Fig. 10 Task completion time as a function of switch type and switch location.
Fig. 11 Percentage correct as a function of age and amount of display information.
3.3 Percentage correct of secondary task
In Fig.11, the percentage correct is plotted as function of switch location and switch type. four –way (age by switch type by switch location by amount of display information) ANOVA carried out on the percentage correct revealed main effects of age (F(1,15)=5.693, p<0.01), switch type (F(1,15)=10.113,
p<0.05), switch location (F(2,30)=30.162, p<0.01), and
amount of display information (F(2,36)=110.379,
0 1 2 3 4 5 6 7
High(5.9bit) Moderate(4.1bit) Low(2.0bit)
T ra cki ng e rr or de gr ee
Amount of display information Young Older 0 1 2 3 4 5 6 7
Steering Front-left side Left side
T ra cki ng e rr or de gr ee Switch location Integrated switch Non-integrated switch 0 5 10 15 20 25 30
High(5.9bit) Moderate(4.1bit) Low(2.0bit)
T ask c omp le ti on ti me s
Amount of display information Young Older 0 5 10 15 20 25 30
Integrated switch Non-integrated switch
T ask c omp le ti on ti me s Switch type Young Older 0 5 10 15 20 25 30
Steering Front-left side Left side
T ask c omp le ti on ti me s Switch location Integrated switch Non-integrated switch 0.7 0.75 0.8 0.85 0.9 0.95 1
High(5.9bit) Moderate(4.1bit) Low(2.0bit)
P erc en ta ge c or rec t
Amount of display information Young Older
p<0.01). As a result of Fisher’s PLSD (Protected Least
Significant Difference) multiple comparisons, the significant differences were detected between moderate and high (p<0.05), between low and moderate quantity of display information (p<0.05), and between low and high quantity of display information (p<0.05).
4. Discussion 4.1 Age
The young adults were superior to older adults for every evaluation measure (tracking error, secondary task completion time, and percentage correct of secondary task). As shown in Fig.7, the tracking error and task completion time of older adults was nearly two times as large as those of young adults. However, as shown in Fig.8 and Fig.11, when the amount of display information was low (=2 bit), the percentage correct and the task completion time did not differ between young and older adults. This means that the reduction of amount of display information is one of effective means to design displays which are usable for both young and older adults from the viewpoints of universal design.
4.2 Type of switch
Next, the usability between two types of switches is discussed. The tracking error of the integrated switch was smaller than that of the non-integrated switch (See Fig.7). The percentage correct of the integrated switch was higher than that of the non-integrated switch (See Fig.10). The reason why the integrated switch was superior to the non-integrated switch can be inferred as follows. As a few switches are gathered together, it is not necessary to look at each switch once the location of integrated switch. Therefore, grouping switches together enables even older adults to concentrate on the main driving simulation task. However, it must be noted that the task completion time of integrated switch is larger than that of non-integrated switch. In spite of enabling drivers to concentrate on main driving task and secondary switch pressing task, the integrated switch seems to take more time to carry out selective movements. Future research should develop the integrated switch so that the slower operation time is improved.
4.3 Location of switch
As shown in Fig.7, the tracking error of the non-integrated switch was worse when it was installed on the front left-side than when it was installed around the steering wheel. The tracking error of the integrated switch was nearly the same for three locations (steering, left-side, and front left-side). In other words, the tracking error of the integrated switch was not affected by the installation location. As mentioned above, we don’t need to look at each switch of the integrated switch once the location of integrated switch. This might lead to the result above. As shown in Fig.10, the installation of non-integrated switch to the left side lead to longer task completion time. Such an installation of non-integrated switch is not recommended.
4.4 Quantity of display information
As for the quantity of display information, this must be an important design factor. For the low quantity of display information, even older adults could carry out the
task with the same performance as young adults. This might mean that such quantity of display information is desirable from the viewpoint of universal design.
References
[1] Noy.Y.A., Human factors in modern traffic systems, Ergonomics, 40, 1016-1024, 1997.
[2] Wickens.C.D., Sandry.D.L., & Vidulich.M., Compatibility and resource competition between modalities of input, central processing, and output, Human Factors, 25, 227-248, 1983. [3] Lambel.D., Kauranen.T., Laakso.M., and Summala.H., Cognitive load and detection thresholds in car following situations:safety implications for using mobile (cellular) telephones while driving, Accident Analysis and Prevention, 31, 617-623, 1999.
[4] Lambel.D., Laakso.M., and Summala.H., Detection thresholds in car following situations and peripheral vision: implications for positioning of visually demanding in-car displays, Ergonomics, 42, 807-815, 1999.
[5] Waller.P.F. and Green.P.A., Human factors in transportation, In G.Salvendy (eds), Handbook of Human Factors and Ergonomics, John Wiley & Sons, Inc, New York: NY, 1972-2009, 1997.
[6] Makiguchi.M., Tokunaga, H.,Kanamori, H., A human factors study of switches installed on automotive steering wheel, JSAE Review, 24, 341-346, 2003.
[7] Wierwille.W.W., Visual and manual demands of in-car controls and displays, in B.Peacock and W.Karwowski (eds), Automotive Ergonomics, Taylor & Francis, London, 299-320, 1993.
[8] Murata.A. and Moriwaka.M., Ergonomics of Steering Wheel Mounted Switch -How Number of Arrangement of Steering Wheel Mounted Switches Interactively Affects Performance-, International Journal of Industrial Ergonomics, 35, 1011-1020, 2005.
[9] McCormick.E.J. and Sanders.M.S., Human Factors in Engineering and Design, McGrawHill, 1987.
[10] Wickman,A.S., Nieminen.T. and Sammala.H., Driving experience and time-sharing during in-car tasks on road of different width, Ergonomics, 41, 358-372, 1998.
[11] Murata.A. and Moriwaka.M., Applicability of location compatibility to the arrangement of display and control in human-vehicle systems: Comparison between young and older adults, Ergonomics, 50(1), 1-13, 2007.
[12] Dukic.T, Hanson.L., Holmqvist.K., and Waternberg.C., Effect of button location on driver’s visual behavior and safety perception, Ergonomics, 48(5), 399-410, 2005.
[13] Dukic.T., Hanson.L., and Falkmer.T., Effect of drivers’ age and push button locations on visual time off road, steering wheel deviation and safety perception, Ergonomics, 49(1), 78-92, 2006.
[14] Goggin, N.L., Stelmach, G.E., and Amrhein, P.C. Effects of age on motor preparation and restructuring, Bulletin of the Psychonomic Society, 27, 199-202, 1989.
[15] Goggin, N.L., and Stelmach, G.E., Age-related differences in kinematic analysis of perceptual movements, Canadian Journal on Aging, 9, 371-385, 1990.
[16] Stelmach, G.E. and Nahom, A., The effects of age on driving skill cognitive-motor capabilities, in B.Peacock and W.Karwowski(eds), Automotive Ergonomics, Taylor & Francis, London, 219-233, 1993.
[17] Imbeau, D., Wierwille, W.W., and Beauchamp, Y., Age, display design and driving performance, in B.Peacock and W.Karwowski (eds), Automotive Ergonomics, Taylor & Francis, London, 339-355, 1993.
[18] Smith, D.B.D., Meshkait, N., and Robertson, M.M., The older driver and passenger, in B.Peacock and W.Karwowski (eds), Automotive Ergonomics, Taylor & Francis, London, 453-467, 1993.