Author(s)
ZHANG, Xuejun; LI, Wenguang; FUJITA, Hiroshi;
KANEMATSU, Masayuki; HARA, Takeshi; ZHOU, Xiangrong;
KONDO, Hiroshi; HOSHI, Hiroaki
Citation
[IEICE transactions on information and systems] vol.[87] no.[8]
p.[2138]-[2147]
Issue Date
2004-08-01
Rights
copyright 2004 IEICE
Version
出版社版 (publisher version) postprint
URL
http://hdl.handle.net/20.500.12099/31797
IEICETRANS.tNF,&SYST.,VOL.E87-D,NO.SAUGUST?Oe4 213S
RAPER
Automatic
Segmentation
of
Hepatic
Tissue
and
3D
of
Cirrhosis
in
Multi-Detector
Row
CT
Scans
and
Volume
Analysis
MR
Imaging
Xuejun
ZHANGta),
Wenguang
LIt,
IVbnmembers,
Hiroshi
FUJIIAt't',
Mbmber,
Masayuki
KANEMI\TSU'1''H',
IVonmember,
[[hkeshi
IIARAV,
Xiangrong
ZHOUV,
Members,
Hiroshi
KONDO'b'H',
and
Hiroaki
HOSHI'tt,
Nonmembers
SUMMARY
Theen!argemelltefthe}eftlebeoftheliverandtheshrink-age of
the
rightlobe
arehelpful
signs atMR
imaging
in
diagnesis
ot' cir-rhosis oftheljver.
To
investigate
whether thevolume ratioofleft-to-whole
(LJI]W)
is
effective todifferentiate
cirrhosisfrom
anorma]liver,
we deve]-eped an automutic ulgorithrnfor
three-dimensional(3D)
segmentution andvolume calculationof
the
liver
regionin
multi-detector rowCT
scans andMR
imaging,
From
one manually sclected slicethat
contains a1arge
}iver
area,
two
edge operators are applied toobtain theinilial
liver
area,frorn
which
the
meangray
valueis
calculuted asthreshold vttluein
orderto
etim-inate
the
conneeted organs or tissues.The
final
contouris
re-confirmedby
using
thresholding
technique,The
liver
regienin
the
next sliceis
generated
by
referring tothe resu]tfrom
the
]ast
slice.After
continuousprocedure
of
this
segrnentution on each stice, the3D
]iver
is
reconstructedfrom
al1
the
extractedslicesandthe
surfaeeimage
canbe
displayed
from
different
viewpointsbyusingthevolurnerenderingtechnique.Theliveristhensep-arated
into
the
]eft
and therightlobe
by
drawjng
aninter-segmenta}
plune
manually, and thevo]umein
eachpart
is
calculated sliceby
slice.The
de-gree
of cirrhosis canbe
defined
asthe
ratie of vo]umein
thesetwo
lobes,
Four
casesincTuding
norma] and cirrhoticliver
withMR
andCT
slices areused
fer
3D
segmentation and vjsualization.The
volume ratioofLTW
wasrelatively
higher
in
cirrhosis thanin
thenormal casesin
both
MR
andCT
cases.
The
ttverageerrorrateenliver
segmentation was within5,6%
after
emp]oying
in
30
MR
cases.These
resultsdernonstrate
thattheperforrnance
in
ellr3D
segmentation was satisfied and theIJI/W
ratiu maybe
effective todifferentiatecirrhosis.
kay
words:MR
imaging,
iiveny
cirrhosis, image segmentativfi, c'ontourdetection
1.
Introduction
Cirrhesis
of
the
liver
is
a
late
stage
of
progressive
liver
dis-ease
defined
as structuraldistortion
of
entire
1iver
by
fibrosis
and
parenchymal
nodules.Early
diagnosis
is
critical
in
cir-rhosis
to
establish
the
cause ofthe
disease
andto
determine
the
amountof
existing
Iiver
damage.
Although
there
is
no effectivetreatment
for
decompensate
or
advanced
cirrhosis,
interferon
therapy
is
sometimesbeneficial
for
early
cirrho-sis associated with viral
hepatitis[11.
Therefbre,
the
ear]ydetection
of cirrhosis mayhelp
determine
proper
treatment
in
patients
with
this
clisease.
1[Ihe
diagnosis
of cirrhosisis
ManuscriptreceivedAugust25,2003,
Manuscript
revisedJunuary
30,
2004.
ri'The authors are with
the
Electronics
andInformation
Systems
Engineering
Division,
Graduate
School
ofEngineering,
Gifu
Uni-versity,Gifu-shi,
501-1
193
Japan.
"'kThe
authors are with
the
Department
ofIntelligent
Image
In-formation,
Divjsion
ofRegeneration
andAdvanced
Medical
Sci-ences,
Graduate
Scheot
ofMedjcine,
Gifu
University,
Gjfu-shi,
501-lt94Japan.
tttThe authors
are with
the
Department
ofRadiology,
Gifu
Uni-versity
School
ofMedicine,
Gifu-shi,
501-1194
Japan.
a)
E-mail;
[email protected]carried
out
by
physical
inspections,
serological
tests,
radi-ologic
imaging
(computed
tomography
[CT],
magnetic
res-onance
imaging
[MRI],
scintigraphy, or ultrasonography),liver
biopsy,
or
a
combination.As
the
liver
parenchyma
re-generate
after
hepatocyte
necrosis,
fibrosis
of a variety ofdegree
develops
throughout
the
liver
and
cause
gross
distor-tion
in
configurationto
the
liver
[2],
[3].
Morphologic
analy-sis
is
regarded as animportant
and usefu1tool
to
differentiate
cirrhosis
from
a normalliver.
Many
effortshave
been
done
by
investigating
hepatic
morphologic changes onimaging,
such asCZ
MRI
and ultrasonography.Changes
in
liver
vol-umepredicts
the
prognosis
ofpatients
withcirrhosis,
but
the
measurernent needs
quantitative,
reproducible methods,that
can
be
achieved
only
by
imaging
techniques,
Classically,
physical
examinations
performed
by
percussion
andpalpa-tion
showed
that
the
difference
between
actua]
liver
volume andthe
valuepredicted
by
liver
span was1arge
[4],
Sahin
et al.[5]
estimatedthe
liver
volumeby
the
Cavalieri
princi-ple
using
MRI.
McNeal
et
al.
r6]
investigated
a methodfor
measuringthe
volumes
of
human
livers
in
vivofrom
MRI
and subsequentlydisplaying
these
livers
in
three
dimen-sions.These
resultsindicated
that
both
processing
meth-ods
had
ahigh
degree
of vo]ume-measuring accuracy.How-eyer,
cirrhoticlivers
only slightly reducein
sizecompared
with
heal
thy
1ivers
when
enlargement
of
the
left
hepatic
lobe
and shrinkage of
the
righthepatic
lobe
take
place
in
cirrho-sis.The
wholeliver
volume could notproyide
significantvalue
in
the
diagnosis
of cirrhosis.Awaya
et al.[7]mea-sured
caudate-right
lobe
(CfRL)
ratio with use ofthe
rightportal
veinto
overcomethe
above
mentioned
problem.
The
diagnostlc
accuracyis
notyet
satisfied
due
to
the
result onlyfrom
one
2D
MR
image.
In
this
paper,
we
propose
anovelmethod
to
quantitatively
calculatethe
degree
of
cirrhosis
from
extractedthree-dimensional
(3D)
liver
based
onvol-ume
analysis,
A
numberof
groups
have
developed
techniques
fOr
the
purpose
of segmentation ofthe
abdominal organs onCT
images,
but
there
are no reports onMR
images,
as
far
as weknow.
Bae
et
al.
[8]
used athreshoding
methodto
seg-ment
the
liver
in
living-donor
abdorninalCT
images.
In
this
method,a
gray-Ievel
threshold
wascletermined
from
the
histogram,
therefore
the
segmentationwould
be
affectedby
other connectedorgans
ortissues
withthe
overlap den-sity.Park
et
al.
[9]
presented
their
methodto
construct aprobabilistic
atlasof
an
abdomen
consisting offour
organs.ZHANG etal./AUTOMMIC SEGMENnmTON
OF
HEIIrtI/ICTISSUE AND3D
VOLUME
ANAI:YSIS
OF
CIRRHOSIS
2139
was
obtained
even
with
noncontrast
CT
scans.
However,
manually
putting
17
controlpoints
and selecting referencepatient
makeit
impractical
in
our cirrhotic study, sincethe
morphology
change
in
cirrhosis
is
verylarge
and
the
atlas
is
hard
to
be
constructedproperly.
Masumoto
etal.
[10]
devel-opedtheir
methodby
usingtwo
different
phase
images
onthe
liver
region,
The
liyer
wasenhanced
effectively
to
raise
the
accuracy
of
segmentation,
but
meanwhile
increased
the
complicacy of routine.
Furthermore,
this
method could notbe
extendedto
the
MR
imaging,
In
this
paper,
wepropose
an automatic method offind-ing
the
initial
liver
centour
and
calculating
the
gray-level
thresho]d
yalue
to
reconfirm
the
final
region,
2.
Method
2,1
ImageDataCollection
Thirty
patients
underwent
MR
imaging
with
a
1.5-T
super-conducting
magnet
(Signa
Horizon;
GE
Medical
Systems,
Milwaukee,
W{s.),
The
gadolinium-enhanced
gradient-recalled-echo
portal
venousimages
were obtained using aphased-array
body
multi-coil withthe
fo11owing
settings:
echo
time
(TE)
1.6ms,
repetitiontime
(TR)
150ms,
flip
an-gle
900,
matrix512
×512,
26-second
breath-hold
acquisi-tion.
Images
were obtained after an antecubita1intravenous
bolus
iajection
ofO.1
mmolfkgof
gadopentetate
dimeglu-mine
(Gd-DTPA)
(Magnevist;
Schering
AG,
Berlin,
Ger-many)
followed
by
15
ml of sterile saline solutionflushed.
The
scan
timing
was60
seconds afterinitiating
the
contrastiajection.
The
presence
of cirrhosis was confirmedby
two
experienced
radiologist
(H.K.,
M.K.)
in
the
30
patients
in-cluding
15
patients
with
cirrhosis
and
15
without.
From
all
of
the
MR
images
in
each
case,
weselected
one
gadolinium-enhanced
late-phase
MR
image
depicting
the
1argest
liver
area.The
liver
contours were manuallytraced
by
the
radi-ologists
for
the
establishment
of
standard-ofreference
liver
contours
for
programming.
The
30
cases
(each
onlycon-tains
one
2D
slice)
were
selectedfor
segmentingliver
re-gion
and4
casesincluding
normal and cirrhosisliver
with
multi-slices
both
in
MR
andCT
images
were
used
fbr
3D
segmentation and visualization.
The
CT
images
wereac-quired
using
a
helical
CT
scanner(LightSpeed
Ultra;
GE
Medical
Systems),
with
parameters:
tube
voltage120kV
tube
current300
mA, slicethickness
1.25
mm
and
exposure
time
554
ms.2.2
Tlie
Liver
Structure
and
Its
Segments
TTie
liver
is
oneof
the
biggest
organsin
human
body.
Be-cause
of
its
special supply systemby
two
types
of
yeins
(hepatic
andportal
veins),the
couinaud
classification
is
widely
accepted
as
a
criterion
that
divides
the
liver
into
8
independent
segmentsfor
the
purpose
of
resections.
Fig-ure
1
(a)
shows
that
the
right
hepatic
vein(RHV),
the
mid-dle
hepatic
vein(MHV),
the
left
hepatic
vein
(LHV)
andInferier
Vena
Caya
Right
Gallbl(Gb)
(a)
Left
(b)
Fig.1
An
anatomicalfigure
illustrates
{a)
thecouinaudliver
segrnents,and
(b}
its
MR
images
areshownbelow,
the
portal
vein(PV)
withgallbladder
plane
provide
the
reg erencesfor
separatingthe
liver
segments.From
the
MR
images
shownin
Fig,1(b),
we can noticethat
the
inferior
vena
cava
(IVC)
is
passed
through
the
segmentI(the
cau-date
lobe)
near
aorta,
and
gallbladder
always
locates
in
seg-mentIV
(the
quadrate
lobe).
These
anatomicalknowledge
mayhelp
usto
extractthe
liver
region and separateit
for
cirrhosis calculation.In
our study, wedefine
the
segment
II
and
segment
III
as
the
left
hepatic
lobe.
Other
segments
belong
to
the
right
hepatic
lobe,
eventhough
the
segmentIV
is
regardedas
medialleft
lobe
by
anatomists.2.3
SegmentationofLiverRegion
We
developed
an
algorithm
for
segmentation
ofthe
liver
region
from
other organs andtissues
onthe
portal
venousphase
images.
[Pwo
edge operatorsare
applied
to
obtain
the
initial
liver
area,from
which
the
mean
gray
valueis
calcu-lated
as
threshold
value.The
final
contouris
re-detectedby
using
thresholding
technique,
As
shownin
Fig.2,
our
method consists
of
three
main
steps:
I.
Preprocessing
stepto
diminish
and
smooth
the
original
image;
II.
Extracting
step
to
obtain
the
initial
liver
contourby
edge operators;III.
Re-detecting
stepto
confirmthe
final
liver
region.
(a)
Preprocessing
Ilie
purpose
ofthe
preprocessing
step
is
to
unifythe
MR
images
into
a
standard
cendition,
in
whichthe
position
and
size
ofthe
liver
area are relativelythe
same,
as
well as some reference objectslike
aorta.
The
contour
of abdominalbody
is
firstly
extractedby
thresholding
method,
as
this
part
is
ob-viouslybrighter
than
its
black
background.
The
charactersand numbers on
MR
images
canbe
eliminatedcompletely
and
the
ROIs
only containmaximal
size
of abdominalJEICETRANS,
TNE
&
SYST.
VOL.E87-D.
NO.8 AUGVST ?O042t40
is
appliedfor
reducingthe
effect of noise, meanwhileen-larging
the
width ofliver
edge.Finally,
to
ayoidtoo
manylabeling
numbersand
misseddetection
ofthe
aorta andthe
liver
location,
the
size
of
image
is
limited
to
a
range
around
200
to
280
pixels
widthby
diminishing
with
a
proper
ratio
according
to
the
size ofROI.
(b)
Edge
detection
by
combination
ofSobel
andLOG
filters
When
applyingthe
thresholding
technique
to
separate
the
object
from
background,
it
is
diMcult
to:
1)
determine
a
proper
threshold
value
and
2)
distinguish
the
connected
or-gans
or
tissues
that
sometimes
show
reiatively
high
or
low
intensities
to
the
liver
region,for
example,
the
kidney
or
the
stomach.
Human
can easily recognizethe
liver
from
MR
images
not onlybecause
ofits
big
size,but
alsoits
ditfer-entintensity
from
the
other components,that
is
especially obvious atthe
edge
of
a
liver.
Therefbre,
our
strategy
is
to
first
focus
onthe
edgeinformation.
Figure
3(a)
shows
an
MR
image
l(x,y)
with a cirrhoticliver.
We
should noticethat
the
liver
region
consists
of
the
hepatic
tissues
and white vessels.If
apixel
fa11s
onthe
boundary
of an objectin
animage,
then
its
neighborhood willbe
a zone ofgray-level
transition.
Our
first
edgedetector
is
the
Sobel
filter,
whichis
based
upon convolution with aneight-directional
3
×3
derivative
mask as shown
in
Fig.
4.
The
output of eachpixel
is
to
select
one
of
the
largest
values among8
directions
after applyingthe
Sobel
masks.
The
benefit
of
this
filter
is
that
we can obtain strong edges atanydirection
since
the
liver
contouris
closed.The
output shownin
Fig.
3
(b)
is
an edge magnitudeimage,
The
Laplacian-ofiGaussian
(LOG)
operator, whichhas
been
suggested
by
Marr
and
Hildreth
[11]
whilst studyingthe
human
visual,is
regardedas
one
of
the
best
edge
de-tectors.
By
combiningthe
Sobel
andLOG
filters,
we canextract
the
subtle
edgesthat
shouldbe
missedby
each ofthe
individual
methods(in
order
to
make
an
obvious
ef-fect,
Fig.5
uses anartificial
pattern
instead
of
a
real
liver).
The
Laplacian
is
often appliedto
an
image
that
has
first
been
smoothed
with aGaussian
smoothingfilter
in
orderto
reduce
its
sensitivityto
noise.The
image
J(x,y)
is
first
smoothed withGaussian
filter,
that
its
2-D
responsefunc-tion
canbe
given
by
:mtttt-tttt/tttt-tttt-ttt-tttt-ttttt-ttttttttLttttt-ttttttttttLtttt-t"t-t.ttHttt llil
I
l
:
{./..mI
IIII[I/
Readirrgimage
Pre'processutg
I
tttttt-ttttttttttttttttttttt-ttttttttttHtttttt-d
'
IIIIIl
AortadetectioniilLabelingconnectivity
IigIlllExtiactinglivercandidate
Calculatingmean
yalueasthresholdIII
lllill・lllllIFillmginholes
-L
-t
Re-detection
Finallivercontour
tt/ttttHtttttttttttttPttttHttttrettttHtttt-ttttt-ttttt-ttttt"ttttttt-ttt-tttt
ii
I
l
l
Edgedetection
I
ii
:
l
l
l
l
:
:
I
I
l
E
t" jFig.2
Overa]1
fiowchart
of segmentationin
a slice containingbiggest
liverregion,
G(x,
y)
=2n16?
exp(-X2ii2'V2)
Then
sharpen
it
with aLaplacian
differential
operator:f(x,y)
=V?{G(x,y)
×I(x,
y)}
=
V?{G(x,y)}
×i(x,y)
2164
[(
X26+2Y?
-2)
exp
(-
X2i6i(1)
2)1 ×i(x,
y)
(2)
[!!]g[!l]
[!!I[Ql'I]
[!]M[l]
1'!1,Ilg]iil
[ot[ofE
b[otz
[ot[of[.a.
i[ott
[ml
gug[
]m]
[[ojE
(a)
fo)
(c)
(d)
[l!]!i][.Z]
M[i][il]
[il][l][2]
Rl[alto]
E][otg]
i][otg
['Lel'
[il[l]
n[otl
i][]Lot
torlg
gm[ot
k][aE]
(e)
(b
(g)
th)
Fig.
4
(a)-(h)
represent eight-directional3
x3
derivative
masks ofSobel
filteT,
./ttdigaseefis,aseeeeevageeth
.
ma fi w(a)
(b)
{c)
Fig.
3
(a>
Preprocessed
image
I(x,y)derived
by
smoothing anddiminishing
from
uriginalMR
image.
ZHANG
etal.:
AUTOMrmC
SEGMENmmON
OF
HEPrtVIC
TTSSUE AND 3D VOLUME ANAL;YSISOF
CIRRHOSIS
2141
The
zero crossingdetector
looks
fOr
places
in
the
Laplacian
of animage
wherethe
value ofthe
Laplacian
passes
through
zero-points wherethe
Laplacian
changes sign,Such
points
often occur at edgesin
images.
Zero
crossings
always
lie
on
the
closed
contours,
and
so
the
out-put
from
the
zero
crossing
detector
is
usually
a
binary
image
with
single
pixel
thickness
lines
showing
the
positions
of
the
zero crosslng
polnts,
Figure
3
(c)
showsthe
outputimage
afterimplementing
LOG
operator
to
the
magnimde
image
derived
from
Sobel
filter
(b),
where
one
edge
line
on
Sobel
image
corresponds
to
two
parallel
edge
lines
onLOG
image.
All
the
connectedtaggings
below
3
points
are eliminated as noise.After
edgedetection,
the
inside
hepatic
tissues
areturned
into
black
and
only remains aclosed contour
along
liver
surface
as shownin
Fig.
3
(c).
T[he
main
idea
of
picking
up
liver
regionis
to
describe
a closed contourthat
can noosethe
black
liver
region.[[here-fore,
it
wM causetroubles
if
this
boundary
is
not closed.Thickening
eachpoint
canbe
helpful
to
reduce
such
prob-lem
[Fig.
6
(a)].
In
our
program,
4
neighborpoints
areex-panded
if
a
point
is
white
in
Fig.
3
(c).
(c)
Selecting
the
initial
liver
regionThe
aortais
an
important
reference
coordinate
fbr
its
posi-tion
that
always
locates
onthe
under-right side ofliver
nearthe
caudate
lobe,
andit
indicates
high
intensity
with acircleshape,
The
aorta canbe
fOund
by
the
fo1]owing
3
features:
circularity, area and
position.
All
centroids
of
connectivity
are calculated
from
labels,
and
circularity
ecan
be
defined
as
S21S
1,
whereS
1
is
the
area of onelabel,
whileS2
is
the
mb
elin
de
as
th
as
as
'X
.m.. eseeasmpee・eeweem ma.mag:asee:
utde: as:gl:evees$'um'-"
<a)
(b)
(c>
{d}
Fig.5
An
simulationimage
(a)
has
as]ightblock
(arrows)
crossingthe
image
pattern.
Results
derived
from
app]yingSobel
filter
only(b),
LOG
filter
only(c),
andSobel+LOG
filter
(d)
indicate
that
combination oftwofilters
may extractvery subtteedge ratherthan
usethem
individually.
common
area
of
S
1
and
a
circle
with
the
same
area
as
S
1
on
the
centroid ofthis
label.
The
sizeof
aorta
is
oftenbetween
30-60
pixels
accordingto
the
image
sizein
our experiment, andits
position
locates
on nearbymiddle
of
abdominal
body,
Therefore,
if
labeled
connectivity
satisfied withthe
condi-tion
of
area
and
position
features,
we can selecttwo
candi-dates
withhighest
e
valueidentified
withthe
aorta andthe
IVC.
Since
the
aortaalways
locates
onthe
right
side
of
the
IVC,
ourprogram
can robustly selectthe
aorta
referring
to
this
anatomical
criterion.
The
liyer
and
the
background
re-gion
have
biggest
areain
allthe
connected whitepixels,
but
the
position
ofthese
two
areasis
quite
different,
The
liyer
candidatecould
be
found
out
among
all
the
labeled
white
components
by
maximum
area
except
for
the
background
and
by
refeningto
information
oflocation
(on
the
Ieft
side ofMRI
and upper-left side ofthe
aorta).Figure
6
(b)
illus-trates
a selectedliver
structure,The
extractedliver
area
only
contains
hepatic
tissues
without
other
organ
stmctures
or
vessels
inside
that
may
change
the
value
of
calculating
liver
intensity
if
being
in-cluded.
This
is
due
to
the
fact
that
edgedetector
only con-cerns aboutdifferent
intensity
between
them,
no matter whatthe
explicit
number
is.
The
conventional
thresholding
tech-nique
is
hard
to
solve
this
problem
because
there
are
differ-ent
kinds
of
non-hepatic
structures
that
shouldbe
darker
orbrighter
than
liver
area,Wk}
can calculatethe
meanintensity
ofthe
liver
G.,,
by:
Gavr
=i
Z
I(X,Y)・
(x,),)ER
(3)
where
R
is
the
specified
liver
region shownin
Fig.
6
(b),
andn
is
the
numberof
pixels
withinthe
region.(d)
Re-detection
by
thresholding
technique
If
the
contour
is
not
completely
closed,
undesired
parts
will
connect
to
the
liver
region[Fig.
6
(b)].
The
main reason ofthis
occasionis
that
the
edgebetween
the
liver
andtissues
is
indistinct,
However,
in
many casesthe
intensity
between
these
two
stmctures
is
various,
that
makesit
possible
to
use
thresholding
technique
fbr
component
decomposition.
Holes
inside
the
initial
area arefi11ed
in
so asto
make
a
mask
of
the
initial
liver
regionMi.i(x,y)
as
shown
in
Fig.6(c),
tVvaWdepm
.,.gwgee-
ptk
ge
(a)
(b)
(c)
Fig.6
Thickened
image
(a)
enlarges everydetected
edge to makeliver
contour closed asmuch aspossible.
Liver
stmcture(b)
canbe
se}ectedfrom
allthe
labeled
black
area,in
whichthe
inside
holes
arefi11ed
to
make the mask ofinitial
liver
(c),
After
readinggray
valuesfrom
preprocessed
image
in
Fig.
2(a),
restrictedcontouTirnage
(d)
defined
asl'(cr,y)
is
derived
tobe
calculated meangray
value asthethreshold value
in
re-detection step.IEICETRANS.INF.&SYST.,VOL.Eg7-D,NO.8AUGUST2004
2142
from
whichwe
may
obtain
a
contour
restricted
gray-value
image
I'(x,
),)
=I(x,y)
×Mi.i(x,y)
as shownin
Fig,6(d),
Although
the
connectedparts
have
some affection on cal-culatingthe
average
value
of
liver,
considering
ofthe
1arge
area of
liver,
these
affections
may
be
ignored.
Livers
on
MR
image
often
appear
to
be
heterogeneous
in
different
part.
The
intensities
nearthe
abdominalsur-face
wherethe
coins areplaced
indicate
high
valuecom-pared
with
those
inside
the
deep
human
body.
Thus
onthe
2-D
MR
image,
the
liver
shows
brighter
on
the
upper
side
than
lower
side.Therefore,
we applytwo
threshoLd
values
G.p
and
Gi..,
onI(x,y)
to
reconfirrnthe
upper andlower
side
liver,
The
average
standarddeviation
of aliver
regionis
within
the
gray
value of10
in
apre-processed
8-bit
im-age, andthe
difference
of
intensity
between
the
upper
and
the
lower
side ofliver
is
around20.
In
our
experiment,
we
empirically
select
G.p
=G.v.
-
10
andGtow
--
Gavr
r
30,
respectively.
Because
of
the
high
threshold
value, upperside
re-detection
may
erode
the
different
surrounding con-nections without affecting onthe
lower
sideliver.
After
la-beling
the
binary
image
gained
by
threshold
G.p,
the
liver
is
picked
up as maskMup(x,.v)
and compare withthe
for-mer maskMi.i(x,y),
a
new
upper
side
mask canbe
given
by
M;,n(x,
y)
=uap
(x,
y)
n
Ml・ni(x,
y).
Using
the
lower
threshold
Giov.
may cause undesired reconnectionon
the
upper side, our method of re-detectionthe
lower
sideliver
is
limited
in
the
region
of underthe
line
L,.
As
the
aorta always closesto
andparallels
with
the
IVC
passed
through
liver
segmentI,
drawing
aline
between
the
center
of
aOrta
(xaerta,Yaenta)
and
the
minimum coordinateof
the
abdominal
wall canro-bustly
separatethe
liver
region nearthe
coilfrom
the
deep
parts.
L,
can
be
formulated
by
y
=tvaortalxaorta)x・
A
re-confirmedlower
side maskcan
be
expressed
as
Ml..(x,
y)
=Miv,v(x,y)
n
Mini(x,y).
The
final
]iver
mask
is
calculated
from:Miiver(X,Y)
=
Map(X:Y)
+
M;..(X,
Y)
+Mherta(X,Y),
(4)
whereMaorfa(x,
y)
is
the
mask
re-detected
from
areabetween
aorta
and
the
bottom
of upper side as shownin
Fig,
7.
The
final
liver
contour
is
shown
in
Fig.
8.
Not
like
MR
imaging,
the
intensity
distribution
of aliver
region
in
CT
images
is
homogenous,
therefbre
in
the
re-detection step, oniy one
threshold
valueG..,
is
applied
to
re-confirming
the
final
contourin
CT
images.
-
Ls
.Vlcnd・'fx
Lo-'er
liide rFig.7
Re-detection
of upper andlewer
side of)iver,
Initiat
liver
LFig.6(u)]
is
re-detectedby
thresholding method,The
black
regionis
the collfirmedprecise
liver,
and thegruy
parts
areeliminated connections.(e)
Evaluation
ofthe
perfbrmance
[Ib
evaluate
the
segmentation
perfbrmance,
the
gold
stan-dards
of
the
liver
contour
were
drawn
by
an
experienced
ra-diologist
as
shownin
Fig.
9
(a).
Area
within
this
contour
was ealculated asAg.td.
By
cemparing withthe
area ofdetected
liver
regionAd,,
shownin
Fig,
9
(b),
error canbe
defined
asthe
ratio
of
different
liver
area
A...
between
reference anddetection
divided
by
the
reference
liver
area.
A,,r
canbe
calculatedby
XOR
operationon
the
masks
of
gold
standard
and
the
detected
liver
region:Aerr
=Agotd
O
Adet・
2,4
3DSegmentationandVisualization
The
above algorithmis
modifiedto
be
able
to
extract
a
small
liver
regionby
usingthe
resultfrom
the
last
slice.
Because
the
interval
of
MR
slicesis
always over5
mm,the
liver
changes
its
shape
great]y
onits
nearby slices.Therefore
our methodis
based
on2D
ratherthan
3D
image
process-ing
techniques,
3D
MR
image
is
constructedfrom
about
25
slices and
the
surfaceimage
canbe
displayed
from
the
dif
ferent
view
points
by
using
the
surface
rendering or volume renderingtechnique.
Figure
lO(a)
and
(b)
show a normalliver
and acirrhosisliver,
respectively.
AIso
this
method may extendto
extractthe
liver
region orother
organs
on
CT
images
as shownin
Fig.
1O(c)
andFig.
1O
(d).
2.5
Calculating
the
Degree
ofCirrhosis
Lobar
or segmental changesof
hepatic
morphology
are
common
appearances
seenin
advanced cirrhosis.These
ap-pearances
typically
include
atrophy
ofthe
right
hepatic
lobe
andthe
left
medial segmentand
enlargement
of
the
cau-date
lobe
andthe
left
lateral
segment,The
ratio
between
the
transverse
width ofthe
caudatelobe
and
the
right
lobe
can
be
used
fbr
differentiating
normalfrom
advanced cir-rhoticlivers
[7].
However,
this
ratiodoes
nothelp
to
identify
the
presence
or absenceof
early
cirrhosis.Furthermore,
the
liver
often changesits
shapein
different
sleeping
postures,
and
the
ratio maybe
changedin
different
inspection
time
only usingone
2D
slice.
3D
imaging
can solvethis
problem,
since volume
is
the
same
no
matter
how
the
shapeis
var-ied.
The
liver
is
separatedinto
left
and
right
lobe
by
draw-Fig.8
the
black
line
described
is
the
extracted]iver
contour, which seems tobe
smallerthan
thereatliver
because
ofthe
absentpixels
ZHANGetal,:AUTOMrtrlCSEGMENTATIONOFHEouICTISSUEAND3DVOLUMEANALYSISOFCIRRHOSIS
2143
etwes t va"・・t・
es s・ .1."
ta'
ma・mu$ee.pt
tsew.-7,・fp..uaigdipt
'
tls
(a)
(b)
Fig,9
AnexampleofcirrhosiscaseimagewithalivercontourdTawnbyanexperiencedradiolegistin
(a)
as thereferenceliver
contour.(b)
is
theresult efliver
contourdrawn
by
our segmentationprogram,
Error
image
(c)
shows thedifference
between
detected
anddesired
images,
(c)
eemp
(a)
(b)
(c)
(d)
Fig
10
Livers
constructedby
extracted2D
liver
regionsfrorn
MR
imttges
with a sliceinterval
of5
mmindicate
thatthe volume ratiosbetween
left
andright
side ofliver
aredifferent
in
anormal case(a)
andcirrhosiscase(b),
(c)
Livers
constructedfrom
CT
images
with asliceinterval
of1
.2S
mm.(d)
Liver,
aorta,costa and spineareextracted
from
CT
images
by
using our same edgedetection
based
methoddeveloped
for
MR
images.
{a)
{b)
tsrter-seftinolrtal
'
hile
e
(c)
(d)
Fig.
11
Inter-segmentat
tine
(white)
canbe
drawn
by
twoljnes
in
(a)
and(b)
sLices rnanually.(c)
Segments
II
andI"
aremainlyincluded
in
the
areathat
separatedby
the
twolines.
(d>
showsthe
segmented resultin
3D.
ing
an
inter-segmental
line
that
is
decided
by
two
straight
line
in
Fig,11(a)
and(b),
respectively.In
our
experiment,
selecting
these
two
slicesis
manuallyfeasible
because
our
prograrn
does
not
contain
the
function
onliver
shape
anal-ysis,
and
the
classification ofthe
liver
segments
needsto
extractthe
hepatic
and
portal
veins accurately,[[b
draw
the
line
in
Fig.
11
(a),
a slice with segmentII
obviously
sepa-rated
from
the
right
side
ofthe
liver
is
selected.Another
sliceis
chosen
if
the
bifurcation
ofthe
main
portal
vein canbe
seen
as
in
Fig.11(b).
These
procedures
are relativelyeasier
jobs
by
doctors
than
computer, andthe
consistency ofdrawing
the
inter-segmental
line
by
different
radiologists
is
veryhigh,
The
inter-segmental
line
mainly
divided
liver
region
into
segments
II
and
III
and
other
parts
as shownin
Fig.11
(c)
and a real resultin
this
caseis
displayed
by
3D
image
asin
Fig,
11
(d).
The
volume(V)
in
each
part
is
cal-culated slice
by
slice.The
degree
of
cirrhosisis
defined
as ratioof
LTW
=Vlqft1(V}"ight
+vaqf}).
2.6
SoftwareandHardwareofOurScheme
We
implement
a
prototype
tool
usingVisual
C++
within
WindowsXP
running on aPC
(Pentium
M
1GHz
with
512MB
RAM),
The
graphic
userinterface
of our softwareis
consistsof
an
image
window,
the
folder
andfile
boxes,
toolbox
and
information
windows
as shownin
Fig.
12
(a),
The
current vision of ourprogram
supports
DICOM,
BMP
or raw
data
file
formats.
Image
files
canbe
selected anddis-played
just
by
clicking
the
file
namefrom
the
folder
andthe
file
boxes,
The
radiologistsare
able
to
zoornthe
image
andinteractively
change
the
contrast andbrightness
ofthe
dis-played
images
accordingto
their
preference,
Once
a caseis
confirmed anda
slice
with
1argest
liyer
regionis
selected,
the
radiologist may
press
the
"segmentation"button
to
waitthe
result of
liver
coming
out.The
processing
time
in
one
sliceTETCE
TRANS.
INF.
&
SYST.,VOLE877D,NO.8AUGUST2004
2144
<a)
(b)
Fig,
12
{a)
is
theuserinterface
thatenab]esdoctors
to segmentliver
region; calculateliver
area;viewslices sequentiatty: edit
pictures
ormakeinter-segmental
line,
(b)
shows of a3D
]iveT
visualizedby
surfacerendering and
its
Tesu]ts containingIJI/W
ratioin
amessagebox.
5
mm, segmentationof
the
Iiver
region
averagely
costs54
to
90
seconds.In
aCT
case
with
a
slice
interval
of
1.25
mm,the
average
time
is
around2,5
times
than
in
MR.
The
sur-face
rendering
and
volume renderingtechniques
are usedin
the
3D
visualization
preference
study.Construction
ofa3D
surfaceimage
oftentakes
1O
to
20
seconds
before
the
user may viewthe
liver
freely
by
rnovingthe
mouse.
Since
the
radiologists can only view
2D
images
by
traditional
MR
and
CT
clevice,
our
software
mayprovide
additional3D
infor-mationto
facilitate
their
daily
interpretation.
For
example,the
whole shape andthe
voiume ofaliver
or even roughnessof
a
1iver
surface wouldbe
helpfu1
to
their
cirrhosis
analysis,
The
volumes
ofliver
orliver
segments can onlybe
measured
from
three-dimensional
images,
as
the
classicalimage
edit-ing
tools
aretime
requestand
impossible
to
be
utilizedin
aclinical
routine.
Tb
calculatethe
volume
ratio
ofI;TW,
the
program
is
asked
the
userto
usethe
"draw"function
button
from
the
toolbox
to
put
two
inter-segmental
lines
fo11ow-ing
the
instruction
shownin
Fig.11(a)
and
(b).
The
final
result
will
be
infbrmed
in
aninformation
message
box
anddisplayed
onthe
image
window as shownin
Fig.
12
(b).
3.
ResultandDiscussion
fable
I
illustrates
the
result ofa
MR
case
in
Fig.3.
Fig-ure
3
(a)
wasderived
from
smoothingand
diminishing
the
eriginal
image.
After
employing
the
Sobel
andthe
LOG
filters,
the
initial
liver
structureshown
in
Fig.6(b)
was selectedfrom
the
dark
labelings
onthe
thickened
image
Fig.6(a).
Two
connected organand
tissues
werelocated
in
the
upper andthe
lower
side ofliver,
respectively.The
average value ofthe
liver
tissue
G..g
was ca]culatedby
adding
allthe
pixel
valuesif
the
correspondingpixel
wasPlack
on
Fig,6(b).
In
this
caseof
8-bit
image,
the
G..g
is
154.
The
first
mask
ofliver
area[Fig.6(c)]
was madeby
filaing
the
holes
in
Fig.
6
(b),
then
the
program
readthe
gray-value
from
Fig.
3
(a)
accordingto
the
mask
and
gave
a contour restrictedimage
[Fig.
6
(d)],
in
whichthree
regions weredefined:
the
upper
side,the
lower
sideand
the
aortalhble1Result
of anMR
casein
Fig.
3.
Item
ContentUnit
Imagedepth
8
bits
ImageSize
512X512pixels
Averagegrayvalue
ofinitialliverGavg)154pixelvalues
GoldareaofIiver
Agold
5I21
pixels
Errorpixels
tt502
tt-points
Errorrate
9.8
o/oProcessingtime
3
secondsarea
[Fig.7].
The
re-detectionprocess
was
undertaken
on eachof
these
regions,An
areathat
was
reconfirmed
aspart
ofliver
willbe
turn
into
black,
andthe
wholeliver
region
was
the
sum ofthe
three
re-detection
components.In
Fig.
7,
black
area
wasthe
finai
detected
liver
region,from
whichwe
can
see
the
two
connected organor
tissues
were
success-fu11y
eliminated
with alight
gray
colorexpressed.
Figure
8
was
the
outlinedliver
contour
described
onthe
originalim-age.
We
may noticethat
the
contour
was notfit
the
liver
edge
well,
this
is
due
to
the
thickening
of edge onFig,
6(a)
maydecrease
someliver
inforrnation
on
the
edge.Error
image
in
Fig.
9
(c)
informs
the
error
pixels
A.,.
with
502
points,
andthe
Iiver
areaAg.td
is
with5121
pixels.
1[Iherefore,
the
errorin
this
examplewas
9.8%
(502!5121).
Among
these
502
pixels,
majority errorpixels
werefrom
liver
edge,
that
implied
the
errorratio
shouldbe
cutdown
by
using additional re-detection step suchas
regiongrowing
to
find
out
the
lost
edgeinformation.
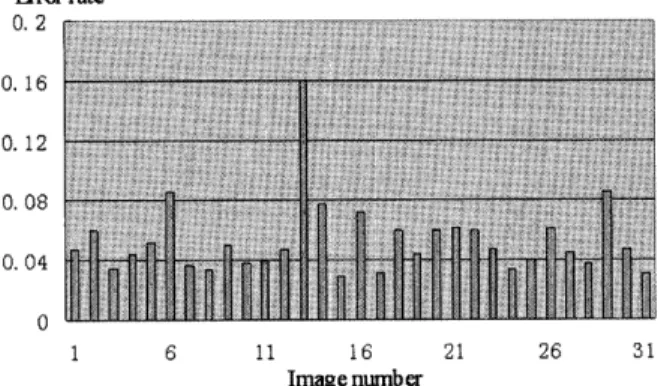
Figure
I3
illustrates
the
resultsof
error
ratesfor
30
MR
images,
in
which some unsuccessfu1 segmented examplesare
mainlywith
stomach
strongly connecting


![Fig, 12 {a) is the user interface that enab]es doctors to segment liver region; calculate liver area; view](https://thumb-ap.123doks.com/thumbv2/123deta/10097682.1497975/8.892.122.804.127.364/fig-interface-doctors-segment-liver-region-calculate-liver.webp)