Title
Serum Growth Hormone and Insulin-Like Growth Factor-1
Concentrations in Japanese Black Cattle with Renal Tubular
Dysplasia(Internal Medicine)( 本文(Fulltext) )
Author(s)
NISHII, Naohito; OHBA, Yasunori; TAKASU, Masaki; KATOH,
Kazuo; KITOH, Katsuya; SASAKI, Yoshihide; KITAGAWA,
Hitoshi
Citation
[The journal of veterinary medical science] vol.[67] no.[4]
p.[399]-[402]
Issue Date
2005-04-25
Rights
The Japanese Society of Veterinary Science (社団法人日本獣医
学会)
Version
出版社版 (publisher version) postprint
URL
http://hdl.handle.net/20.500.12099/27786
Serum Growth Hormone and Insulin-Like Growth Factor-1 Concentrations in
Japanese Black Cattle with Renal Tubular Dysplasia
Naohito NISHII1), Yasunori OHBA1), Masaki TAKASU1), Kazuo KATOH2), Katsuya KITOH1), Yoshihide SASAKI1) and
Hitoshi KITAGAWA1)*
1)Laboratory of Veterinary Internal Medicine, Department of Veterinary Medicine, Faculty of Applied Biological Sciences, Gifu
University, 1–1 Yanagido, Gifu 501–1193, and 2)Department of Animal Physiology, Graduate School of Tohoku University, Tsutsumidori-
Amamiyacho, Sendai 981–8555, Japan
(Received 11 May 2004/Accepted 7 December 2004)
ABSTRACT. To elucidate the cause of growth retardation, 14 cattle with renal tubular dysplasia (RTD) were investigated by determining
serum growth hormone (GH) and insulin-like growth factor (IGF)-1 concentrations. Compared with 6 healthy cattle, the baseline, max-imum, area under the curve and peak amplitude of serum GH concentrations were higher or tended to be higher. Serum IGF-1 concen-trations were lower normal or lower in cattle with RTD than in healthy cattle. Serum IGF-1 concenconcen-trations correlated significantly with body weight and chest girth, but not with serum GH and creatinine concentrations. Growth retardation in RTD might be associated par-tially with GH resistance.
KEYWORDS: growth hormone, growth retardation, IGF-1, Japanese black cattle, renal tubular dysplasia.
J. Vet. Med. Sci. 67(4): 399–402, 2005
The growth of animals is controlled by hormones and growth factors such as growth hormone (GH), insulin-like growth factor (IGF)-1, thyroid hormones, sex hormones, insulin, and glucocorticoids [22]. Among these physiologi-cally active substances, GH and IGF-1 plays an essential role [4, 10, 14]. Renal tubular dysplasia (RTD) is an autoso-mal recessive hereditary disease in Japanese Black cattle [18, 19], characterized clinically by growth retardation, overgrowth of hooves, and chronic renal failure (CRF). In human patients with CRF, growth retardation is a serious clinical problem, together with other signs such as meta-bolic acidosis, malnutrition, renal osteodystrophy and hor-mone abnormalities [1, 20, 23], although the precise mechanisms are unknown. Some investigators have sug-gested that the GH and IGF-1 are important factors in growth retardation due to the growth of bones in human patients with CRF [9, 23]. However, serum GH and IGF-1 concentrations are unknown in cattle with RTD. To eluci-date the cause of growth retardation, we determined serum GH and IGF-1 concentrations in cattle with RTD, and ana-lyzed GH concentrations using a computer program for analysis of episodic hormone secretion [16].
MATERIALS AND METHODS
Cattle: Fourteen Japanese Black cattle (2 males and 12 females, aged 6 to 28 months old) with RTD diagnosed by detection of a deletion of the paracellin-1 gene [17] were used (RTD group). All cattle showed growth retardation in spite of a relatively normal appetite. As controls, 6 normal Japanese Black cattle (2 males and 4 females, aged from 5 to
11 months) were used for determinations of serum GH con-centrations, and 29 cattle (14 males and 15 females, aged from 6 months to 28 months) for serum IGF-1 concentra-tions. On the sampling day, cattle were fed only at 16:00 hr, and given water ad libitum.
Blood and biochemical analysis: Blood samples collected at 09:00 hr were used. Routine hematology and biochemical values were obtained using an automated blood cell counter (Celltac MEK 5150; Nihon Kohden, Tokyo), a microhema-tocrit method, and the dry chemistry method (FDC-5500V and FDC-800V, Fuji Film, Tokyo).
Serum GH and IGF-1 concentrations: Blood samples were obtained from the jugular vein from 09:00 hr for 10 hr at 15-min intervals. The sera were stored at –70°C. Serum GH concentration was estimated by radioimmunoassay [15]. Its baseline concentration, amplitude, duration, fre-quency, and intervals between peaks were analyzed using the PULSAR program for computer analysis of episodic hormone secretion [16]. The area under the curve of serum GH concentrations per hour (AUC0) and the area under the
curve above the baseline concentrations of serum GH per hour (AUCb) were calculated using a computer program for
the analysis of drug pharmacokinetics [25].
Serum IGF-1 concentration was estimated for the first blood sample collected at 09:00 hr. Since the amino acid sequence of bovine and human IGF-1 is identical [10], the estimation was carried out using an immunoradiometric assay used in human diagnostics (Somatomedin C II Bayer, Yuka Medias, Ibaraki, Japan).
Statistical analysis: Data are expressed as the mean and standard deviation. Differences between the values for RTD and control groups were analyzed by the Mann-Whit-ney test. Correlations between serum GH or IGF-1 concen-trations and other test results were determined by Spearman’s rank correlation coefficient. P<0.05 was used
* CORRESPONDENCE TO: KITAGAWA, H., Laboratory of Veterinary
Internal Medicine, Department of Veterinary Medicine, Faculty of Applied Biological Sciences, Gifu University, 1–1 Yanagido, Gifu 501–1193, Japan.
N. NISHII ET AL.
400
as the level of significance. RESULTS
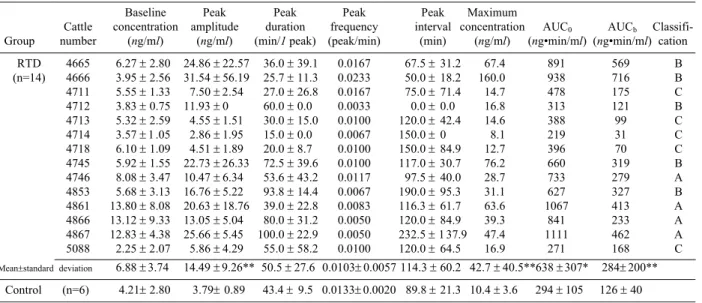
Routine blood and biochemical parameters: The results are summarized in Table 1. Serum potassium, urea nitrogen (UN), creatinine (CRE), total cholesterol, glucose and albu-min concentrations were significantly higher, and serum chloride concentration was significantly lower, in the RTD group than in the control group.
Serum GH concentrations: Figure 1 shows typical pat-terns of serum GH concentrations in healthy and RTD cattle, and Table 2 shows the results of the PULSAR program anal-ysis. The baseline concentration in cattle of the RTD group tended to be higher than in cattle of the control group. The peak amplitude and maximum concentrations were signifi-cantly higher in cattle of the RTD group. The peak fre-quency was not significantly different between the normal and RTD groups. The AUC0 and AUCb were higher in
cat-tle of the RTD group.
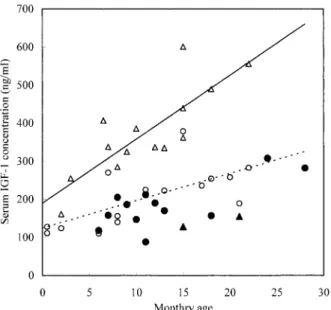
Serum IGF-1: Serum IGF-1 concentrations ordered with monthly ages in cattle of the normal and RTD groups are shown in Fig. 2. Serum IGF-1 concentrations were within normal ranges or slightly lower in cattle of the RTD group. Serum IGF-1 concentrations were correlated with monthly ages (n=14, r=0.612, P<0.02), body weight (n=14, r=0.831, P<0.01) and chest girth (n=14, r=0.859, P<0.01), but did not correlate with serum GH concentration (n=14, r=0.123) and serum creatinine concentration (n=14, r=0.532) in cattle with RTD (Table 3).
DISCUSSION
Secretion of GH from the pituitary gland is controlled mainly by 2 hormones, growth hormone-releasing hormone
(GHRH), which plays a role in occurrences of peak excre-tion, and somatotropin release-inhibiting factor (SRIF), which acts to suppress the GH excretion at the trough of GH concentration [2, 10, 24]. Blood GH concentrations were normal or high in humans [8, 9, 21, 22] and rats [7] with CRF, as well as in cattle with RTD of the present study. In human patients with CRF, the baseline concentration of serum GH was increased, but the peak amplitude and maxi-mum concentration were normal. Therefore, AUC0 was
increased, whereas AUCb was not, and it is considered that
decrease in SRIF action was one of the causes of the ele-vated baseline concentration [13]. In cattle with RTD, how-ever, the baseline concentration, peak amplitude, and maximum concentration of serum GH increased, resulting in increases in AUC0 and AUCb. The increase in peak
amplitude was observed simultaneously with an increase in the baseline concentration, suggesting a decrease in the action of SRIF and an increase in the action of GHRH. Moreover, the baseline concentration was not significantly correlated with peak amplitude in the RTD group, so sepa-rate factors may influence the decrease in the action of SRIF and the increase in the action of GHRH in cattle with RTD. Serum IGF-1 concentrations and serum GH concentra-tions have a significant correlation in normal cattle [11]. Cattle in the RTD group, however, had normal or lower serum IGF-1 concentrations in spite of normal or higher serum GH concentrations, indicating GH resistance. Causes of GH resistance have been shown to be malnutrition [3, 5], parasitic diseases [6], liver diseases, and molecular defects of GH and GH receptors [11], as well as renal failure [9, 21]. In human patients with CRF, it is considered that GH resis-tance may be due to reduced numbers of GH receptors in the liver (decrease in GH sensitivity) [23], and an increase in plasma concentrations of IGF binding protein (IGFBP). This indicates that CRF is associated with GH resistance in
Table 1. Blood and biochemical test results
Control group (n=6) RTD group (n=14)
Variable Mean ± SD Mean ± SD P<
RBC (103/µl) 8610 ± 1934 7184 ± 1799 ΝS Hemoglobin (g/l) 113.8 ± 8.3 100.6 ± 21.5 NS Hematocrit (%) 34.3 ± 3.0 30.3 ± 5.6 NS WBC (102/µl) 80.3 ± 19.5 94.9 ± 28.6 NS Sodium (mmol/l) 142.0 ± 2.3 137.3 ± 6.5 NS Potassium (mmol/l) 3.9 ± 0.3 4.8 ± 0.6 0.01 Calcium (mg/dl) 9.9 ± 0.7 9.9 ± 1.4 NS Inorganic phosphorus (mg/dl) 7.4 ± 1.3 7.7 ± 1.8 NS Chloride (mmol/l) 101.3 ± 2.1 95.7 ± 5.9 0.05 Urea nitrogen (mg/dl) 13.7 ± 3.7 63.8 ± 45.0 0.01 Creatinine (mg/dl) 1.3 ± 0.3 4.1 ± 2.4 0.01 Total cholesterol (mg/dl) 94.3 ± 38.6 162.0 ± 35.9 0.01 Glucose (mg/dl) 69.0 ± 9.6 89.5 ± 19.7 0.05 Total protein (g/dl) 6.4 ± 3.6 6.8 ± 0.6 NS Albumin (g/dl) 2.9 ± 0.2 3.3 ± 0.4 0.05
Aspartate aminotransferase (U/l) 67.8 ± 3.6 113.1 ± 81.8 NS
Alkaline phosphatase (U/l) 256.8 ± 73.8 349.1 ± 150.6 NS
P: Probability of significant difference between the control and RTD groups. NS: Not significant.
cattle with RTD, but the specific mechanisms are unknown. Serum IGF-1 concentration correlated significantly with body weight and chest girth. These significant correlations suggest that IGF-1 might correlate with the growth of cattle with RTD. Growth retardation in cattle with RTD may be associated with GH resistance (abnormalities from GH receptors to IGF-1 synthesis), but it may not be a primary cause.
ACKNOWLEDGEMENTS. We gratefully acknowledge Dr. A.F. Parlow of NIDDK, U.S.A., for providing the GH antibody. We thank Drs. H. Tsukamura and K. Maeda, Graduate School of Bioagricultural Sciences, Nagoya Uni-versity, for use of the PULSAR program. This work was supported in part by a Grant-in-Aid (Nos. 11490014 and 15380214) for Scientific Research from the Ministry of Education, Culture, Sports, Science and Technology of the Government of Japan.
Fig. 1 Serum GH concentrations in a control animal (No. 4549) and an animal with RTD (No. 4746).
Table 2. Serum growth hormone parameters analysed by the PULSAR program
Baseline Peak Peak Peak Peak Maximum
Cattle concentration amplitude duration frequency interval concentration AUC0 AUCb
Classifi-Group number (ng/ml) (ng/ml) (min/1 peak) (peak/min) (min) (ng/ml) (ng•min/ml) (ng•min/ml) cation
RTD 4665 6.27 ± 2.80 24.86 ± 22.57 36.0 ± 39.1 0.0167 67.5 ± 31.2 67.4 891 569 B (n=14) 4666 3.95 ± 2.56 31.54 ± 56.19 25.7 ± 11.3 0.0233 50.0 ± 18.2 160.0 938 716 B 4711 5.55 ± 1.33 7.50 ± 2.54 27.0 ± 26.8 0.0167 75.0 ± 71.4 14.7 478 175 C 4712 3.83 ± 0.75 11.93 ± 0 60.0 ± 0.0 0.0033 0.0 ± 0.0 16.8 313 121 B 4713 5.32 ± 2.59 4.55 ± 1.51 30.0 ± 15.0 0.0100 120.0 ± 42.4 14.6 388 99 C 4714 3.57 ± 1.05 2.86 ± 1.95 15.0 ± 0.0 0.0067 150.0 ± 0 8.1 219 31 C 4718 6.10 ± 1.09 4.51 ± 1.89 20.0 ± 8.7 0.0100 150.0 ± 84.9 12.7 396 70 C 4745 5.92 ± 1.55 22.73 ± 26.33 72.5 ± 39.6 0.0100 117.0 ± 30.7 76.2 660 319 B 4746 8.08 ± 3.47 10.47 ± 6.34 53.6 ± 43.2 0.0117 97.5 ± 40.0 28.7 733 279 A 4853 5.68 ± 3.13 16.76 ± 5.22 93.8 ± 14.4 0.0067 190.0 ± 95.3 31.1 627 327 B 4861 13.80 ± 8.08 20.63 ± 18.76 39.0 ± 22.8 0.0083 116.3 ± 61.7 63.6 1067 413 A 4866 13.12 ± 9.33 13.05 ± 5.04 80.0 ± 31.2 0.0050 120.0 ± 84.9 39.3 841 233 A 4867 12.83 ± 4.38 25.66 ± 5.45 100.0 ± 22.9 0.0050 232.5 ± 137.9 47.4 1111 462 A 5088 2.25 ± 2.07 5.86 ± 4.29 55.0 ± 58.2 0.0100 120.0 ± 64.5 16.9 271 168 C Mean±standard deviation 6.88 ± 3.74 14.49 ± 9.26** 50.5 ± 27.6 0.0103± 0.0057 114.3 ± 60.2 42.7 ± 40.5**638 ±307* 284± 200** Control (n=6) 4.21± 2.80 3.79± 0.89 43.4 ± 9.5 0.0133± 0.0020 89.8 ± 21.3 10.4 ± 3.6 294 ± 105 126 ± 40
Data are presented as mean±standard deviation. AUC0: Area under the curve per hr of serum GH concentration. AUCb: area under the curve per hr
of serum GH concentrations above the baseline concentration. A: Cattle with high baseline concentration and peak amplitude of serum GH. B: Cattle with normal baseline concentration and high peak amplitude of serum GH. C: Cattle with normal baseline concentration and peak amplitude of serum GH. * and **: Significantly different from values in the control group. Single and double asterisks indicate P<0.05 and P<0.01, respectively.
N. NISHII ET AL.
402
REFERENCES
1. Bircan, Z., Kervancioglu, M., Soran, M. and Yildirim, I. 1998. Growth hormone stimulation tests in CRF with metabolic aci-dosis. Acta Paediatr. Jpn. 40: 70–72.
2. Borski, R. J., Tsai, W., Demott-Friberg, R. and Barkan, A. L. 2000. Induction of growth hormone (GH) mRNA by pulsatile GH-releasing hormone in rats is pattern specific. Am. J. Phys-iol.-Endocrinol. Metab. 278: E885–E891.
3. Breier, B. H., Bass, J. J., Butller, J. H. and Gluckman, P. D. 1986. The somatotrophic axis in young steers: influence of nutritional status on pulsatile release of growth hormone and circulating concentrations of insulin-like growth factor 1. J. Endocrinol. 111: 209–215.
4. Breier, B. H. 1999. Regulation of protein and energy metabo-lism by the somatotropic axis. Domest. Anim. Endocrinol. 17: 209–218.
5. Elasser, T. H., Rumsey, T. S. and Hammond, A. C. 1989. Influ-ence of diet on basal and growth hormone-stimulated plasma concentrations of IGF-1 in beef cattle. J. Anim. Sci. 67: 128– 141.
6. Elasser, T. H., Sartin, J. L., Mcmahon, C., Romo, G., Fayer, R., Kahl, S. and Blagburn, B. 1998. Changes in somatotropic axis response and body composition during growth hormone administration in progressive cachectic parasitism. Domest. Anim. Endocrinol. 15: 239–255.
7. Finidori, J., Postel-Vinay, M. C. and Kleinknecht, C. 1980. Lactogenic and somatotropic binding sites in liver membranes of rats with renal insufficiency. Endocrinology 106: 1960– 1965.
8. Fouque, D. 1996. Insulin-like growth factor I resistance in CRF. Mineral Electrolyte Metab. 22: 133–137.
9. Frystyk, J., Ivarsen, P., Skjarbak, C., Flyvbjerg, A., Pedersen, E. B. and Ørskov, H. 1999. Serum-free insulin-like growth
fac-tor 1 correlates with clearance in patients with chronic renal failure. Kidney Int. 56: 2076–2084.
10. Gluckman, P. D., Breier, B. H. and Davis, S. R. 1987. Physiol-ogy of the somatotropic axis with particular reference to the ruminant. J. Dairy Sci. 70: 442–466.
11. Hammond, A. C., Elsasser, T. H. and Olson, T. A. 1991. Endo-crine characteristics of a miniture condition in Brahman cattle: Circulating concentrations of some growth-related hormones. Proc. Soc. Exp. Biol. Med. 197: 450–457.
12. Hannon, K., Gronowski, A. and Trenkle, A. 1991. Relationship of liver and skeletal muscle IGF-1 mRNA to plasma GH pro-file, production of IGF-1 by liver, plasma IGF-1 concentra-tions, and growth rates of cattle. Proc. Soc. Exp. Biol. Med.
196: 155–163.
13. Hokken-Koelega, A. C. S., Hackeng, W. H. L., Stijnen, T., Wit, J. M., Keizer-Schrama, S. M. P. F. M. and Drop, S. L. S. 1990. Twenty-four-hour plasma growth hormone (GH) pro-files, urinary GH excretion, and plasma insulin-like growth factor-I and -II levels in prepubertal children with chronic renal insufficiency and severe growth retardation. J. Clin. Endo-crinol. Metab. 71: 688–695.
14. Kitagawa, H., Kitoh, K., Ito, T., Ohba, Y., Nishii, N., Katoh, K., Obara, Y., Motoi, Y. and Sasaki, Y. 2001. Serum growth hormone and insulin-like growth factor-1 concentrations in Japanese black cattle with growth retardation. J. Vet. Med. Sci.
63: 167–170.
15. Kuhara, T., Ikeda, S., Ohneda, A. and Sasaki, Y. 1991. Effect of intravenous infusion of 17 amino acids on the secretion of GH, glucagon, and insulin in sheep. Am. J. of Physiol. 260: E21-E26.
16. Merriam, G. R. and Wachter, K. W. 1982. Algorithms for the study of episodic hormone secretion. Am. J. Physiol. 243: E310–E318.
17. Ohba, Y., Kitagawa, H., Kitoh, K., Sasaki., Y., Takami, M., Shinkai, Y. and Kunieda, T. 2000. A deletion of the paracellin-1 gene is responsible for renal tubular dysplasia in cattle. Genomics 68: 229–236.
18. Ohba, Y., Kitagawa, H., Kitoh, K., Oikawa, T. and Sasaki, Y. 2001. Inheritance of renal tubular dysplasia in Japanese black cattle. Vet. Rec. 149: 153–154.
19. Ohba, Y., Kitagawa, H., Okura, Y., Kitoh, K. and Sasaki, Y. 2001. Clinical features of renal tubular dysplasia, a new hered-itary disease in Japanese black cattle. Vet. Rec. 149: 115–118. 20. Postel-Vinay, M C., Tar, A., Crosnier, H., Broyer, M.,
Rappa-rort, R. and Tonshoff, B. 1991. Serum growth hormone binding protein is low in uremic children. Pediatr. Nephrol. 5: 545– 547.
21. Santos, F., Orejas, G., Rey, C., Garcia-Vicente, S. and Malaga, S. 1991. Growth hormone metabolism in uremia. Child Neph-rol. UNeph-rol. 11: 130–133.
22. Styne, M. 2001. Growth. pp. 163–200. In: Basic and Clinical Endocrinology. 6th ed. (Greenspan, F. S. and Gardner, D. G. eds.) Lange Medical Books/McGraw Hill, New York. 23. Tonshoff, B., Blum, W. F. and Mehls, O. 1997. Derangements
of the somatotropic hormone axis in chronic renal failure. Kid-ney Int. 58: 106–113.
24. Wagner, C., Caplan, S. R. and Tannenbaum, G. S. 1998. Gene-sis of the ultradian rhythm of GH secretion: a new model unify-ing experimental observations in rats. Am. J Physiol.-Endocrinol. Metab. 38: E1046-E1054.
25. Yamaoka, K. and Tanikawara, Y. 1983. A Guidebook of Phar-macokinetics Using a Microcomputer. Nankodo, Tokyo (in Japanese).
Fig. 2. Serum IGF-1 concentrations in control cattle and cattle with RTD. : Female with RTD, : male with RTD, : female control, : male control. —: Regression line of male controls (n=14, y=16.80x+190.26, P<0.01). ---: Regression line of female controls (n=15, y=7.19x+124.68, P<0.01).