D11
Validation of Numerical Predictions of Lateral Spreading Based on “Hollow-Cylinder Torsional
Shear Tests” and a Large Centrifuge-Models Database
〇Ruben R. VARGAS, Kyohei UEDA, Ryosuke UZUOKA
1.Introduction
During the past 40 years, efforts and developments in computational modeling of geo-materials have contributed to increasing the accuracy of prediction of the dynamic response of soil systems. However, despite of the efforts, exercises of verification and validation (V&V) of numerical simulations are required to enhance the reliability of numerical models. In this sense, a new international collaborative project (named “LEAP”) was developed, aiming a re-assessment of the reliability of modern numerical techniques in the analysis of liquefaction related problems1).
The main objective of this work is to validate the capabilities of the “Strain Space Multiple Mechanism Model”2) to simulate the lateral spreading phenomena under a diverse range of densities and input motions.
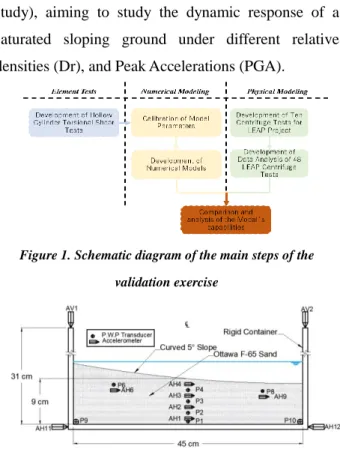
Figure 1 shows a schematic diagram of the main steps followed in the validation process.
2.Physical Modeling 2.1.Model Specifications
As described by Kutter et. al3), a uniform-density, 20 m long, 4 m deep at center, and 5 degrees sloping deposit of Ottawa F-65 Sand inside a rigid container, was specified for the LEAP Exercises. Figure 2 shows the geometry, dimensions, and instrumentation of the target models in model scale. The input motion consisted of a ramped sinusoidal 1 Hz wave.
2.2.Correlation and Variability Estimation As part of LEAP Project, forty-eight tests were developed in ten different centrifuge facilities all over the world (eight of them developed as part of this
study), aiming to study the dynamic response of a saturated sloping ground under different relative densities (Dr), and Peak Accelerations (PGA).
Figure 1. Schematic diagram of the main steps of the validation exercise
Figure 2. Model Dimensions – Model Scale
Kutter et. al3) found that, for the lateral spreading phenomena, the final surface displacements (Ux) are primarily a function of the intensity of shaking and the relative density of the sand. Based on this, a correlation between Ux, PGA, and Dr, was developed; aiming that this correlation will serve as the basis for the validation process. As an attempt to estimate the variability in the tests, as seen in Figure 3, the upper and lower bounds for a 95% probability were estimated, assuming a Gaussian Distribution.
3.Element Tests
In order to study the mechanical properties of Ottawa F-65 Sand, a series of Hollow Cylinder Dynamic Torsional Shear Tests for four different
relative densities (Dr=50%, 60%, 70%, and 80%), were conducted under a wide range of Cyclic Stress Ratio (CSR) values, aiming to estimate the corresponding liquefaction resistance curves (LRC).
Figure 3. Confidence Bounds for the Ux-Dr-PGA Correlation
4.Numerical Model
4.1.Element Tests Simulations
Based on a parametric study, the seventeen parameters of the model (for each density under study) were estimated following an iterative procedure, taking as a primary reference the LRC for γDA=7.5%. Additionally, as for the input variability of the model, it was considered as variations in the simulated LRC, under three different scenarios.
4.2.Physical Model Simulations
Based on the characteristics of the models, and using the calibrated parameters, the analysis was carried out under 2-D plane-strain conditions, aiming to simulate the models in prototype scale. Figure 4 shows the mesh and the boundary conditions.
Figure 4. FEM Mesh and Boundary Conditions
5.Comparison among Physical and Numerical Models
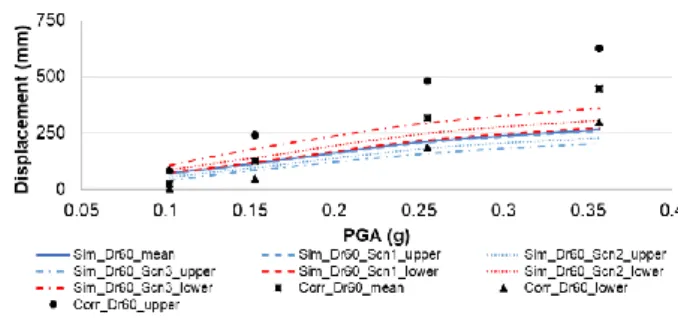
Hundreds of numerical models were developed in order to replicate the combinations of Dr-PGAeff for which the correlation was developed (i.e. 50% <Dr< 80%, and 0.1g < PGAeff < 0.35g). The uncertainty of the LRC was propagated through the model by means of Monte-Carlo simulations, in order to obtain the median trend and the variability of the computed
displacements. As an example, Figure 8 shows a comparison between displacements obtained by the numerical simulations, and the experimental displacements (i.e. based on the correlation), for Dr=60%. This figure includes a comparison between the mean values (i.e. 50% probability) and the upper/lower boundaries corresponding to 95% probability, for the three scenarios of variability.
Figure 5. Computed displacements vs Results obtained in the estimated correlation, for Dr = 60%
6.Conclusions
Based on LEAP Tests, a correlation that provides a reliable characterization of the response was developed; it was shown that it can be used as a reliable baseline in the development of current and future V&V processes of liquefaction models. For the median response, it has been shown that if
the model parameters are calibrated based on high-quality laboratory tests, a good agreement can be obtained for PGA values lesser than 0.25g. For 95% probability, the confidence bounds of the
computed displacements are located between the confidence bounds of the experimental outcomes, for PGA values lesser than 0.25g.
References
1) Manzari MT et. al. (2015) – “LEAP projects: Concept and challenges” Geotechnics for Catastrophic Flooding Events; 109-116, CRC Press.
2) Iai S et.al. (2011) “Dilatancy of granular materials in a strain space multiple mechanism model”. IJNAMG, 35(3)
3) Kutter BL et. al. (2018) “Twenty-Four Centrifuge Tests to Quantify Sensitivity of Lateral Spreading to Dr and PGA” Geot. Earthquake Eng. and Soil Dyn. V.