傾斜した棒から励起される内部重力波
神戸大学 (Kobe University) 片岡 武 (Kataoka, T.)
Massachusetts lnstitute ofTechnology S. J. Ghaemsaidi, N. Holzenberger,
T. Peacock,
T. R. Akylas 要旨
The generation of internal gravity waves by a vertically oscillating cylinder that is tilted to the honizontal in a stratified Boussinesq fluid of constant buoyancy frequency N, is investigated. Simple kinematic considerations reveal that for
a cylinder inclined by a given angle \emptyset to the horizontal, there is a cut‐off frequency, Nsin $\phi$, below which there is no longer a radiated wave field. This result is confirmed by supportin\mathrm{g}laboratory experiments.
1. 緒言
The ‘St. Andrew’s Cross’ experiment performed by Mowbray & Rarity (1967) is one of the most celebrated studies of intemal gravity waves. For this experiment, a cylinder aligned honizontally with a plane of constant gravitational potential is oscillated vertically with small amplitude in a density stratification of constant buoyancy frequency (which corresponds to top figure 1 with \emptyset\rightarrow 0 ( $\chi$\rightarrow $\theta$ The wave disturbance generated by the oscillating cylinder, instead of circular wave crests, features four wave beams that emanate from the cylinder (top figure lb with $\chi$\rightarrow $\theta$), forming a cross pattem whose openin\mathrm{g}is determined by the dispersion relation.
Here, we step away from the canomical St. Andrew’s Cross to consider a more genenic settin\mathrm{g}
that has not been previously explored, and in so‐doing we find results that are profoundly different and potentially of broad interest. Specifically, we study intemal wave generation by a vertically oscillating cylinder that is tilted with respect to the horizontal (figure 1) (Kataoka et al. 2017). This forcing arrangement leads to a variant of the classical St. Andrew’s Cross that has features with no counterpart in the coniespondmg horizontal cylinder problem. For example, for a given tilt of the cylinder there is a cut‐off frequency below which there is no longer a radiated wave field. Furthennore, three‐dimensional effects due to the fmite length of the cylinder, which are minor in the horizontal configuration, here become a significant factor and eventually
y \rightarrow z $\varphi$\approx 0 y 1 ▲
\downarrow g
z$\phi$\displaystyle \approx\frac{ $\theta$}{2}
$\phi$\approx $\theta$
\ovalbox{\tt\small REJECT}
\downarrow g
Z
(a) (b)
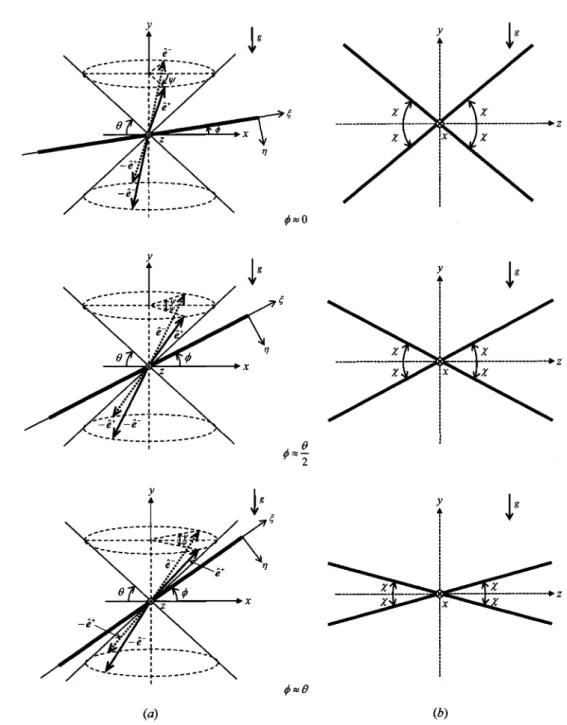
Fig. 1 Geometry of wave beams induced by infinitely long lin\mathrm{e}forcin\mathrm{g}tilted to the horizontal
by $\phi$ and oscillatming with frequency $\omega$=\sin $\theta$: (a) three‐dimensional view; four
beams propagate in the directions \pmê\pm and form an oblique cross; (b) intersection of
the beams with the vertical yz‐plane. Cases of three tilt angles ( $\varphi$\approx 0, $\varphi$\approx $\theta$/2, $\varphi$\approx $\theta$)are shown.
dominate the wave field as the cut‐off frequency is approached. These results follow from elementary linear wave theory and are also confirmed by supporting laboratory experiments.
2。無限に長い傾斜棒からのピーム
We discuss the geometry of the steady‐state intemal wave pattem induced by tme‐hamonic line forcing, modelling an oscillating long thin cylinder, in an unbounded, \mathrm{n}\mathrm{o}\mathrm{n}-\mathrm{r}\mathrm{o}\mathrm{t}\mathrm{a}\mathrm{t}\dot{\mathrm{m}}\mathrm{g}, uniformly stratified Boussminesq fluid. Here, the forcin\mathrm{g} is taken to be infinitely long. Our
analysis makes use of the well‐known dispersion relation of intemal gravity waves,
$\omega$=\sin $\theta$, (1)
where $\omega$ is the dimensionless wave frequency (scaled with the constant background buoyancy
frequency N) and $\theta$ is the inchnation angle of the wavevector to the vertical (y) axis pointing
upwards. As illustrated in figure 1(a), the wave source stretches along the $\xi$‐direction in the
xy‐plane and is tilted to the horizontal (x) axis by an angle 0< $\phi$< $\pi$/2, with z beming the
transverse horizontal direction. Similar to the classical St. Andrew’s Cross due to horizontal
forcing( $\phi$=0), the dispersion relation (1) being independent of the wavevector magnitude is key to the kinematic argument used below for deducing the wave pattem due to a tilted line
source.
From elementary linear wave theory, the steady‐state response to a time‐harmonic source compnises plane waves at the driving frequency. The location of corresponding beams relative to the source is determined by the group velocity c_{g}=\nabla_{k} $\omega$ , which is at right angles to k and
must pomint away from the source, in keeping with the radiation condition. Specifically, as shown in figure 1 (a), two beams are found above the line source and propagate towards y\rightarrow\infty along
the corresponding group‐velocity directions
ê
\pm=(cos
$\theta$\cos $\psi$,sin
$\theta$,\pm\cos $\theta$\sin $\psi$),
(2)
where$\psi$=\cos^{-1}(\cot $\theta$\tan $\phi$)
; (3)the other two beams are located below the line source and propagate towards y\rightarrow\rightarrow in the
opposite directions.
forcin\mathrm{g}. This ‘oblique’ cross undergoes dramatic transformation as the source tilt angle \emptyset is
varied in the range 0\leq\emptyset\leq $\theta$. As indicated in figure 1(a), a measure of the cross opemng is the
angle $\psi$ in (3), which decreases monotomically with \emptyset , from $\psi$= $\pi$/2 for \emptyset=0 to $\psi$=0
for $\phi$= $\theta$. As a result, the classical St. Andrew’s Cross for horizontal forcing( $\phi$=0)gradually closes as \emptyset is increased and ultimately degenerates to a single standing beam along the forcing
( $\xi$ ) direction in the limit $\phi$\rightarrow $\theta$.
A convemient way to visualize this transformation is by considering the intersection of the oblique‐cross wave pattem with the (vertical) yz‐plane. Seen in this plane, the four cross arms
are inclined at
$\chi$=\tan^{-1}\sqrt{\tan^{2} $\theta$-\tan^{2} $\phi$}
(4)to the (honzontal)z‐axis, and forn a symmetric configuration centred at the onigin (figure 1b).
The angle $\chi$ attains the maximum $\chi$= $\theta$ for the classical St. Andrew’s Cross ( $\phi$=0) which
lies in the yz‐plane. As \emptyset is increased and the cross leans towards the forcin\mathrm{g}, $\chi$
monotomically decreases and eventually $\chi$\rightarrow 0 as \emptyset\rightarrow $\theta$.
3. 棒が有限長さであることの影響
We now tum to the effects of fmite length of the line source. These end effects become progressively more significant with increasin\mathrm{g}source tilt angle \emptyset, and understanding their role
is crucial in interpreting the experimental observations in Section 4.
As in the case of infinitely long forcin\mathrm{g}, the steady‐state response to a time‐harmonic lin\mathrm{e}
source of finite lengthLis again made ofplane waves with wavevectors inclined to the vertical
by a fixed angle $\theta$, determined by the driving frequency $\omega$=\sin $\theta$. Thus, treating the forcin\mathrm{g}
ends as point sources, the plane waves emitted there propagate along vertical cones of angle $\theta$
from the horizontal, and contaminate the four wave beams that emanate from the interior of the forcing. Specifically, for tilted forcin\mathrm{g}as sketched in figure 2(a), the dominant end effects are
expected to come from the upper cone due to the left end and the lower cone due to the night end, as these cones are closest to the main body of the forcing, where the wave beams are generated. To illustrate our approach, we now discuss how end effects modify the wave beam pattem in the vertical yz‐plane across the middle of the forcing(x=0). As argued above, the combined response (see figure2b) consists of the four beams (solid lines) found earlier (figure
(a)
y\displaystyle \rightarrow-z\tan $\theta$-\frac{L}{2}\sin $\phi$
\nwarrow\backslash _{\backslash }
、’
y+
|g
y\displaystyle \rightarrow z\tan $\theta$-\frac{L}{2}\mathrm{s}\dot{\mathrm{m}} $\phi$\wedge
\text{グ^{\ovalbox{\tt\small REJECT}'}}
’
y\displaystyle \rightarrow-z\tan $\theta$+\frac{L}{2}\sin $\phi$\backslash \backslash \backslash
y\displaystyle \rightarrow z\tan $\theta$+\frac{L}{2}\sin $\phi$
(b)
、
y\uparrow
、、、
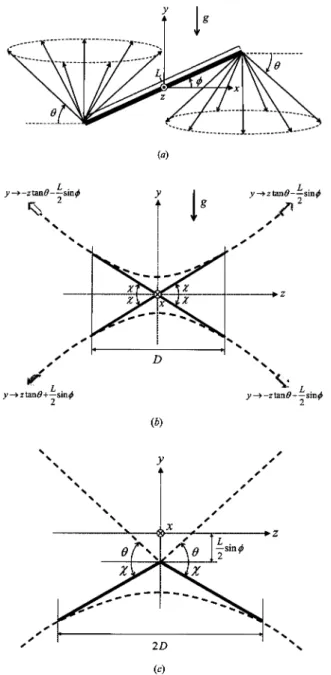
(c)Fig. 2 Kinematics of intemal waves generated by line forcing of fmite length L, tilted at an
angle $\varphi$ to the horizontal and oscillating with angular frequency $\omega$=\mathrm{s}\dot{\mathrm{m}} $\theta$: (a) the
dominant end effects arise due to plane waves that propagate along the two vertical cones shown; (b) intersection of the wave pattem with the vertical yz‐plane across the middle of the forcin\mathrm{g}(x=0); (c) intersection of the wave pattem with the vertical yz‐plane across the lower end of the forcing (x=-(Ll2)\cos $\varphi$). Here the dashed lines represent the end effects due to the two cones shown in (a), and the solid lines depict the four beams shown in figure 1(b), which emanate from the main body ofthe forcin\mathrm{g}.
1b) and the two hyperbolae (dashed lines) formed by the intersection of the yz‐plane with the end cones shown in figure2(a). From geometric considerations, it tums out that the four beam directions become tangent to these hyperbolae, and the wave beams remain distinct from the distu $\Gamma$bances emanating from the ends, within a rectangle centred at the origin and of width
D=L\cos $\varphi$\sqrt{\frac{\tan^{2} $\theta$}{\tan^{2} $\varphi$}-1}
(5)and height Dtan $\chi$ (figure 2b).
It should be noted that D\rightarrow\infty when \emptyset\rightarrow 0 (honizontal forcing); in this instance, the wave
beams coincide with the asymptotes ofthe two hyperbolae so the classical St. Andrew’s Cross is hardly affected by the ends. As the tilt angle $\phi$ is increased and D is reduced according to
(5), however, end effects are felt progressively more seriously. Finally, D\rightarrow 0 as the cut‐off
condition is approached ( $\phi$\rightarrow $\theta$); in this limit, the forcin\mathrm{g}is tangent to the end cones in figure
2(a) so end disturbances totally interfere with the beams from the main body of the forcin\mathrm{g}.
These kinematic results are confirmed by laboratory experiments in Section 4.
4. 実験結果
Our experimental study of the oblique‐cross geometry focused on measuring the angle $\chi$
that the four cross arms make to the horizontal in the yz‐plane (figure 2b). As discussed in
Section 3, the response to tilted line forcing is always affected by the finite length of the source, and these end effects are amplified as the cut‐off condition $\theta$= $\phi$ is approached. Specifically, in the yz‐plane across the middle of the forcing (figure 2b), where the wave pattem is symmetric
iny, the four wave beams due to the main body of the forcing remain intact within a rectangular
region of width D given by (5), which shrinks to zero as $\theta$\rightarrow\emptyset . As a result, it becomes
increasingly difficult to measure the angle $\chi$ when the drivin\mathrm{g} frequency $\omega$=\mathrm{s}\dot{\mathrm{m}} $\theta$ of the
cylinder approaches $\omega$=\sin $\phi$.
To tackle this issue, experimental data for $\chi$ was obtained in yz‐planes closest to the
cameras so as to observe the wave field near the lower end (x=-(Ll2)\cos $\varphi$) of the cylinder.
In this setup, as sketched in figure 2(c), the wave pattem is no longer symmetric as the wave beams emanating from the interior of the forcing appear only below the cylinder
forcing (see figure 1 a). Moreover, the disturbance above the cylinder (y>-(Ll2)\sin $\varphi$) is
entirely an end effect, from the mintersection of the yz‐plane with the end cone at the lower end of
the cylinder (figure2a), and tums out to be rather weak. As demonstrated below, this wave‐field
geometry makes it possible to accurately measure the beam angle $\chi$ even quite close to
cut‐off, by focusing on the wedge formed by the two beams just below the lower end of the cylinder.
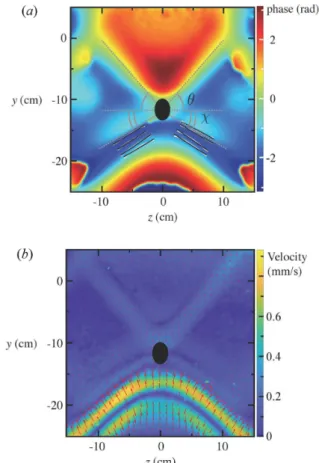
Figure 3 shows snapshots of wave fields for \emptyset=44^{\circ} and $\theta$=49.5^{\circ} obtained in the
yz‐planes across the lower end of the cylinder (L=36\mathrm{c}\mathrm{m}, diameter 2.5\mathrm{c}\mathrm{m}); top figure plotted
the phase field of the vertical velocity component, which was chosen to maximize the clarity of
the wave field structure. Consistent with the geometry in figure 2(c), the desired beam angle $\chi$
(a) (rad) y(cm) -10 0 10 z(cm) (b) y(cm) z(cm)
Fig. 3 (a) Phase field plot across the lower‐end vertical plane of cylinder for $\varphi$=44^{\circ} and
$\theta$=49.5^{0} (
$\chi$_{\mathrm{t}\mathrm{h}\mathrm{e}\mathrm{o}\mathrm{r}\mathrm{y}}=33.6^{\circ}
and $\chi$_{\mathrm{m}\mathrm{e}\mathrm{a}\mathrm{s}\mathrm{m}\mathrm{e}\mathrm{d}}=35.2^{\mathrm{O}}\pm 1.1^{\mathrm{O}} ). (b) Velocity amplitude plot (withsuperposed arrows) corresponding to phase results in(a). In each image, the black ellipse marks
can be readily determined in the lower half of the field of view. The velocity amplitude plot
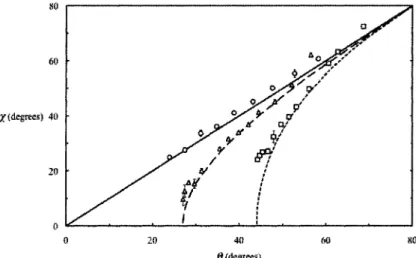
(bottom figure 3) also shows good agreement with the kinematics presented in figure2(c). Experiments were run across a wide range of driving frequencies $\omega$=\sin $\theta$ for the three tilt
angles \emptyset=0^{\mathrm{Q}} , 27^{\circ} and 44^{\circ}, and the resulting data for $\chi$ as a function of $\theta$=\sin^{-1} $\omega$ is presented in figure 4, in which the error bars presented represent the standard deviation of the mean. There is generally excellent agreement between expeniment and the theoretical predictions obtained from (4). Most notably, for fixed driving frequency $\omega$, the beam projected
angle $\chi$ is reduced as the cylinder tilt angle \emptyset increases, and for non‐zero $\phi$ there is a
lower cut‐off driving frequency corresponding to $\theta$= $\phi$ at which $\chi$ goes to zero; as expected,
no radiated wave beams were observed below cut‐off( $\theta$< $\varphi$).
s
ó
X1\mathrm{d} $\varepsilon$ \mathrm{g} $\tau$ \mathrm{e}\mathfrak{B}s\}4
2
0 20 40 W \mathrm{S}0
$\theta$(面罫 $\alpha$8}
Fig. 4 Experimental data for the beam angle $\chi$ as a function of $\theta$ set by the driving
frequency $\omega$=\sin $\theta$, for tilt angle $\varphi$=0^{\circ} (circle), $\varphi$=27^{\circ} (triangle) and $\varphi$=44^{\circ} (square);
the coiresponding theoretical curves, obtained by (5), are included as solid, dashed and dotted
lines, respectively. The error bars are the standard deviation of the mean.
参考文献
Mowbray, D. E. & Rarity, B. S. H., “A theoretical and experimental investigation of the phase configuration of intemal waves of small amplitude in a density stratified liquid J. Fluid
Mech. 28 (1967) pp. 1‐16.
Kataoka, T., Ghaemsaidi, S., Holzenberger, N., Peacock, T. & Akylas, T. R., “Tilting at wave beams: a new perspective on the St. Andrew’s Cross J. Fluid Mech. 830 (2017) pp.