Trade obstacles, inventory level of inputs,
and internationalization of enterprise
activities : a comparison between Southeast
Asia and Latin America
著者
Ueki Yasushi
権利
Copyrights 日本貿易振興機構(ジェトロ)アジア
経済研究所 / Institute of Developing
Economies, Japan External Trade Organization
(IDE-JETRO) http://www.ide.go.jp
journal or
publication title
IDE Discussion Paper
volume
474
year
2014-08-01
INSTITUTE OF DEVELOPING ECONOMIES
IDE Discussion Papers are preliminary materials circulated to stimulate discussions and critical comments
Keywords: export propensity, export intensity, trade cost, inventory control, Southeast Asia, Latin
America
* Economic Research Institute for ASEAN and East Asia ([email protected]). This paper is one of the products from the international joint research project titled “Globalization and the Growth of Firms in Developing Countries: Comparisons between East Asia and Latin America” organized by the Institute of Developing Economies (IDE), Japan and Centro de Estudios Asiáticos (CEA), Pontificia Universidad Católica de Chile. The author thanks Marcos José Jaramillo, Roberto Durán, José Gregorio Diaz, Johannes Rehner, Sebastián Baeza González, Koichi Kitano, and Koichiro Kimura for having fruitful discussions on the comparison between Asia and Latin America in the workshops held at CEA and IDE. My thanks also go to Carlos Durand (CCL), Carlos Garcia (CCL), Clemente Ruiz Durán (UNAM), Enrique Dussel Peters (UNAM), José E. Durán (ECLAC), and Silvio Miyazaki (USP) for their support for the author’s research in Latin America. The views expressed in the paper are those of the author and do not necessarily reflect the views of the organizations. All of the errors in this paper are also those of the author.
IDE DISCUSSION PAPER No. 474
Trade Obstacles, Inventory Level of
Inputs, and Internationalization of
Enterprise Activities: A Comparison
between Southeast Asia and Latin
America
Yasushi UEKI*
August 2014
Abstract: This paper investigates the impact of trade barriers such as customs clearance,
subjective trade obstacles (customs and trade regulations), and inventory of inputs on the internationalization of enterprises in Southeast Asia and Latin America, using the World Bank’s enterprise surveys. Empirical results show a negative association between the internationalization of enterprises and subjective trade obstacles, while the impact of subjective trade obstacles is not significant on enterprises already internationalized. An international comparison between Southeast Asia and Latin America suggests that enterprises in Latin America face unfavorable conditions that discourage them from becoming more closely inserted into international production networks.
The Institute of Developing Economies (IDE) is a semigovernmental, nonpartisan, nonprofit research institute, founded in 1958. The Institute merged with the Japan External Trade Organization (JETRO) on July 1, 1998.
The Institute conducts basic and comprehensive studies on economic and related affairs in all developing countries and regions, including Asia, the Middle East, Africa, Latin America, Oceania, and Eastern Europe.
The views expressed in this publication are those of the author(s). Publication does not imply endorsement by the Institute of Developing Economies of any of the views expressed within.
INSTITUTE OF DEVELOPING ECONOMIES (IDE), JETRO 3-2-2, WAKABA,MIHAMA-KU,CHIBA-SHI
CHIBA 261-8545, JAPAN
©2014 by Institute of Developing Economies, JETRO
No part of this publication may be reproduced without the prior permission of the IDE-JETRO.
1 1. Introduction
The present international race for industrial development among nations has become much more complex than the era when import substation industrialization policies were adopted by developing countries like those in Latin America. Exclusive devotion to export promotion and import protection does not necessarily create internationally competitive winners today. On the other hand, international trade and linking domestic firms with international production networks are growing increasingly important as a mechanism promoting industrial development. This is a considerable change in industrial policy from the conventional idea of building a whole supply chain at home to that of the new paradigm that accentuates the need for joining international supply chains (Baldwin, 2011). Behind this change is the decreasing transaction costs including tariff and non-tariff barriers that enable the fragmentation of production networks (Kimura & Ando, 2005), or globalization’s second unbundling based on revolutionary ICT development (Baldwin, 2011). As a result, empirically observable are increases in the world pattern of importing-to-produce trade and its subset of importing-to-export trade (Baldwin & Lopez-Gonzalez, 2013).
Fragmentation of production networks and the resulting expansion of international trade are expected to increase opportunities for developing countries to receive technical assistance and new knowledge from their trade partners. Innovations are more likely to be generated within international production networks than R&D laboratories in developing countries like Southeast Asia that lack domestically available monetary and human resources for R&D and therefore have not fostered indigenous innovation capability. Deepening international buyer-supplier relationships that involve face-to-face interaction among engineers from different firms will promote technology transfer and supply-chain learning among firms in the chains (Machikita & Ueki, 2012). Diversifying trade partners also increase chances for firms to obtain diversified new ideas and technologies to realize incremental and radical improvements (Machikita & Ueki, 2011).
Even though previous studies have tested for the association between international trade and productivity, they have shown mixed empirical results, pointing out technical difficulties in verifying the causal relationship between them (Hayakawa et al., 2012; Wagner, 2012). Nevertheless these studies make developing countries sufficiently aware of the significance of trade promotion and liberalization. Among the empirical studies on export and productivity, Alvarez and López (2005) obtained observations consistent with learning-by-exporting for Chile, using plant-level data. There are also studies that examined import and productivity. Kasahara and Rodrigue (2008) found the association between becoming an importer of intermediate goods and improvement in productivity of Chilean manufacturing plants. Amiti and Konings (2007) examined the case of Indonesia to show the productivity gains from reducing input tariffs. Blalock and Veloso (2007) also studied the case of Indonesia to find that vertical supply relationships are the channel of import-driven technology transfer.
Impacts of trade liberalization can be generated by the increase of both export and import. In the case of Canada, Baldwin and Gu (2004) observed that trade liberalization increased export-market participation, which was associated with increases in plant-level productivity growth. They also identified learning by exporting, exposure to international competition, and increases in product specialization as main mechanisms through which export-market participation raises productivity. Their evidence also showed that entering export markets leads to increases in
2
foreign sourcing for advanced technologies. Similarly, Paus et al. (2003) found relationships between trade liberalization and productivity growth for seven Latin American countries.
As a result of the progress of international cooperation for decreasing tariff barriers, elimination of non-tariff barriers such as customs procedures and trade-related regulations and trade facilitation became main policy issues to be solved. Wilson et al. (2003) found that improvements in regulatory barriers and customs significantly expanded trade in the APEC region. Wilson et al. (2005) showed that the improvement in customs environment brought benefits to all the regions.
Although this literature suggests the association between trade facilitation and economic gains, it does not provide information on what management practices could be hampered by trade barriers. As macro-institutional constraints can affect business strategies taken by firms and consequently business performances (Kinra & Kotzab, 2008), it is important to explore how non-tariff barriers can affect what key performance indicators at the firm level and how they hinder access to international production networks.
This paper focuses on inventory of inputs as a main indicator that can influence export performance. As OECD (2009) mentions, customs clearance procedures cause unnecessary delays that can result in loss of business opportunities and impose inventory holding and depreciation costs on traders. Also inventory management is recognized as a key indicator for measuring supply chain performance (Beamon, 1999) that may affect insertion into international supply chains and development of closer relationships with international buyers and suppliers. Thus it is important to get an understanding of the relationship between inventory of inputs and international trade at the firm level. This paper also examines the association between inventory of inputs and trade obstacles including customs procedures and other regulatory constraints. As Tansuhaj and Gentry (1987) investigated, the benefits of using trade zones are facilitating logistics functions probably because the shorter customs processing time can reduce inventory necessary to maintain ongoing production. By investigating the association between trade obstacles and inventory of inputs, and between inventory of inputs and trade performance, we will be able to get a better understanding of how obstacles negatively influence which management practices, which may result in lower trade performance.
The other research interest of this paper is in an international comparison between Southeast Asia and Latin America. As Portugal-Perez and Wilson (2012) suggest, there is room for ASEAN to make significant gains from trade facilitation reform. But this issue may be more serious for Latin America as Global Competitiveness Report (Schwab, K., & World Economic Forum, 2013) and other business environment indicators tend to show more difficult conditions facing firms in Latin America than their counterparts in Asia.
Following this introduction, Section 2 presents the data used for this paper and summary statistics. The model and the results of the estimations are presented in Section 3. A brief discussion and conclusions are set forth in Section 4.
2. The Data
There is a limited availability of statistics for comparing at the firm level the business environment and trade performance in Asia and Latin America. The dataset used in this paper is
3
from enterprise surveys conducted by the World Bank in 2009 and 2010 in East Asia and Latin America. Of the East Asian countries that have large-scale manufacturing activities, the survey has been developed only for Indonesia, the Philippines, and Vietnam in 2009. On the other hand, most of the countries in Latin America and the Caribbean were surveyed during the period. Countries selected for this paper were Brazil, surveyed in 2009, and four pacific-rim countries: Chile, Colombia, Mexico, and Peru, surveyed in 2010.
There are 10,080 observations in the datasets comprising the eight countries. For the analysis conducted in this paper, null values have been excluded from the dataset. The conversion of variables to natural logarithmic form also decreased the number of observations in the dataset used for the analysis. The respondents who have direct exports but did not answer the questions on the average number of days to clear customs for goods exported directly have also been excluded from the dataset. As a result, a total of 5,513 observations remained available for analysis in this paper.
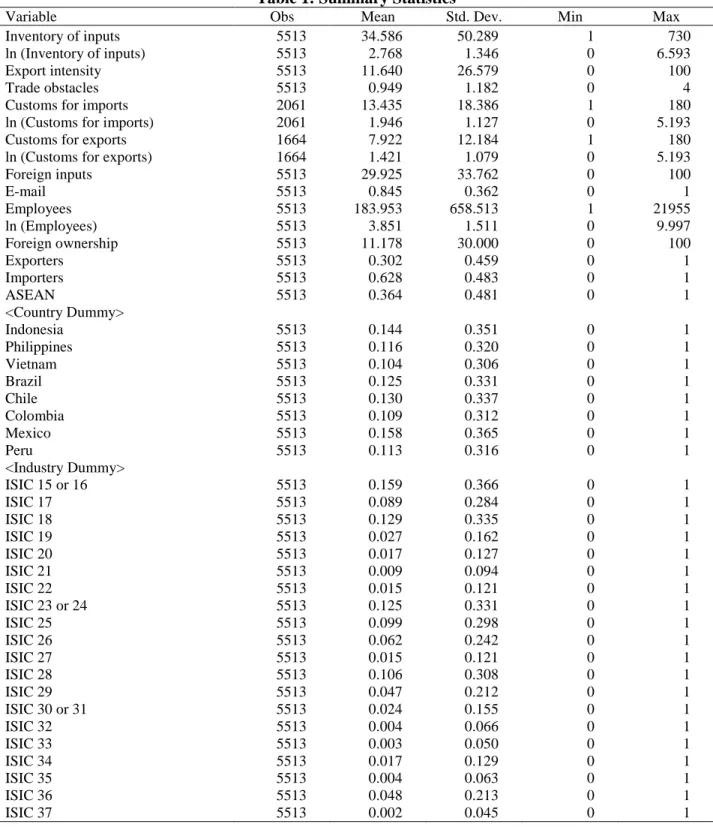
Table 1 shows the summary statistics for the entire sample, while Table 2 presents only the mean of variables by country and region excluding the variables converted to logarithm from Table 1. As shown in Table 2, the number of observations for each country ranges from 576 for Vietnam to 870 for Mexico, showing that no country makes up a majority of the sample. The number of observations for the ASEAN countries is 2,009, accounting for 36.4% of the whole sample. The number of observations for the countries in Latin America (LA) is 3,504 or comprising 63.6% of the whole sample.
If the respondents are categorized according to internationalization, 30.2% of them are exporters, and 62.8% of them are importers. These figures indicate that the sample could be biased toward internationalized enterprises compared to the national average. By region, enterprises in ASEAN are more internationalized than those in LA. About 27.2% of the ASEAN and 31.9% of the LA enterprises are exporters, whereas 48.0% of the ASEAN and 71.3% of the LA enterprises import inputs. By country, enterprises in large countries such as Brazil and Indonesia are less internationalized. In ASEAN some 19.1% of the enterprises in Indonesia export products while 41.3% of the Vietnamese firms do. In LA, 18.8% of enterprises in Brazil are exporters while that for Peru is 43.7%. On the other hand, importers account for 24.5% of firms in Indonesia and 64.1% in the Philippines, while the percentage of importers is 47.5% for Brazil and 85.5% for Peru.
If the degree of internationalization is measured by the average percentage of exports over total sales or export intensity, the figure for the whole sample is 11.6%. Although the proportion of internationalized enterprises in LA is higher than in ASEAN, the export intensity is 16.5% for ASEAN and 8.9% for LA. At the country level, the percentage for Indonesia is 10.2%, which is the lowest among the three ASEAN countries, but higher than all countries in LA except the 16.6% for Peru. The export intensities for Chile, Colombia, and Mexico are below 9%, and the figure for Brazil is only 3.2%.
The main objective of this paper is to explore the factors that would make such differences in internationalization at the firm level between ASEAN and LA. This paper emphasizes business costs and the business environment that may affect the business costs as factors influencing these indicators for internationalization. Among the key independent variables used for the regressions performed in the following section, inventory level of inputs is the main variable for business costs. Table 1 shows on average 34.6 days of stock for the most important input, measured in
4
days of production, is available when a firm receives delivery of its most important input. By region, enterprises in ASEAN carry 30.2 days of inventory of their most important input, while those in LA hold 37.1 days on average. In particular, enterprises in Chile and Peru have a higher inventory equivalent to about 47 days of production. These figures indicate that enterprises in LA shoulder a heavier burden of input inventory than those in ASEAN.
As indicators for business environment, a subjective assessment of customs and trade regulations is available. The indicator for trade regulations is codified 0 if enterprises consider them as no obstacle, and 4 if they are a very severe obstacle. The mean for trade obstacles is 0.95 for the whole sample. However, there is a significant difference between ASEAN at 0.63 and LA, 1.13. Among countries in LA, Chile is the only country capable of competing with countries in ASEAN. The scores for LA except Chile are higher than 1. Brazil recorded the highest mean of 1.69, while the lowest is 0.51 for Vietnam.
Indicators available for business environment that are more objective are average number of days to clear customs for exported goods and those for imported material inputs and/or supplies, which are specified only by exporting and importing firms at the time when the survey was conducted. The average days for customs clearance of exports and imports are 7.9 and 13.4 days for the entire sample. There is a considerable gap between ASEAN and LA in the average days for customs clearance, in particular for import procedures. It takes 8.7 days on average for enterprises in LA and 6.3 days for those in ASEAN to complete customs clearance for exports. Customs clearance for import is 14.6 days for LA and 10.8 days for ASEAN enterprises. By country, enterprises in Brazil are at the greatest disadvantage. It takes 17.7 days and 20.6 days for them to clear customs for exports and imports respectively. In contrast, enterprises in Indonesia spend only 3.2 days for export and 5.5 days for import customs clearance. Among the ASEAN countries, customs clearance in the Philippines is as time-consuming as in LA countries. Especially the average days for export customs clearance in the Philippines, at 11.1, is the second longest among the eight countries after Brazil. The costly customs procedures in the Philippines may be reflected partially in its higher score (0.84) of customs and trade regulations perceived as obstacles to the operation of the enterprises when compared with Indonesia and Vietnam (about 0.5 for both countries). A commonality among the eight countries is that it takes more days to clear import than export customs, presumably because their governments require more simplified procedures for exports than imports to facilitate and promote exportation by firms.
5
Table 1: Summary Statistics
Variable Obs Mean Std. Dev. Min Max Inventory of inputs 5513 34.586 50.289 1 730 ln (Inventory of inputs) 5513 2.768 1.346 0 6.593 Export intensity 5513 11.640 26.579 0 100 Trade obstacles 5513 0.949 1.182 0 4 Customs for imports 2061 13.435 18.386 1 180 ln (Customs for imports) 2061 1.946 1.127 0 5.193 Customs for exports 1664 7.922 12.184 1 180 ln (Customs for exports) 1664 1.421 1.079 0 5.193 Foreign inputs 5513 29.925 33.762 0 100 E-mail 5513 0.845 0.362 0 1 Employees 5513 183.953 658.513 1 21955 ln (Employees) 5513 3.851 1.511 0 9.997 Foreign ownership 5513 11.178 30.000 0 100 Exporters 5513 0.302 0.459 0 1 Importers 5513 0.628 0.483 0 1 ASEAN 5513 0.364 0.481 0 1 <Country Dummy> Indonesia 5513 0.144 0.351 0 1 Philippines 5513 0.116 0.320 0 1 Vietnam 5513 0.104 0.306 0 1 Brazil 5513 0.125 0.331 0 1 Chile 5513 0.130 0.337 0 1 Colombia 5513 0.109 0.312 0 1 Mexico 5513 0.158 0.365 0 1 Peru 5513 0.113 0.316 0 1 <Industry Dummy> ISIC 15 or 16 5513 0.159 0.366 0 1 ISIC 17 5513 0.089 0.284 0 1 ISIC 18 5513 0.129 0.335 0 1 ISIC 19 5513 0.027 0.162 0 1 ISIC 20 5513 0.017 0.127 0 1 ISIC 21 5513 0.009 0.094 0 1 ISIC 22 5513 0.015 0.121 0 1 ISIC 23 or 24 5513 0.125 0.331 0 1 ISIC 25 5513 0.099 0.298 0 1 ISIC 26 5513 0.062 0.242 0 1 ISIC 27 5513 0.015 0.121 0 1 ISIC 28 5513 0.106 0.308 0 1 ISIC 29 5513 0.047 0.212 0 1 ISIC 30 or 31 5513 0.024 0.155 0 1 ISIC 32 5513 0.004 0.066 0 1 ISIC 33 5513 0.003 0.050 0 1 ISIC 34 5513 0.017 0.129 0 1 ISIC 35 5513 0.004 0.063 0 1 ISIC 36 5513 0.048 0.213 0 1 ISIC 37 5513 0.002 0.045 0 1
6
Table 2: Mean of Variables by Country and Region
Variables ID PH VN BR CL CO MX PE ASEAN LA Inventory of inputs 21.88 33.57 37.92 26.73 47.86 39.32 27.80 47.08 30.19 37.10 Export intensity 10.18 16.57 25.09 3.16 8.92 8.20 8.28 16.59 16.48 8.86 Trade obstacles 0.55 0.84 0.51 1.69 0.78 1.02 1.07 1.11 0.63 1.13 Customs for imports 5.46 13.54 10.45 20.62 11.98 14.00 11.87 17.57 10.84 14.60 Customs for exports 3.16 11.06 5.15 17.65 5.46 8.46 7.41 8.61 6.29 8.72 Foreign inputs 12.05 41.13 37.35 14.70 41.90 34.50 26.28 38.15 28.54 30.72 E-mail 0.35 0.82 0.86 0.96 0.96 0.99 0.93 0.97 0.65 0.96 Employees 162.58 132.54 308.87 201.21 120.48 118.67 222.46 211.84 194.98 177.63 Foreign ownership 8.34 22.56 16.92 5.87 11.05 7.13 9.43 10.23 15.31 8.81 Exporters 0.19 0.25 0.41 0.19 0.31 0.37 0.31 0.44 0.27 0.32 Importers 0.25 0.64 0.63 0.47 0.79 0.76 0.71 0.86 0.48 0.71 ASEAN 1 1 1 0 0 0 0 0 1 0 ISIC 15 or 16 0.14 0.12 0.15 0.12 0.24 0.20 0.12 0.20 0.14 0.17 <Industry Dummy> ISIC 17 0.17 0.01 0.13 0.12 0.09 0.08 0.02 0.08 0.11 0.08 ISIC 18 0.13 0.11 0.17 0.14 0.07 0.17 0.11 0.15 0.14 0.12 ISIC 19 0.01 0.00 0.02 0.10 0.01 0.02 0.02 0.03 0.01 0.04 ISIC 20 0.04 0.01 0.04 0.01 0.02 0.00 0.00 0 0.03 0.01 ISIC 21 0.00 0.01 0.03 0.00 0.01 0.00 0.00 0.01 0.01 0.01 ISIC 22 0.01 0.01 0.01 0 0.03 0.02 0.01 0.03 0.01 0.02 ISIC 23 or 24 0.12 0.15 0.03 0.11 0.11 0.16 0.14 0.16 0.11 0.14 ISIC 25 0.13 0.19 0.03 0.01 0.11 0.08 0.15 0.05 0.12 0.09 ISIC 26 0.16 0.11 0.15 0 0.04 0.01 0.02 0.02 0.14 0.02 ISIC 27 0.01 0.01 0.03 0.00 0.02 0.02 0.01 0.01 0.02 0.01 ISIC 28 0.01 0.02 0.12 0.03 0.19 0.17 0.15 0.17 0.05 0.14 ISIC 29 0.01 0.01 0.04 0.11 0.03 0.04 0.10 0.03 0.02 0.06 ISIC 30 or 31 0.00 0.11 0.03 0.01 0.01 0.01 0.02 0.02 0.05 0.01 ISIC 32 0 0.03 0.01 0.00 0 0 0 0 0.01 0.00 ISIC 33 0.00 0.01 0 0.00 0 0.00 0.00 0.00 0.00 0.00 ISIC 34 0.01 0.01 0 0.09 0.01 0.01 0.00 0.01 0.01 0.02 ISIC 35 0.00 0.01 0.01 0.01 0.00 0 0.00 0.00 0.01 0.00 ISIC 36 0.03 0.05 0.01 0.12 0.01 0.01 0.11 0.01 0.03 0.06 ISIC 37 0.00 0.00 0 0.00 0.00 0.00 0.00 0.00 0.00 0.00 Observations 795 638 576 691 718 603 870 622 2009 3504
Notes: ID (Indoensia), PH (Philippines), VN (Vientma), BR (Brazil), CL (Chile), CO (Colombia), MX (Mexico), PE (Peru), LA (Latin America).
7 3. Results of the Regressions
3.1. The model
The descriptive statistics in tables 1 and 2 indicate that although the observed enterprises in LA include more exporters than the samples for ASEAN, the export intensity of enterprises in ASEAN is higher than that of enterprises in LA. Enterprises in LA are in an unfavorable business environment for internationalizing their corporate activities compared with enterprises in ASEAN. On average, it takes more days for LA enterprises to clear export and import customs than for ASEAN enterprises. Subjective assessment on how severe customs and trade regulations are as operational obstacles provide supportive evidence of the disadvantageous business environment faced by enterprises in LA. What is worse is that enterprises in LA tend to build up more inventory of their most important input than do those in ASEAN.
The observations based on the descriptive statistics raise research questions concerning whether the inventory level of inputs and obstacles to trade hinder exportation, whether firms dependent on imported inputs need to hold a higher inventory level of inputs than domestic-oriented firms in order to secure foreign markets, and what factors make differences in export intensity between enterprises in ASEAN and LA. The results of the regressions presented in the following subsections were performed to find a clue to answer these questions and understand the beneficial conditions that enterprises in ASEAN can enjoy, in other words, the disadvantageous business conditions faced by enterprises in LA and policy issues for the governments in LA.
The dependent variables for the regression are exportation and inventory level of the most important input. For the regression of exportation, two dependent variables are introduced for the analysis in this paper. One is export propensity and the other is export intensity. The main independent variables are inventory level of the most important input, and trade barriers (trade obstacles and customs clearance for exports and imports). Thus basic regression models are formulated as below.
Export propensity = α + β1 * inventory of inputs + β2 * trade barriers + γ * control variables + ε. Export intensity = α + β1 * inventory of inputs + β2 * trade barriers + γ * control variables + ε.
The variable for export propensity is defined as a dummy variable for exporter coded 1 if an enterprise is an exporter, otherwise 0. On the other hand, the variable for export intensity is export over total sales. Thus, binary probit estimation is performed for the regression of export propensity, and ordinary least squares (OLS) can be applied to the regression of export intensity. The models also include control variables such as imported inputs, use of e-mail, foreign ownership, and dummy variables for exporters and importers, country/region, and industry.
For the regression of inventory level of inputs, the dependent variable is the natural logarithm of days of inventory of most important inputs. The main independent variables are indicators for trade barriers. Including the control variables included in the regression models for exports shown above, the regression of inventory level of inputs is formulated as below and estimated by ordinary least squares (OLS).
ln (inventory of inputs) = α + β1 * trade barriers + γ * control variables + ε.
8
3.2. Regression of export propensity on inventory of inputs and trade obstacles
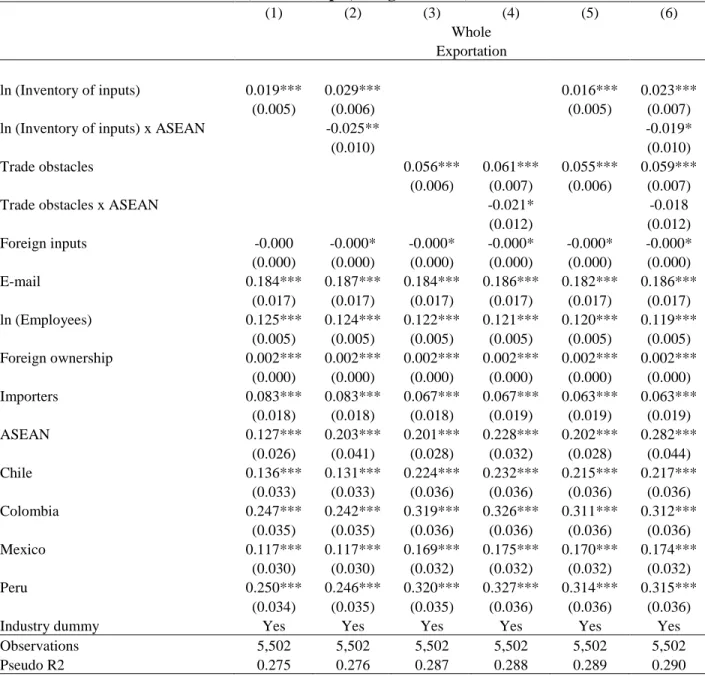
The first regression model seeks to identify factors that encourage firms to be exporters. Binary probit estimations are applied to examine whether export propensity is correlated with the main independent variables such as natural logarithm of inventory of inputs and trade obstacles. Table 3 summarizes the estimated marginal effects of the probit regressions. Columns 1 and 3 of Table 3 show positively significant coefficients on inventory of inputs and trade obstacles at the 1% level when each of these independent variables is included in the model individually. Coefficients on both main independent variables are still positively significant at the 1% level when both of them are introduced into the estimation simultaneously.
The interactions between inventory of inputs and dummy variable for ASEAN and between trade obstacles and ASEAN dummy are plugged into the regressions to measure the difference between ASEAN and LA enterprises. In column 2, the coefficient on inventory of inputs is positive at the 1% significance level, while the coefficient on its interaction with the ASEAN dummy is negatively significant at the 5% level. Column 4 shows a positively significant coefficient on trade obstacles at the 1% level and a negative coefficient on its interaction with ASEAN at the 10% significance level. The estimation in column 6 includes both pairs of the independent variables. The coefficients on inventory of inputs and trade obstacles are still positively significant at the 1% level. However, the significance of the negative coefficient on the interaction between inventory of inputs and ASEAN dummy decreased to the 10% level and the coefficient on the interaction between trade obstacles and ASEAN dummy became insignificant.
The estimated coefficients are marginal effects indicating that a 1% increase in inventory of inputs raises the probability of being an exporter by 1.9% in the model shown in column 1. Columns 1, 3, and 5 indicate that a 1% increase in inventory of inputs and a 1 point increase in trade obstacles enhance the odds of being an exporter by around 1.6-1.9% and 5.5-5.6% respectively. When the cross-product terms are included in the estimations, the reference cases are Latin America. Therefore, columns 1, 3, and 5 suggest that a 1% increase in inventory of inputs and a 1 point increase in trade obstacles enhance the odds of enterprises in Latin America being exporters by around 2.3-2.9% and 5.9-6.1% respectively. The marginal effects of inventory of inputs for enterprises in ASEAN are the sum of coefficients on inventory of inputs and the interaction between inventory of inputs and ASEAN dummy. Thus, the marginal effects of inventory of inputs for both columns 2 and 4 are about 0.004 (0.4%), which are not significantly different from 0 according to statistical tests of the linear hypothesis after estimations. In the same manner, the marginal effects of trade obstacles for enterprises in ASEAN estimated in columns 4 and 6 are around 0.04 (4%), which are significantly different from 0 but do not necessarily show significant differences between enterprises in ASEAN and LA because the interaction is significant only at the 10% level in column 4.
In sum, enterprises that hold a higher inventory level of inputs are more like to be exporters. These findings are more applicable to enterprises in LA. Although enterprises that recognize customs and trade regulations as more serious obstacles are also more likely to be exporters, there are not significant differences in the impact of perception on trade obstacles between enterprises in ASEAN and LA. Finally, what should be noted is that the estimated model does not necessarily verify causal relationships. Thus the positive marginal effects of inventory inputs
9
can be interpreted as exporting enterprises needing to build more inventories of inputs than non-exporting firms for any reason, or exporters are more capable of inventory management so that they can hold a higher level of inventory than non-exporters at the same cost. In the same manner, exporters’ operations are more relevant to customs and trade regulations so that they have more opportunities to perceive them as obstacles through their daily operations than do non-exporting enterprises.
Table 3: Binary Probit Regression of Exportation on Inventory of Inputs and Trade Obstacles (Whole sample, marginal effect)
(1) (2) (3) (4) (5) (6) Whole Exportation ln (Inventory of inputs) 0.019*** 0.029*** 0.016*** 0.023*** (0.005) (0.006) (0.005) (0.007) ln (Inventory of inputs) x ASEAN -0.025** -0.019* (0.010) (0.010) Trade obstacles 0.056*** 0.061*** 0.055*** 0.059***
(0.006) (0.007) (0.006) (0.007) Trade obstacles x ASEAN -0.021* -0.018 (0.012) (0.012) Foreign inputs -0.000 -0.000* -0.000* -0.000* -0.000* -0.000* (0.000) (0.000) (0.000) (0.000) (0.000) (0.000) E-mail 0.184*** 0.187*** 0.184*** 0.186*** 0.182*** 0.186*** (0.017) (0.017) (0.017) (0.017) (0.017) (0.017) ln (Employees) 0.125*** 0.124*** 0.122*** 0.121*** 0.120*** 0.119*** (0.005) (0.005) (0.005) (0.005) (0.005) (0.005) Foreign ownership 0.002*** 0.002*** 0.002*** 0.002*** 0.002*** 0.002*** (0.000) (0.000) (0.000) (0.000) (0.000) (0.000) Importers 0.083*** 0.083*** 0.067*** 0.067*** 0.063*** 0.063*** (0.018) (0.018) (0.018) (0.019) (0.019) (0.019) ASEAN 0.127*** 0.203*** 0.201*** 0.228*** 0.202*** 0.282*** (0.026) (0.041) (0.028) (0.032) (0.028) (0.044) Chile 0.136*** 0.131*** 0.224*** 0.232*** 0.215*** 0.217*** (0.033) (0.033) (0.036) (0.036) (0.036) (0.036) Colombia 0.247*** 0.242*** 0.319*** 0.326*** 0.311*** 0.312*** (0.035) (0.035) (0.036) (0.036) (0.036) (0.036) Mexico 0.117*** 0.117*** 0.169*** 0.175*** 0.170*** 0.174*** (0.030) (0.030) (0.032) (0.032) (0.032) (0.032) Peru 0.250*** 0.246*** 0.320*** 0.327*** 0.314*** 0.315*** (0.034) (0.035) (0.035) (0.036) (0.036) (0.036) Industry dummy Yes Yes Yes Yes Yes Yes Observations 5,502 5,502 5,502 5,502 5,502 5,502 Pseudo R2 0.275 0.276 0.287 0.288 0.289 0.290
Notes: Standard errors in parentheses, *** p<0.01, ** p<0.05, * p<0.1. The 11 observations for ISIC 37 were dropped and not used.
10
3.3. Regression of export intensity on inventory of inputs and trade obstacles
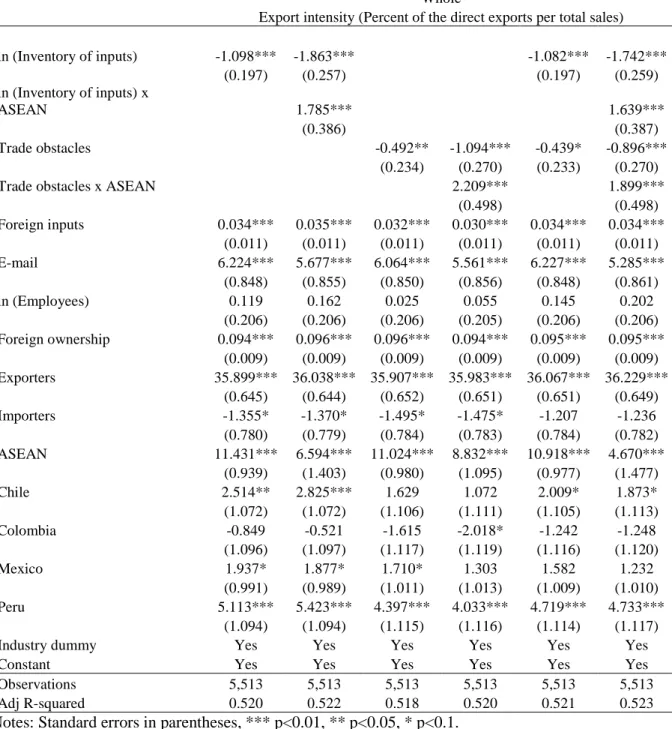
The second regression model examines whether export intensity defined as export ratio is correlated with inventory of inputs and trade obstacles. The regression of export intensity on the same independent and control variables as those used for the model shown in Table 3 were estimated by ordinary least squares (OLS). The estimation results are presented in Table 4.
Columns 1 and 3 of Table 4 show that export intensity is negatively correlated with inventory level of inputs and trade obstacles at the 1% and 5% significance levels respectively when each of these key independent variables is included in the estimation individually. The coefficient of inventory level of inputs is negatively significant at the 1% level but that for trade obstacles is negative only at the 10% significance level when these independent variables are included simultaneously in the regression (column 5).
Columns 2, 4 and 6 are the estimation results of the model with interactions between each of the key independent variables and the dummy variable for ASEAN to detect the difference between enterprises in ASEAN and LA. Column 2 shows a negative effect of inventory of inputs on export intensity at the 1% level for enterprises in LA, which is the reference case. The interaction term in column 2 is positively significant at the 1% level and the effect for ASEAN is not significantly different from 0. Column 4 provides a negative coefficient on trade obstacles and its positive interaction with the dummy for ASEAN at the 1% significance level. The impact of trade obstacles is negative for enterprises in LA but positive for those in ASEAN. The same estimation result was obtained when inventory of inputs, obstacles and the interactions with the dummy for ASEAN are included simultaneously in the model (column 6). These results indicate that inventory of inputs and trade obstacles have negative impacts on export intensity for enterprises in LA, whereas export-oriented firms in ASEAN consider customs and trade regulations as obstacles more seriously than domestic-oriented enterprises.
11
Table 4: Regression of Export Intensity on Inventory of Inputs and Trade Obstacles (Whole sample)
(1) (2) (3) (4) (5) (6) Whole
Export intensity (Percent of the direct exports per total sales)
ln (Inventory of inputs) -1.098*** -1.863*** -1.082*** -1.742*** (0.197) (0.257) (0.197) (0.259) ln (Inventory of inputs) x ASEAN 1.785*** 1.639*** (0.386) (0.387) Trade obstacles -0.492** -1.094*** -0.439* -0.896*** (0.234) (0.270) (0.233) (0.270) Trade obstacles x ASEAN 2.209*** 1.899***
(0.498) (0.498) Foreign inputs 0.034*** 0.035*** 0.032*** 0.030*** 0.034*** 0.034*** (0.011) (0.011) (0.011) (0.011) (0.011) (0.011) E-mail 6.224*** 5.677*** 6.064*** 5.561*** 6.227*** 5.285*** (0.848) (0.855) (0.850) (0.856) (0.848) (0.861) ln (Employees) 0.119 0.162 0.025 0.055 0.145 0.202 (0.206) (0.206) (0.206) (0.205) (0.206) (0.206) Foreign ownership 0.094*** 0.096*** 0.096*** 0.094*** 0.095*** 0.095*** (0.009) (0.009) (0.009) (0.009) (0.009) (0.009) Exporters 35.899*** 36.038*** 35.907*** 35.983*** 36.067*** 36.229*** (0.645) (0.644) (0.652) (0.651) (0.651) (0.649) Importers -1.355* -1.370* -1.495* -1.475* -1.207 -1.236 (0.780) (0.779) (0.784) (0.783) (0.784) (0.782) ASEAN 11.431*** 6.594*** 11.024*** 8.832*** 10.918*** 4.670*** (0.939) (1.403) (0.980) (1.095) (0.977) (1.477) Chile 2.514** 2.825*** 1.629 1.072 2.009* 1.873* (1.072) (1.072) (1.106) (1.111) (1.105) (1.113) Colombia -0.849 -0.521 -1.615 -2.018* -1.242 -1.248 (1.096) (1.097) (1.117) (1.119) (1.116) (1.120) Mexico 1.937* 1.877* 1.710* 1.303 1.582 1.232 (0.991) (0.989) (1.011) (1.013) (1.009) (1.010) Peru 5.113*** 5.423*** 4.397*** 4.033*** 4.719*** 4.733*** (1.094) (1.094) (1.115) (1.116) (1.114) (1.117) Industry dummy Yes Yes Yes Yes Yes Yes Constant Yes Yes Yes Yes Yes Yes Observations 5,513 5,513 5,513 5,513 5,513 5,513 Adj R-squared 0.520 0.522 0.518 0.520 0.521 0.523
Notes: Standard errors in parentheses, *** p<0.01, ** p<0.05, * p<0.1.
3.4. Regression of export intensity on inventory of inputs and trade obstacles for exporters
Table 5 summarizes the estimation results of the same model as that of Table 4, although the observations are restricted to exporting enterprises. By using this limited sample, it becomes easier to make a comparison between tables 5 and 6. The regression model estimated in Table 6 includes the average number of days for customs clearance of exports as an independent variable. This indicator for cost of export customs clearance was specified only by exporting enterprises.
12
By restricting the observations to exporters for the estimations shown in Table 5, the influence of adding the variable for customs clearance for export into the model will be more obvious.
Table 5 demonstrates the estimated coefficients on natural logarithm of inventory of inputs are negative and significant at the 1% level, but coefficients on trade obstacles are not significant. Both interactions between inventory of inputs and ASEAN dummy and that between trade obstacles and ASEAN dummy are not significant, indicating no differences in the impact of these independent variables on export intensity between enterprises in ASEAN and LA. Only the inventory of inputs has a negative correlation with export intensity.
Table 6 reveals no significant changes in the estimated coefficients on inventory of inputs, trade obstacles, and each of their interactions with the dummy variable for ASEAN even after adding the average number of days for customs clearance of exports and its interaction with the dummy variable for ASEAN into the model estimated in Table 5.
From columns 1, 3, and 5 of Table 6, the natural logarithm of the average days for customs clearance of exports is negatively correlated with export intensity at the 1% significance level. This coefficient on customs clearance for exports remains significant at the 1% level after introducing the interaction term between the customs clearance and dummy variable for ASEAN. The estimated coefficient on the cross-product term is positively significant at the 5% level.
The effect of customs clearance on export intensity for enterprises in ASEAN is the sum of coefficients on customs clearance for exports and the interaction between customs clearance for exports and dummy variable for ASEAN. Thus, the coefficients on export customs clearance for ASEAN for columns 2, 4 and 6 are about 0.5-0.6, which are not significantly different from 0 according to statistical tests of the linear hypothesis after estimations. Contrastingly the average date of export customs clearance has a considerable negative impact on export intensity for enterprises in LA.
13
Table 5: Regression of Export Intensity on Inventory of Inputs and Trade Obstacles (Exporters)
(1) (2) (3) (4) (5) (6) Exporter
Export intensity (Percent of the direct exports per total sales)
ln (Inventory of inputs) -2.303*** -2.817*** -2.300*** -2.833*** (0.600) (0.774) (0.601) (0.775) ln (Inventory of inputs) x ASEAN 1.284 1.267 (1.220) (1.222) Trade obstacles -0.215 0.046 -0.167 0.213 (0.655) (0.790) (0.653) (0.788) Trade obstacles x ASEAN -0.822 -1.096 (1.391) (1.387) Foreign inputs 0.017 0.019 0.011 0.010 0.017 0.019 (0.028) (0.028) (0.028) (0.028) (0.028) (0.028) E-mail 4.855 4.618 4.117 4.106 4.802 4.570 (4.916) (4.921) (4.940) (4.941) (4.922) (4.927) ln (Employees) 0.569 0.594 0.350 0.347 0.568 0.592 (0.557) (0.557) (0.556) (0.557) (0.557) (0.558) Foreign ownership 0.161*** 0.162*** 0.162*** 0.162*** 0.161*** 0.162*** (0.019) (0.019) (0.020) (0.020) (0.019) (0.019) Importers -4.222* -4.239* -4.659* -4.671* -4.151* -4.191* (2.438) (2.438) (2.461) (2.462) (2.455) (2.455) ASEAN 36.788*** 33.031*** 37.048*** 38.202*** 36.546*** 34.419*** (3.212) (4.802) (3.360) (3.887) (3.348) (5.246) Chile 16.698*** 17.012*** 15.088*** 15.342*** 16.513*** 17.212*** (3.572) (3.585) (3.642) (3.667) (3.645) (3.688) Colombia 7.683** 7.893** 6.556* 6.769* 7.528** 8.059** (3.479) (3.485) (3.538) (3.557) (3.533) (3.560) Mexico 13.483*** 13.530*** 13.193*** 13.369*** 13.351*** 13.658*** (3.336) (3.336) (3.390) (3.404) (3.377) (3.391) Peru 21.115*** 21.305*** 20.038*** 20.297*** 20.921*** 21.501*** (3.384) (3.389) (3.474) (3.503) (3.468) (3.504) Industry dummy Yes Yes Yes Yes Yes Yes Constant Yes Yes Yes Yes Yes Yes Observations 1,664 1,664 1,664 1,664 1,664 1,664 Adj R-squared 0.328 0.328 0.322 0.322 0.328 0.328
14
Table 6: Regression of Export Intensity on Inventory of Inputs, Trade Obstacles, and Customs Clearance for Exports (Exporter sample)
(1) (2) (3) (4) (5) (6) Exporter
Export intensity (Percent of the direct exports per total sales)
ln (Inventory of inputs) -2.538*** -2.431*** -2.565*** -2.459*** (0.773) (0.774) (0.775) (0.775) ln (Inventory of inputs) x ASEAN 0.923 0.864 0.925 0.863 (1.218) (1.217) (1.219) (1.218) Trade obstacles 0.285 0.390 0.422 0.512 (0.788) (0.788) (0.786) (0.786) Trade obstacles x ASEAN -0.795 -1.121 -1.056 -1.346
(1.383) (1.387) (1.380) (1.384) ln (Customs for exports) -2.817*** -4.028*** -3.003*** -4.365*** -2.821*** -4.077***
(0.710) (0.886) (0.713) (0.888) (0.713) (0.890) ln (Customs for exports) x
ASEAN 3.390** 3.841** 3.519** (1.487) (1.496) (1.493) Foreign inputs 0.017 0.016 0.009 0.009 0.017 0.016 (0.028) (0.028) (0.028) (0.028) (0.028) (0.028) E-mail 4.622 4.562 4.159 4.102 4.641 4.577 (4.899) (4.893) (4.915) (4.907) (4.906) (4.899) ln (Employees) 0.510 0.604 0.279 0.395 0.509 0.606 (0.555) (0.556) (0.554) (0.555) (0.556) (0.556) Foreign ownership 0.163*** 0.164*** 0.164*** 0.164*** 0.163*** 0.164*** (0.019) (0.019) (0.019) (0.019) (0.019) (0.019) Importers -4.149* -4.138* -4.654* -4.626* -4.195* -4.186* (2.427) (2.424) (2.449) (2.445) (2.444) (2.441) ASEAN 31.165*** 26.336*** 35.370*** 30.155*** 32.757*** 28.154*** (4.803) (5.244) (3.925) (4.414) (5.239) (5.585) Chile 14.034*** 12.737*** 12.610*** 11.326*** 14.467*** 13.213*** (3.647) (3.686) (3.706) (3.733) (3.737) (3.769) Colombia 6.329* 5.789* 5.444 4.971 6.691* 6.207* (3.492) (3.495) (3.553) (3.552) (3.561) (3.562) Mexico 11.346*** 10.476*** 11.252*** 10.353*** 11.638*** 10.798*** (3.367) (3.384) (3.424) (3.436) (3.414) (3.428) Peru 19.496*** 18.802*** 18.754*** 18.122*** 19.936*** 19.308*** (3.404) (3.413) (3.504) (3.507) (3.510) (3.516) Industry dummy Yes Yes Yes Yes Yes Yes Constant Yes Yes Yes Yes Yes Yes Observations 1,664 1,664 1,664 1,664 1,664 1,664 Adj R-squared 0.334 0.336 0.329 0.331 0.334 0.336
15
3.5. Regression of inventory of inputs on trade obstacles
As illustrated above, inventory level of inputs can have negative impacts on decision made by enterprises, especially those in LA, on internationalization of their sales activities. The indicator is negatively related to the possibility for enterprises in LA to enter into foreign market (Table 3). Inventory of inputs has robust negative correlations with export intensity of both ASEAN and LA enterprises (tables 4, 5, 6). These findings from the regressions raise an additional question about factors that influence the level of input inventory at the firm level in ASEAN and LA. To examine it, the natural logarithm of days of inventory of most important input that enterprises build up, which is the independent variable for the regressions in tables 3-6, is regressed on the indicators for trade related costs that are included in the previous regressions as main independent variables.
The coefficient on customs and trade regulations or trade obstacles is positively significant at the 1% level as shown in column 1 of Table 7 when the regression is estimated with the whole sample. The introduction of an interaction term into the model does not affect the significance level of the coefficient on trade obstacles. The coefficient on the cross-product term is negatively significant at the 1% level. Thus the coefficient for enterprises in ASEAN is estimated to be around -0.06, which is significantly different from 0 at the 5% level according to the statistical test of the linear hypothesis after estimations (column 2). When the sample is restricted to exporting enterprises, the coefficient on trade obstacles is not significant in column 3. When the interaction between trade obstacles and ASEAN dummy is controlled, the coefficient on trade obstacles is weakly significant at the 10% level in column 3. The coefficient on the interaction is negatively significant at the 5% level (column 4). The estimated coefficient of trade obstacles for exporters in ASEAN is around -0.06, which is almost same as that estimated using the whole sample but insignificantly different from 0 statistically.
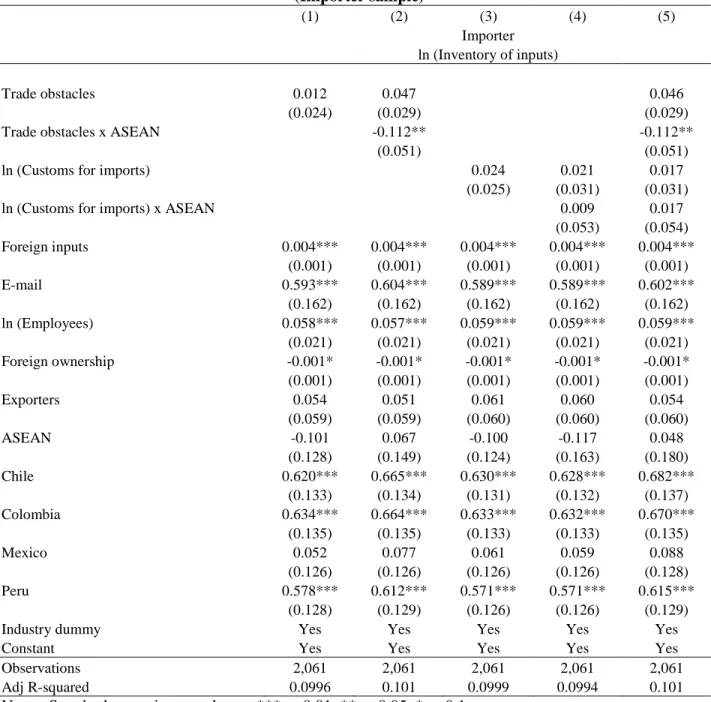
The regressions in Table 8 were estimated using the sample of importing enterprises because only importers stated the average number of days to clear customs for imported material inputs and/or suppliers, which are included in the models (columns 3-5). It is apparent from Table 8 that trade obstacles and customs clearance for imports do not have significant impacts on days of inventory of most important input that importing enterprises hold. The coefficients on interaction between trade obstacles and ASEAN dummy are negative and significant at the 5% level, but the coefficients on interaction between import customs clearance and ASEAN dummy are not significant (column 2, 4, and 5 of Table 8).
These regressions imply that enterprises in LA, probably exporting and non-importing businesses, are hampered by customs and trade regulations. The influence of trade cost to inventory of inputs that enterprises in ASEAN hold is unclear. However, the estimated negative coefficients on interaction between trade obstacles and ASEAN dummy suggest greater private efforts in ASEAN to overcome an unfavorable trade environment compared to the private sector in LA.
16
Table 7: Regression of Inventory of Inputs on Trade Obstacles (Whole and Exporter sample)
(1) (2) (3) (4) Whole Exporters ln (Inventory of inputs) Trade obstacles 0.049*** 0.091*** 0.021 0.059* (0.016) (0.018) (0.027) (0.032) Trade obstacles x ASEAN -0.152*** -0.121**
(0.034) (0.057) Foreign inputs 0.002*** 0.002*** 0.003** 0.003** (0.001) (0.001) (0.001) (0.001) E-mail 0.151*** 0.185*** 0.298 0.296 (0.058) (0.058) (0.203) (0.202) ln (Employees) 0.110*** 0.108*** 0.095*** 0.094*** (0.014) (0.014) (0.023) (0.023) Foreign ownership -0.001 -0.001 -0.000 -0.000 (0.001) (0.001) (0.001) (0.001) Exporters 0.148*** 0.143*** (0.045) (0.044) Importers 0.267*** 0.265*** 0.221** 0.219** (0.054) (0.053) (0.101) (0.101) ASEAN -0.098 0.053 -0.218 -0.048 (0.067) (0.075) (0.138) (0.159) Chile 0.352*** 0.390*** 0.619*** 0.657*** (0.076) (0.076) (0.149) (0.150) Colombia 0.344*** 0.372*** 0.422*** 0.454*** (0.076) (0.076) (0.145) (0.146) Mexico -0.119* -0.091 0.069 0.094 (0.069) (0.069) (0.139) (0.139) Peru 0.298*** 0.323*** 0.384*** 0.422*** (0.076) (0.076) (0.142) (0.143) Industry dummy Yes Yes Yes Yes Constant Yes Yes Yes Yes Observations 5,513 5,513 1,664 1,664 Adj R-squared 0.124 0.127 0.0975 0.0994
17
Table 8: Regression of Inventory of Inputs on Trade Obstacles and Customs Clearance for Imports (Importer sample) (1) (2) (3) (4) (5) Importer ln (Inventory of inputs) Trade obstacles 0.012 0.047 0.046 (0.024) (0.029) (0.029) Trade obstacles x ASEAN -0.112** -0.112**
(0.051) (0.051) ln (Customs for imports) 0.024 0.021 0.017
(0.025) (0.031) (0.031) ln (Customs for imports) x ASEAN 0.009 0.017
(0.053) (0.054) Foreign inputs 0.004*** 0.004*** 0.004*** 0.004*** 0.004*** (0.001) (0.001) (0.001) (0.001) (0.001) E-mail 0.593*** 0.604*** 0.589*** 0.589*** 0.602*** (0.162) (0.162) (0.162) (0.162) (0.162) ln (Employees) 0.058*** 0.057*** 0.059*** 0.059*** 0.059*** (0.021) (0.021) (0.021) (0.021) (0.021) Foreign ownership -0.001* -0.001* -0.001* -0.001* -0.001* (0.001) (0.001) (0.001) (0.001) (0.001) Exporters 0.054 0.051 0.061 0.060 0.054 (0.059) (0.059) (0.060) (0.060) (0.060) ASEAN -0.101 0.067 -0.100 -0.117 0.048 (0.128) (0.149) (0.124) (0.163) (0.180) Chile 0.620*** 0.665*** 0.630*** 0.628*** 0.682*** (0.133) (0.134) (0.131) (0.132) (0.137) Colombia 0.634*** 0.664*** 0.633*** 0.632*** 0.670*** (0.135) (0.135) (0.133) (0.133) (0.135) Mexico 0.052 0.077 0.061 0.059 0.088 (0.126) (0.126) (0.126) (0.126) (0.128) Peru 0.578*** 0.612*** 0.571*** 0.571*** 0.615*** (0.128) (0.129) (0.126) (0.126) (0.129) Industry dummy Yes Yes Yes Yes Yes Constant Yes Yes Yes Yes Yes Observations 2,061 2,061 2,061 2,061 2,061 Adj R-squared 0.0996 0.101 0.0999 0.0994 0.101
Notes: Standard errors in parentheses, *** p<0.01, ** p<0.05, * p<0.1.
4. Conclusions
The results of the regressions suggest a robust association between inventory of inputs and export performance at the firm level for Latin America. From the regression of export propensity, firms in Latin America build larger inventory of inputs. They also suffer from negative impacts of inventory of inputs on export intensity. In contrast, these effects are not significantly large for enterprises in Southeast Asia.
18
The positive association between inventory of inputs and export propensity may imply lack of supporting industries and dependency on imported inputs in Latin America. But as Golini and Kalchschmidt (2011) suggest, global sourcing can increase the inventory level of materials. Han et al. (2008) found that imports and exports have a positive significant impact on the inventory of raw materials and finished goods that the US manufacturing sector builds up. The positive significant coefficients on inventory of inputs in Table 3 and dummy variable for exports and importers in the columns 1 and 2 of Table 7 coincide with Han et al. (2008). In essence, internationalized firms cannot avoid bearing higher inventory costs. Thus, the problem for Latin America is the negative impact of inventory of inputs on export intensity.
An additional finding suggestive for Latin America is a weaker impact of customs clearance on export intensity for Southeast Asia than Latin America. A possible interpretation is that Southeast Asia has developed a better physical and institutional infrastructure for export promotion than Latin America has done. Firms perceive foreign trade zones as beneficial and facilitating their global marketing and logistics (Tansuhaj and Gentry, 1987). As customs clearance is only a part of the trade costs and the inefficient clearance process can affect other management practices within trading firms, the finding indicates the importance of comprehensive policy measures and infrastructure development to facilitate international trade.
These comparisons between Southeast Asia and Latin America indicate the existence of unsolved problems in enterprises and the government sector in Latin America that discourage the private sector from entering deeply into global supply chains.
There are implications derived from the estimated coefficients on control variables, which have not been discussed above. First is the issue of the association between firm size and exportation. Table 3 indicates that the number of employees is positively correlated with the probability of exportation at the 1% significance level. Tables 4 and 5 show that the coefficient on the logarithm of enterprise size does not have a statistically significant impact on export intensity. The finding that larger enterprises are more likely to be exporters but that enterprise size does not matter for export intensity indicates a high fixed cost to enter foreign markets that is caused by factors other than customs and trade regulations and is not unaffordable for smaller enterprises.
These findings are also suggestive when the association between customs-related transaction costs and international trade intensity is considered (Verwaal & Donkers, 2003). Although labor force size does not have a significant correlation with export intensity as shown in tables 5 and 6, firm size can have a negative impact on export intensity through inventory of inputs, which is positively associated with the number of employees (columns 3, 4 of Table 7).
Another implication can be derived from the estimated coefficients on control variables for foreign inputs (per total inputs and supplies) and importer dummy. As shown Table 3, importer dummy has a positively significant impact on the probability of an enterprise becoming an exporter at the 1% level, indicating importers are more likely to be exporters. The coefficients on foreign inputs estimated in Table 3 are negatively significant at the 10% level, suggesting that enterprises that become exporters are more dependent on domestic sources of inputs. In contrast, if the sample is restricted to exporting enterprises, their export intensity is negatively correlated with the dummy variable for importers at the 10% level and is not associated with foreign inputs (Table 5). These findings from tables 3 and 5 tell us that enterprises need to use imported inputs to enter into foreign markets. On the other hand, domestically sourced inputs are also important
19
for exporters to enhance their export intensity. This finding suggests the importance of industrial agglomeration for export-oriented industrial policy. However, the mixed results shown in Table 4 of positively significant coefficients on foreign inputs at the 1% level and negative ones on the importer dummy at the 10% level, tell us that these estimations require further and more detailed study, taking into consideration differences in the degree of agglomeration, characteristics of countries or industries, destinations of exports or origins of imports, and other factors that may affect firm-level export intensity.
Also further elaborations of the analysis are needed to explore the factors that create differences between Asia and Latin America, and to mitigate problems in the estimation methods of regressions such as endogeneity and selection.
Appendex Table A1: List of Variables
Variables Definition
Inventory of inputs Days of inventory of most important inputs, measured in days of production ln (Inventory of inputs) Natural logarithm of variable Inventory of inputs
Export intensity Percent of the direct exports per total sales
Exporters Coded 1 if variable Export is positive, otherwise 0
Trade obstacles Customs and trade regulations are No Obstacle (0), a Minor Obstacle (1), a Moderate obstacle (2), a Major Obstacle (3), or a Very Severe Obstacle (4) the current operations of the respondent establishment
Customs for imports Average number of days to clear customs for imported material inputs and/or supplies
ln (Customs for imports) Natural logarithm of variable Customs for imports
Customs for exports Average number of days to clear customs for exported goods directly ln (Customs for exports) Natural logarithm of variable Customs for exports
Foreign inputs Percentage of material inputs and/or supplies of foreign origin per total inputs and/or supplies
E-mail The respondent establishment use e-mail in its communications with clients or suppliers
Employees Number of permanent, full-time employees at the end of fiscal year ln (Employees) Natural logarithm of variable Employees
Foreign ownership Percent of the respondent firm owned by private foreign individuals, companies or organizations
Importers Coded 1 if variable Foreign inputs is positive, otherwise 0
ASEAN Coded 1 if variable Indonesia, Philippines, or Vietnam is coded 1, otherwise 0
Notes: Country dummy and industry dummy shown in Table 1 are omitted.
References
Alvarez, R., & López, R.A. (2005). Exporting and performance: evidence from Chilean plants. Canadian Journal of Economics, 38(4), 1384-1400.
Amiti, M., & Konings, J. (2007). Trade liberalization, intermediate inputs, and productivity: Evidence from Indonesia. American Economic Review, 97(5): 1611-1638.
20
Baldwin, J.R. & Gu, W. (2004). Trade liberalization: export-market participation, productivity growth, and innovation. Oxford Review of Economic Policy, 20(3), 372-392.
Baldwin R. (2011). Trade and industrialisation after globalisation’s 2nd unbundling: How building and joining a supply chain are different and why it matters. NBER Working Paper 17716.
Baldwin R., & Lopez-Gonzalez, J. (2013). Supply-chain trade: A portrait of global patterns and several testable hypotheses. NBER Working Paper 18957.
Beamon, B.M. (1999). Measuring supply chain performance. International Journal of Operations & Production Management, 19(3), 275-292.
Blalock, G., & Veloso, F.M. (2007). Imports, Productivity Growth, and Supply Chain Learning. World Development, 35(7), 1134-1151.
Golini R., & Kalchschmidt, M. (2011). Moderating the impact of global sourcing on inventories through supply chain management. International Journal of Production Economics, 133(1), 86-94.
Han, C., Dresner, M., & Windle, R.J. (2008). Impact of global sourcing and exports on US manufacturing inventories. International Journal of Physical Distribution & Logistics Management, 38(6), 475-494.
Hayakawa, K., Machikita, M., & Kimura, F. (2012). Globalization and productivity: A survey of firm-level analysis. Journal of Economic Surveys, 26(2), 332-350.
Kasahara, H. & Rodrigue, J. (2008) Does the use of imported intermediates increase productivity? Plant-level evidence. Journal of Development Economics, 87(1), 106-118.
Kimura, F., & Ando, M. (2005). Two-dimensional fragmentation in East Asia: Conceptual framework and empirics. International Review of Economics & Finance, 14(3), 317-348.
Kinra, A., & Kotzab, H. (2008). A macro-institutional perspective on supply chain environmental complexity. International Journal of Production Economics, 115(2), 283-295. Machikita, T. & Ueki, Y. (2011). Innovation in linked and non-linked firms: Effects of variety of
linkages in East Asia. International Journal of Institutions and Economies, 3(1), 77-102.
Machikita, T. & Ueki, Y. (2012). Interactive learning–driven innovation within production chains in developing economies. International Journal of Technological Learning, Innovation and Development, 5(4), 346-366.
OECD (2009). Overcoming Border Bottlenecks: The Costs and Benefits of Trade Facilitation. Paris: Organisation for Economic Co-Operation and Development.
Tansuhaj, P.S., & Gentry, J.W. (1987). Firm differences in perceptions of the facilitating role of foreign trade zones in global marketing and logistics, Journal of International Business Studies, 18(1), 19-33.
Paus, E., Reinhardt, N., & Robinson, M. (2003). Trade liberalization and productivity growth in Latin American Manufacturing, 1970–98. Policy Reform, 6(1), 1-15.
21
Portugal-Perez, A. & Wilson, J.S. (2012). Export performance and trade facilitation reform: Hard and soft infrastructure. World Development, 40(7), 1295-1307.
Schwab, K., & World Economic Forum (eds.) (2013). The Global Competitiveness Report 2013-2014: Full Data Edition, Geneva; World Economic Forum. http://www3.weforum.org/docs/WEF_GlobalCompetitivenessReport_2013-14.pdf
Shepherd, B. & Wilson, J.S. (2009). Trade facilitation in ASEAN member countries: Measuring progress and assessing priorities. Journal of Asian Economics, 20(4), 367-383.
Tansuhaj, P.S., & Gentry, J.W. (1987). Firm differences in perceptions of the facilitating role of foreign trade zones in global marketing and logistics. Journal of International Business Studies, 18(1), 19-33.
Verwaal, E., & Donkers, B. (2003). Customs-related transaction costs, firm size and international trade intensity. Small Business Economics, 21(3), 257-271.
Wagner, J. (2012). International trade and firm performance: A survey of empirical studies since 2006. Review of World Economics, 148(2), 235-267.
Wilson, J.S., Mann, .L. & Otsuki, T. (2003). Trade facilitation and economic development: A new approach to quantifying the impact. World Bank Economic Review, 17(3), 367-389.
Wilson, J.S., Mann, .L. & Otsuki, T. (2005). Assessing the Benefits of Trade Facilitation: A Global Perspective. The World Economy, 28(6), 841-871.