Lerner meets metzler : tariff pass-through of
worldwide trade
著者
Kazunobu Hayakawa
権利
Copyrights 日本貿易振興機構(ジェトロ)アジア
経済研究所 / Institute of Developing
Economies, Japan External Trade Organization
(IDE-JETRO) http://www.ide.go.jp
journal or
publication title
IDE Discussion Paper
volume
741
year
2019-02
INSTITUTE OF DEVELOPING ECONOMIES
IDE Discussion Papers are preliminary materials circulated to stimulate discussions and critical comments
Keywords: Tariff pass-through; Import prices; Quality JEL classification: F15, F53
* Senior Research Fellow, Economic Geography Studies Group, Development Studies Center, IDE ([email protected])
IDE DISCUSSION PAPER No. 741
Lerner Meets Metzler: Tariff
Pass-through of Worldwide Trade
Kazunobu HAYAKAWA*, Tadashi ITO, and
Hiroshi MUKUNOKI
February 2019
Abstract: In this paper, we start with quantifying the worldwide tariff pass-through, i.e., the impact of tariff
reductions on trade prices. We find that a 1% reduction of tariffs decreases trade prices by 0.1%, i.e., a negative tariff pass-through (Lerner paradox). To uncover the mechanism underlying this result, we decompose trade prices into product quality and quality-adjusted trade prices. As a result, we found that a 1% reduction of tariff rates decreases product quality by 1.2% and increases quality-adjusted trade prices by 1.1% (Metzler paradox). We construct a theoretical model that demonstrates the mechanism behind these empirical results. We suggest that both a firm-delocation mechanism under variable markups and a quality-sorting mechanism are the driving forces behind these empirical findings. Lastly, by employing this theoretical model, we also examine the welfare effect of tariff changes.
The Institute of Developing Economies (IDE) is a semigovernmental, nonpartisan, nonprofit research institute, founded in 1958. The Institute merged with the Japan External Trade Organization (JETRO) on July 1, 1998.
The Institute conducts basic and comprehensive studies on economic and related affairs in all developing countries and regions, including Asia, the Middle East, Africa, Latin America, Oceania, and Eastern Europe.
The views expressed in this publication are those of the author(s). Publication does not imply endorsement by the Institute of Developing Economies of any of the views expressed within.
INSTITUTE OF DEVELOPING ECONOMIES (IDE), JETRO 3-2-2, WAKABA,MIHAMA-KU,CHIBA-SHI
CHIBA 261-8545, JAPAN
©2019 by Institute of Developing Economies, JETRO
No part of this publication may be reproduced without the prior permission of the IDE-JETRO.
1
Lerner Meets Metzler:
Tariff Pass-through of Worldwide Trade
Kazunobu HAYAKAWA#§Institute of Developing Economies, Japan
Tadashi ITO
Faculty of International Social Sciences, Gakushuin University, Japan
Hiroshi MUKUNOKI
Faculty of Economics, Gakushuin University, Japan
Abstract: In this paper, we start with quantifying the worldwide tariff pass-through, i.e., the impact of
tariff reductions on trade prices. We find that a 1% reduction of tariffs decreases trade prices by 0.1%, i.e., a negative tariff pass-through (Lerner paradox). To uncover the mechanism underlying this result, we decompose trade prices into product quality and quality-adjusted trade prices. As a result, we found that a 1% reduction of tariff rates decreases product quality by 1.2% and increases quality-adjusted trade prices by 1.1% (Metzler paradox). We construct a theoretical model that demonstrates the mechanism behind these empirical results. We suggest that both a firm-delocation mechanism under variable markups and a quality-sorting mechanism are the driving forces behind these empirical findings. Lastly, by employing this theoretical model, we also examine the welfare effect of tariff changes.
Keywords: Tariff pass-through; Import prices; Quality JEL Classification: F15; F53
1. Introduction
The impact of a tariff reduction or elimination on trade prices, a so-called “tariff through,” has long been studied in the international economics literature. Tariff pass-through is vital in considerations of whether and to what extent trade liberalization benefits households (Han et al., 2016) and whether it is a pro-poor policy in liberalizing countries (Marchand, 2012). Empirical findings on tariff pass-through are also important when we consider what kind of international trade rules should be set up. Bagwell and Staiger (1999)
# Corresponding author: Kazunobu Hayakawa; Address: Wakaba 3-2-2, Mihama-ku, Chiba-shi, Chiba,
261-8545, Japan. Tel: 81-43-299-9500; Fax: 81-43-299-9724; E-mail: [email protected].
§ We would like to thank Jota Ishikawa, Jun-ichi Itaya, Naoto Jinji, and the seminar participants at the 8th
Spring Meeting of the JSIE and the Institute of Developing Economies. This work was supported by JSPS KAKENHI Grant Number 26705002, 17K03706, 17K03707, and 17H02530.
2
have theoretically shown that tariff reforms under a particular form of reciprocity rule improve all countries’ welfare. However, depending on the magnitude and direction of the pass-through, this result of Bagwell and Staiger (1999) could be overturned (Bagwell and Staiger, 2016).1 Understanding tariff pass-through is thus an essential issue for evaluating
the effects of trade liberalization.
There are various possible degrees and directions of tariff pass-through. For instance, suppose that a country reduces its import tariff on a particular product. If foreign firms’ export prices of that product remain unchanged, this tariff reduction is perfectly passed through to the consumer price, and consumers in that country fully capture the rents from this trade liberalization.2 On the other hand, if the foreign firms raise their export prices in
response to the tariff reduction, part of the rents goes to these firms, and the importing country’s terms of trade deteriorate. Furthermore, if the increases in export prices are large enough, trade liberalization may even raise the consumer price in the importing country. Such an unusual consequence is known as a “Metzler paradox” (Metzler, 1949). Conversely, the possibility exists that a tariff reduction decreases export prices and consumers would gain more than the extent of tariff reduction, thereby improving the importing country’s terms of trade. This case is referred to as a “Lerner paradox” (Lerner, 1936).
Existing empirical studies have quantified the tariff pass-through for particular countries, particular products such as textiles and apparel, and particular tariff preference schemes, such as Generalized System of Preferences (GSP). An early empirical work on the issue is that of Feenstra (1989), who investigated the tariff pass-through in the US imports from Japan using product-level import data. By employing firm-level export data, Ludema and Yu (2016) and Görg et al. (2017) investigated the tariff pass-through when exporting from the US and Hungary, respectively. Several studies have examined the effects of tariff reduction through preferential/regional trade agreements (RTAs) (Cadot et al., 2005; Olarreaga and Ozden, 2005; Ozden and Sharma, 2006; Cirera, 2014). These studies have found an incomplete tariff pass-through, i.e., only part of tariff reductions is passed onto trade prices. Among others, the firm-level study by Ludema and Yu (2016) showed that the Metzler paradox is possible because a tariff reduction may increase consumer prices in some cases.3
In this paper, we start with quantifying and investigating the worldwide tariff pass-through. Surprisingly, estimates of the tariff pass-through on worldwide trade are not available in the literature. One critical reason for unavailability of such estimates is that a ready-made database on worldwide tariffs had not been available until recently. Such a
1 Raimondos and Woodland (2018) proposed an alternative rule of reciprocity in tariff reforms that
improves welfare without any assumptions regarding the price effects of tariff changes.
2 In this paper, we do not differentiate among export prices, import prices, and trade prices, but use those
three prices interchangeably. All these terms mean tariff-exclusive prices in this paper. Tariff-inclusive prices are called “consumer prices” in this paper.
3 They called the case “quasi-Metzler paradox” because quality changes are reflected in their price
3
database is now provided by the World Integrated Trade Solution (WITS). The database includes information on various kinds of tariff schemes, such as most favored nation (MFN), RTAs, or the GSP in almost all countries worldwide. Combining such tariff information with data on unit trade prices drawn from UN Comtrade, we estimate the global average of tariff pass-through. Our dataset includes bilateral trade between 70 importers and 172 exporters during 1992–2014, at the harmonized system (HS) six-digit level. Surprisingly, we found a robust result that the tariff reduction decreases trade prices, i.e., negative tariff pass-through. Specifically, it shows that a 1% reduction of (one plus) tariffs decreases trade prices by 0.1%. To elucidate the mechanism underlying our result of this negative tariff pass-through, we decompose trade prices into product quality and quality-adjusted trade prices by employing the method proposed by Khandelwal et al. (2013). As a result, we found that a 1% reduction of (one-plus) tariff rates decreases product quality by 1.2% and increases quality-adjusted trade prices by 1.1%. As found above, for gross trade prices, the net effect is a 0.1% fall. The positive relationship between tariffs and quality is a key factor behind the negative pass-through. Namely, because the effect on product quality is absolutely larger than that on quality-adjusted prices, the net effect on gross trade prices becomes negative. In other words, we found a Lerner paradox for gross prices. This result is in sharp contrast with that of Ludema and Yu (2016), who theoretically and empirically found that a Metzler paradox is possible in that trade liberalization can increase consumer prices by enhancing quality upgrading of exported products. Furthermore, our results suggest that a 1% tariff reduction increases quality-adjusted trade prices by more than 1%, which implies that trade liberalization increases quality-adjusted consumer prices (i.e., Metzler paradox). In other words, Lerner meets Metzler in the sense that we observe a Metzler paradox for the quality-adjusted price and a Lerner paradox for the gross price at the same time.
Several theoretical studies might be useful to understand these empirical results. Some papers have clarified that unilateral trade liberalization may result in a Metzler paradox (Venables, 1987; Bagwell and Staiger, 2012; Bagwell and Lee, 2015).4 Among them, Bagwell
and Lee (2015) extended the heterogeneous-firm trade model of Melitz and Ottaviano (2008) and showed that a lower import tariff causes a firm-delocation effect, which reduces the competitiveness of the domestic market and raises the product-average consumer price.5
Some papers have considered changes in product quality within the same framework (Antoniades, 2015: Ludema and Yu, 2016) and demonstrated that quality changes might lead to a Metzler paradox for gross prices at the firm level. Because we use product-level data on worldwide trade, our estimate is the product-average tariff pass-through, rather than the firm-specific tariff pass-through. Indeed, none of these papers can explain the presences of a Lerner paradox for average gross prices.
4 Ishikawa and Mukunoki (2008) showed that a simultaneous reduction of tariffs with other importing
countries may generate a Metzler paradox.
5 Demidova (2017) showed that a Metzler paradox of Bagwell and Lee (2015) no longer holds if a
4
To formalize these empirical findings, we provide a model that incorporates both the firm-delocation mechanism of Melitz and Ottaviano (2008) and the quality-sorting mechanism of Baldwin and Harrigan (2011) or Johnson (2012). Baldwin and Harrigan (2011) and Johnson (2012) incorporated product quality into Melitz (2003) and provided a quality-sorting mechanism that explained a positive correlation between gross average export prices and bilateral trade barriers such as distance. Although these papers did not explicitly investigate the price effects of tariffs, their results indicate that quality sorting is a key mechanism behind existence of a Lerner paradox. These papers, however, did not explain the presence of a Metzler paradox for adjusted prices. By formulating a quality-sorting mechanism in a Melitz-Ottaviano type model of firm-delocation, however, our model is able to provide the concurrence of a Lerner paradox for gross average prices and a Metzler paradox for quality-adjusted average prices, which is consistent with the empirical findings on worldwide trade. Namely, although a lower tariff decreases the average consumer price of imported products, it comes with even lower quality of these products and thereby increases quality-adjusted consumer prices.
Employing this theoretical model, which is able to explain our empirical results, allows us to also examine the welfare effect of these price changes. Seemingly, unilateral trade liberalization benefits consumers in the liberalizing country because it reduces consumer prices to a greater extent than the reductions in tariffs. However, this is not necessarily the case in our model, where unilateral trade liberalization leads to a substantial decline in the average quality of imported products but an increase in the quality-adjusted consumer price. Furthermore, unilateral trade liberalization decreases the number of product varieties available for consumers. Because of these effects, it can be concluded that unilateral trade liberalization worsens consumers’ welfare in the liberalizing country. To guarantee consumer benefits from trade liberalization, additional policy instruments should accompany unilateral trade liberalization. For example, a competition policy that reduces the fixed cost of entry and enhances the domestic entry is one such possible instrument for the purpose.
In addition to the above literature on tariff pass-through, our study is related to at least two more bodies of literature. First, some studies have examined the effects of tariffs on firm performance rather than on export product prices. For example, Bustos (2011) explored the effect on firm innovation and found the statistically significant positive effects. Second, although the above literature has investigated the effects of tariffs in export destination countries, Bas and Strauss-Kahn (2015) and Fan et al. (2015) studied the impacts of “input tariffs” in export-origin countries. “Input tariff” refers to tariffs on products and intermediate goods used for production of a given export product. Those studies empirically found that a reduction of input tariffs enables firms to import higher-quality inputs and raises the quality of export products. The effects of input tariffs on firm performance indicators such as productivity were also examined in Amiti and Konings (2007).
5
The rest of this paper is organized as follows. The next section presents the global average of tariff pass-through. We also examine how a tariff change affects trade prices through changing product quality and quality-adjusted prices. In Section 3, we theoretically investigate the relationship of tariffs with gross prices, product quality, and quality-adjusted prices. Section 4 concludes.
2. Global Average of Tariff Pass-through
This section presents the global average of tariff pass-through. Specifically, after presenting results on the effect of tariffs on gross trade prices, we decompose their effects on quality-adjusted prices and quality.
2.1. Effects on Gross Prices
We begin with analyses of gross prices. As mentioned in the introductory section, we employ data from UN Comtrade for trade data and WITS for tariff data. Gross trade prices are computed by dividing trade values by trade quantities in terms of kilograms. We use trade data reported by importers. Our tariff variable is defined at a country pair-product-year level. Namely, we take into account the existence of preferential tariff rates such as RTA tariff rates and tariff rates for GSP. When multiple tariff schemes are available, we assume that exporters always use the scheme with lowest tariff rate. In both trade and tariff data, we consistently use the six-digit code from the 1992 HS version. Therefore, tariff rates defined at a tariff-line level are aggregated at the six-digit level by a simple average. As a result, our dataset is very comprehensive and includes 70 importers, 172 exporters, and 23 years (i.e., 1992–2014).6
With this dataset, we estimate the following simple equation: ln 𝑝ℎ𝑖𝑗𝑡 = 𝛽 ln(1 + 𝑇𝑎𝑟𝑖𝑓𝑓ℎ𝑖𝑗𝑡) + 𝐮 + 𝜖ℎ𝑖𝑗𝑡,
where phijt represents before-tariff (tariff exclusive) trade price from country i to country j in
product h at year t. As mentioned above, a product is defined at the HS six-digit level in our analysis. Tariffhijt is the aforementioned tariff rates of country i for product h imported from
country j at year t. For example, when tariff rates are 10%, it takes a value of 0.10. Its coefficient β indicates the degree of tariff pass-through. Specifically, it shows how many percentages the trade prices change when (one-plus) tariff rates rise by 1%. u is various sets of fixed effects, which are explained later. 𝜖ℎ𝑖𝑗𝑡 is the disturbance term. We estimate this
equation by ordinary least squares (OLS) method.7
6 These countries are listed in Appendix A.
7 One issue with this estimation may be the sample selection. Namely, given that we can observe the data
on trade prices only when the concerned products are traded, our estimates may suffer from sample selection biases. The use of Heckman two-step estimation technique is one possible way to address this issue. However, our dataset is huge, including approximately 60 million observations. The estimation of non-linear models including the Heckman model with a larger number of dummy variables for such a
6
Our first specification for estimation includes exporter-importer-product and exporter-importer-year fixed effects. The former controls for various time-invariant factors such as geography, cultural factors, or demand elasticity. Time-variant country-pair specific factors are controlled for by the latter, including the existence of trade preferences (e.g., RTA) or exchange rates. The estimation result is shown in column (I) in Table 1. The coefficient for tariffs is estimated to be significantly positive, indicating a slight decrease in trade prices due to tariff reductions. Specifically, it shows that a 1% reduction of (one plus) tariffs decreases trade prices by 0.04%, i.e., consumer prices decrease by more than the extent of tariff reduction.
=== Table 1 ===
We further introduce fixed effects. In column (II), we add exporter-product-year fixed effects. This type of fixed effects will control for production condition in export countries, particularly wages. The coefficient for tariffs is again significant, but here, it is negative; this indicates that a tariff reduction raises trade prices. In column (III), we introduce importer-product-year fixed effects, which control completely for product-level demand size of importers. Furthermore, this type of fixed effects absorbs any variation in MFN rates among importers (although our sample importers include non-WTO member countries). Thus, in this specification, the variation in tariffs comes completely from preferential tariff rates. The coefficient for tariffs is again estimated to be positive.
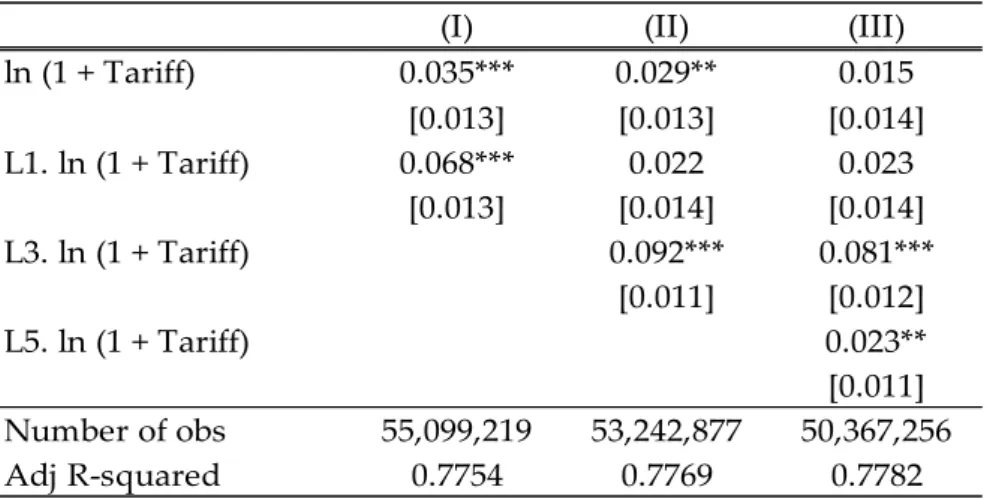
To check the robustness of this positive coefficient, we estimate two other models.8 In
both models, we use the same set of fixed effects as those in column (III) in Table 1. First, based on the conservative classification of Rauch (1999), we estimate for differentiated products and non-differentiated products separately. The coefficients are significantly positive in both types of products although the absolute magnitude is slightly larger in the case of non-differentiated products. Second, we examine lagged effects of tariffs by introducing either or both one-year, three-year, and five-year lagged tariff variables in addition to the concurrent tariff variable. Although the significance of coefficients differs by specifications, the sign with statistical significance is always positive.
2.2. Effects on Quality-adjusted Trade Prices and Quality
In this subsection, to obtain clues on the mechanism underlying the positive effects of tariffs on gross trade prices, we decompose gross trade prices into the quality component and all other components. To this end, we employ the method proposed by Khandelwal et al. (2013). Specifically, we first estimate the following (demand) equation by the OLS:
ln 𝑄ℎ𝑖𝑗𝑡+ 𝜎ℎ𝑗ln ((1 + 𝑇𝑎𝑟𝑖𝑓𝑓ℎ𝑖𝑗𝑡) × 𝑝ℎ𝑖𝑗𝑡) = uℎ+ u𝑗𝑡+ 𝜖ℎ𝑖𝑗𝑡,
number of observations is beyond the capacity of our computers. The basic statistics are reported in Table B1 in Appendix B.
7
where ln 𝑄ℎ𝑖𝑗𝑡 is a log of trade quantity in terms of kilograms, 𝜎ℎ𝑗 is demand elasticity of
product h of importer j,9 and u
ℎ and u𝑗𝑡 are product and importer-year fixed effects,
respectively. We introduce tariff rates on the left-hand side of the equation to approximate consumer prices. We estimate this equation by sections of HS tariff classifications. Then, we recover product quality z by computing
ln 𝑧̂ℎ𝑖𝑗𝑡 = 𝜖̂ℎ𝑖𝑗𝑡⁄(𝜎ℎ𝑗− 1)
The log of quality-adjusted trade prices (QaPrice) is obtained as ln 𝑝ℎ𝑖𝑗𝑡 − ln 𝑧̂ℎ𝑖𝑗𝑡.
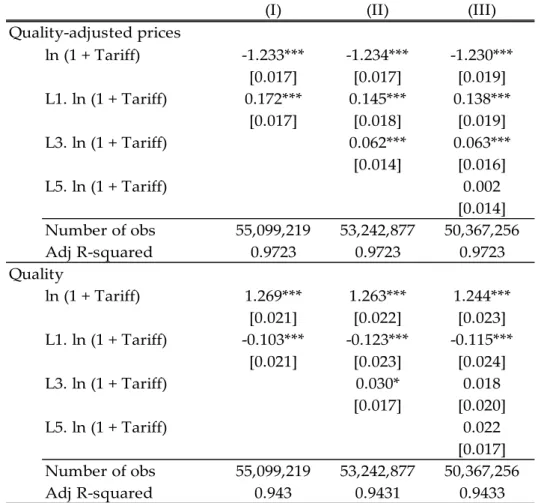
Table 2 reports the estimates for similar specifications as in Table 1, here for quality-adjusted prices and quality separately.10 In all specifications, the coefficients for tariffs are
significantly negative for quality-adjusted prices and significantly positive for quality. For example, column (III) shows that a 1% reduction of (one-plus) tariff rates decreases product quality by 1.2% and increases quality-adjusted trade prices by 1.1%. Naturally, the sum of the coefficients for quality-adjusted prices and quality is equal to the coefficient found in Table 1. In particular, when the absolute magnitude is larger in the quality equation than in the quality-adjusted trade prices equation, as in columns (I) and (III), the coefficient in gross trade prices becomes positive.
=== Table 2 ===
We also estimate similar models as in the previous subsection for quality-adjusted trade prices and quality separately.11 When estimating the model separately for trade in
differentiated and non-differentiated products, we again obtain the negatively significant coefficient for quality-adjusted prices and the positively significant coefficient for quality. In addition, for both quality-adjusted trade prices and quality, the absolute magnitude is larger for differentiated products than non-differentiated products. When we introduce lagged tariff variables, we obtain similar results for the concurrent tariffs as found earlier for both quality-adjusted trade prices and quality equations. However, almost all lagged variables have the opposite sign to that found for the concurrent tariff variable. Nevertheless, the sum of the coefficients for one- and more-year lagged variables is much smaller than the coefficient for the concurrent tariff variable in terms of an absolute value. Therefore, the total effect is still negative for quality-adjusted trade prices and positive for quality.
In sum, we have shown that a tariff reduction in the destination country (1) decreases
9 Data on elasticities at country-HS three-digit level were obtained from Broda et al. (2017).
10 There might be two empirical issues with our estimation. First, the demand function used in estimating
the quality is based on the constant elasticity of substitution (CES) utility function. Nevertheless, the tariff pass-through rate is not necessarily perfect because we consider its average rate. The entry and exit of heterogenous firms in the export market, i.e., extensive margin, may change the average rate of tariff pass-through. Second, because the dependent variable in the demand function includes tariff rates, regressing quality (and quality-adjusted trade prices) on tariff rates yields an endogeneity concern. Furthermore, it is difficult to address this type of endogeneity bias. However, we consider that more serious biases in quality (and quality-adjusted trade prices) result from not taking into account the difference in tariff rates across countries, products, and years when estimating the demand equation.
8
gross trade prices (negative tariff pass-through); (2) decreases the quality of exported products, and (3) increases quality-adjusted trade prices. The first result implies the presence of a Lerner paradox for gross trade prices. Furthermore, given our observation that the degree of increases in quality-adjusted trade prices is greater than the degree of tariff reduction, a tariff reduction also increases tariff-inclusive quality-adjusted prices. This implies the presence of a Metzler paradox for quality-adjusted trade prices. These results are different from those of Ludema and Yu (2016), who investigated how changes in foreign tariffs affect U.S. export prices at the firm level and found that a Metzler paradox is possible for the (quality-unadjusted) gross trade prices.
3. Theoretical Analysis
In this section, we build a model to explain our empirical results. The model incorporates a heterogeneous-quality model of Baldwin and Harrigan (2011) and Johnson (2012) into the heterogeneous-firm model of Melitz and Ottaviano (2008). In Melitz and Ottaviano (2008)’s model, firms’ markups are variable, and trade liberalization affects the degree of market competition. Specifically, we consider a situation where firms with different productivity supply products with different quality.
3.1. Basic Setup
Our model contains two countries indexed by 𝑗 ∈ {𝐴, 𝐵} , and consumers in these countries have the same preference. There are (exogenously given) M product categories and one numéraire good in the economy, and producers supply varieties of products in each product category h. The representative consumer's utility function in country j is quasi-linear and given by
𝑈𝑗 = 𝑦𝑗 + ∑ [𝛼 ∫ 𝑥ℎ𝑖𝑗 𝑑𝑖 −1 2𝛾 ∫ (𝑥ℎ𝑖 𝑗 )2𝑑𝑖 𝑖∈Ω −𝜂 2(∫ 𝑥ℎ𝑖 𝑗 𝑑𝑖 𝑖∈Ω ) 2 𝑖∈Ω ] 𝑀 ℎ=1 , (1) where 𝑦𝑗 is the individual's consumption of the numéraire good, 𝑥ℎ𝑖𝑗 is the individual consumption of each variety 𝑖 ∈ Ω of the product category h. This variety of consumption is measured in units of utility and defined as 𝑥ℎ𝑖𝑗 = 𝑧ℎ𝑖𝑞ℎ𝑖𝑗 , where 𝑧ℎ𝑖 is the quality of
variety i and 𝑞ℎ𝑖𝑗 is the physical units of variety i. Note that the quality of each variety is common across markets. The parameter 𝜂 (> 0) captures the degree of substitutability among the varieties in the industry. As 𝜂 becomes lower, products become more differentiated. Other parameters satisfy 𝛼 > 0 and γ ≥ 0 . The budget constraint of the representative consumer in country j is 𝑦𝑗+ ∑ℎ=1𝑀 [∫𝑖∈Ω𝑝ℎ𝑖𝑗 𝑞ℎ𝑖𝑗 𝑑𝑖]≤ 𝐼𝑗, where 𝑝ℎ𝑖𝑗 is the price of variety i and 𝐼𝑗 is the consumer’s income.
9
inverse demand function for each variety is given by
𝑝ℎ𝑖𝑗 = 𝑧ℎ𝑖𝑗 (𝛼 − 𝛾𝑧ℎ𝑖𝑞ℎ𝑖𝑗 − 𝜂𝑋ℎ𝑗), (2) where 𝑋ℎ𝑗 = ∫𝑖∈Ω𝑧ℎ𝑖𝑞ℎ𝑖𝑗 𝑑𝑖 is the total individual consumption of the differentiated goods measured in units of utility in product category h. Define 𝑃ℎ𝑖𝑗 = 𝑝ℎ𝑖𝑗 ⁄𝑧ℎ𝑖 as the quality-adjusted price of variety i in country j. By transforming Equation (2), the physical demand for variety i is given by
𝑄ℎ𝑖𝑗 ≡ 𝐿𝑗𝑞ℎ𝑖𝑗 = 𝐿
𝑗
𝛾𝑧ℎ𝑖(𝑃ℎ,𝑚𝑎𝑥
𝑗
− 𝑃ℎ𝑖𝑗), (3) where 𝐿𝑗 is the mass of consumers in country j and 𝑃𝑚𝑎𝑥𝑗 is the ceiling of the quality-adjusted price below which 𝑞𝑖𝑗 > 0 holds. The price ceiling is calculated as
𝑃ℎ,𝑚𝑎𝑥𝑗 ≡𝛾𝛼 + 𝜂𝑁ℎ
𝑗
𝑃̅ℎ𝑗
𝛾 + 𝜂𝑁ℎ𝑗 , (4) where 𝑁𝑗 is the measure of the consumed variety of the same product category and 𝑃̅ℎ𝑗 = (1/𝑁ℎ𝑗) ∫𝑖∈Ω𝑃ℎ𝑖𝑗𝑑𝑖 is the average quality-adjusted price in country j.
On the supply side, labor is the only factor of production. We assume both countries produce the numéraire good and free trade prevails in that sector. In producing the numéraire good, the two countries utilize the same production technology, and one unit of labor produces one unit of the good. These assumptions ensure that wages in the two countries become identical and unity. In producing a variety of non-numéraire, product category h in country j, each firm must pay a fixed entry fee, 𝑓ℎ𝑗, and draws its marginal processing cost, c, from a distribution denoted by 𝐺(𝑐). Firm i’s profit earned in country j is given by 𝜋ℎ𝑖𝑗 = (𝑝ℎ𝑖 𝑗 𝜏ℎ𝑗 − 𝑐) 𝑄ℎ𝑖 𝑗 , (5) where 𝜏ℎ𝑗 ≥ 1 is the one plus applied, ad valorem tariff on the imports in country j of product h, where 𝜏ℎ𝑗 = 1 holds if variety i is sold domestically.
By substituting 𝑞ℎ𝑖𝑗 = 𝑄ℎ𝑖𝑗 /𝐿𝑗 into Equation (1) and using Equation (4) and the budget
constraint, the indirect utility of function takes the following form: 𝑈𝑗 = 𝐼𝑗+ ∑ [1 2(𝜂 + 𝛾 𝑁ℎ𝑗) −1 (𝛼 − 𝑃̅ℎ𝑗)2+𝑁ℎ 𝑗 2𝛾(σℎ 𝑗 )2] 𝑀 ℎ=1 , (6) where σℎ𝑗 ≡ √∫ (𝑃ℎ𝑖𝑗 − 𝑃̅ℎ𝑗)2/ 𝑖∈Ω 𝑁ℎ 𝑗
represents the standard deviation of prices of product h in country j. The consumer’s utility is, ceteris paribus, decreasing in the average quality-adjusted price, increasing in the number of varieties in each product category, and
10
increasing in the variance of prices.12 These properties of the indirect utility function are the
same as those of Melitz and Ottaviano (2008), although their price in the utility is the quality-adjusted price in our model.
3.2. Price, Quantity, and Quality of Each Variety
Following Baldwin and Harrigan (2011) and Johnson (2012), the quality of each variety depends on the producing firm's marginal cost, and it is given by 𝑧ℎ𝑖 = 𝑐1+𝜃, where 1 + 𝜃
is the extent to which higher marginal costs are associated with higher quality (i.e., quality elasticity) and 𝜃 ∈ (−1, +∞).13
By maximizing 𝜋ℎ𝑖𝑗 with respect to 𝑝ℎ𝑖𝑗 , and by deriving each firm’s profit as the function of its marginal cost, 𝜋ℎ𝑗(𝑐), we obtain the cut-off level of marginal costs at which the profit is equal to zero, 𝜋ℎ𝑗(𝑐) = 0.14 When a firm producing in country j sells the good
in country j, it is free from the tariff, and the cut-off level is given by 𝑐ℎ𝐷𝑗 ≡ (𝑃ℎ,𝑚𝑎𝑥𝑗 )−𝜃1. If a
firm producing outside country j exports the good to country j, it is subject to tariff and the cut-off level is given by 𝑐ℎ𝑋𝑗 ≡ (𝜏ℎ𝑗/𝑃ℎ,𝑚𝑎𝑥𝑗 )
1 𝜃 = (𝜏ℎ𝑗) 1 𝜃𝑐 ℎ𝐷 𝑗 .
By using these cut-offs, the export price and export quantity are respectively given by 𝑝ℎ𝑋𝑗 (𝑐) ≡𝑝ℎ 𝑗 (𝑐) 𝜏ℎ𝑗 = 𝑐1+𝜃 2 [(𝑐ℎ𝑋 𝑗 )−𝜃+ 𝑐−𝜃], (7) 𝑄ℎ𝑋𝑗 (𝑐) = 𝜏ℎ 𝑗 𝐿𝑗 2𝛾𝑐1+𝜃[(𝑐ℎ𝑋 𝑗 )−𝜃− 𝑐−𝜃]. (8)
Then, the profits of the domestic firms and those of the other country’s exporting firms earned in country j are, respectively, given by
𝜋ℎ𝐷𝑗 (𝑐) = 𝐿 𝑗 4𝛾[(𝑐ℎ𝐷 𝑗 )−𝜃− 𝑐−𝜃]2 , (9) 𝜋ℎ𝑋𝑗 (𝑐) =𝜏ℎ 𝑗 𝐿𝑗 4𝛾 [(𝑐ℎ𝑋 𝑗 )−𝜃− 𝑐−𝜃]2. (10)
The relationship between the profit and the marginal cost depends on the sign of 𝜃, as is
12 Utility is increasing in the variance of prices because consumers can shift their expenditures towards
lower priced varieties within each product category.
13 Kugler and Verhoogen (2008) empirically found that higher input costs is associated with higher
product quality. Others, such as Antoniades (2015), Ludema and Yu (2016), and Fieler et al. (2018), explicitly consider each firm's endogenous choice of quality. However, our product-level data cannot identify firm-level quality differences. Therefore, and as suggested by Baldwin and Harrigan (2011), as long as the variation in firm-specific quality choice depends only on firm-specific draw of production costs, the "power-function approach" of the cost-quality nexus is a reasonable approximation in calculating the average level of quality within each product category.
11
summarized in the following lemma:
Lemma 1 A lower marginal cost increases the firm's profit if 𝜃 < 0, and a higher marginal cost
increases the profit if 𝜃 > 0.
When 𝜃 < 0 holds, both 𝜋ℎ𝐷𝑗 (𝑐) and 𝜋ℎ𝑋𝑗 (𝑐) are decreasing in 𝑐, and firms with low marginal costs survive in country j’s market. Even though higher product quality comes with higher marginal cost, the cost-increasing effect dominates the quality-enhancing effect, and lower c corresponds to higher profits. In this case, the market equilibrium is characterized by productivity sorting, where a firm with lower c charges lower prices, has a higher market share, earns higher profits, and is more likely to survive. When 𝜃 > 0 holds, however, the profits are increasing in 𝑐 . In this case, higher c leads to an exponential increase in quality, and quality sorting occurs. Namely, a firm with higher marginal cost charges a higher price and a lower quality-adjusted price in the market, earns higher profits, and is more likely to survive in the market.
The effects of changes in the cut-off level of marginal cost on the price and profits also depend on the sign of 𝜃, as summarized in the following lemma:
Lemma 2 An increase in the cut-off level of the marginal cost in country j increases prices and the
firms’ profits earned in country j under productivity sorting (𝜃 < 0), but it decreases them under quality sorting (𝜃 > 0).
Under productivity sorting, the cost effect dominates the quality effect, and an increase in the cut-off level means that firms with higher marginal costs can survive in the market. Because these new surviving-firms have higher marginal costs than the original surviving firms, they set higher prices. In response, the original surviving firms raise prices and their profits increase. Under quality sorting, however, the quality effect is large enough to outweigh the cost effect, and firms with higher c are more competitive in the product market. In this case, an increase in the cut-off level means more competitive firms remain in the market. These firms lower their prices, and profits decrease for the original surviving firm. Below, we subsequently examine tariff pass-through under productivity sorting and quality sorting.
3.3. Tariff Pass-Through under Productivity Sorting
Let us first investigate the case with 𝜃 < 0 , where both 𝜋ℎ𝐷𝑗 (𝑐) and 𝜋ℎ𝑋𝑗 (𝑐) are decreasing in c. In this case, firms in country j with 𝑐 < 𝑐ℎ𝐷𝑗 survive in the domestic market, whereas those with 𝑐 < 𝑐ℎ𝑋𝑗 who produce outside country j export their good to country j. We assume that a cost draw follows a Pareto distribution and is given by 𝐺(𝑐) = (𝑐/𝑐𝑀)𝑘
12
density function is 𝐺′(𝑐) = 𝑘𝑐𝑘−1/(𝑐𝑀)𝑘. According to this distribution function, there are
fewer low-cost firms than high-cost firms.
The free-entry principle implies that the ex-ante expected profits of product category
h upon entry in country j should be equal to 𝑓ℎ𝑗 . For instance, the expected profits from locating and producing in country A consist of the expected profit from the domestic supply, 𝜋ℎ𝐷𝐴 (𝑐), and the expected profit from exporting to country B, 𝜋𝑋𝐵(𝑐). Given the cut-off levels
of firm entry, the two countries' free-entry conditions are given by ∫ 𝜋ℎ𝐷𝐴 (𝑐)𝑑𝐺(𝑐) + ∫ 𝜋ℎ𝑋𝐵 (𝑐)𝑑𝐺(𝑐) 𝑐ℎ𝑋𝐵 0 𝑐ℎ𝐷𝐴 0 = 𝑓ℎ𝐴, (11) ∫ 𝜋ℎ𝐷𝐵 (𝑐)𝑑𝐺(𝑐) + ∫ 𝜋ℎ𝑋𝐴 (𝑐)𝑑𝐺(𝑐) 𝑐ℎ𝑋𝐴 0 𝑐ℎ𝐷𝐵 0 = 𝑓ℎ𝐵. (12) By using Equations (9) and (10), the equilibrium cut-off level, 𝑐̃ℎ𝐷𝑗 (𝑗 ∈ {𝐴, 𝐵}), is determined by solving Equations (11) and (12):
𝑐̃ℎ𝐷𝑗 = [{𝑓ℎ 𝑗 − 𝜌ℎ𝑙𝑓ℎ𝑙}Φ {1 − 𝜌ℎ𝑗𝜌ℎ𝑙}𝐿𝑗] 1 𝑘−2𝜃 (𝑙 ∈ {𝐴, 𝐵}, 𝑙 ≠ 𝑗), (13) where 𝜌ℎ𝑗 ≡ (𝜏ℎ𝑗) 𝑘−𝜃 𝜃 < 1 and 𝛷 ≡ 2𝛾(𝑘 − 𝜃)(𝑘 − 2𝜃)𝑐𝑀𝑘/𝜃2 > 0 . Because 𝜃 < 0 , 𝜌𝑗
corresponds to Melitz and Ottaviano (2008)’s “freeness” of trade and is decreasing in 𝜏𝑗. To ensure that 𝑐̃ℎ𝐷𝑗 > 0 holds, we assume 𝑓ℎ𝑗− 𝜌ℎ𝑙𝑓ℎ𝑙 > 0. The cost cut-off for exporting to country j becomes 𝑐̃ℎ𝑋𝑗 = (𝜏ℎ𝑗)1𝜃𝑐̃
ℎ𝐷 𝑗
.
The right-hand side of Figure 1 depicts the determination of the cut-off level in the two countries. The combination of cut-off levels that satisfies the free-entry conditions of both country A and country B are, respectively, depicted as the 𝑎𝑎 curve and 𝑏𝑏 curve. These curves’ downward slope can be explained as follows. A lower marginal cost cut-off in the other country implies, on average, lower expected profits from exporting because more productive firms operate in that country. Furthermore, it discourages the domestic firm’s entry and makes the domestic market less competitive, thereby increasing the domestic country’s cut-off level because the less productive firm can make a positive profit. The intersection of the two curves determines the equilibrium cut-offs. Because more entries correspond to a lower cut-off of the marginal cost, the number of varieties available in country j, 𝑁̃𝑗 is decreasing in 𝑐̃ℎ𝐷𝑗 , as depicted in the left-hand side of Figure 1 for country
B.15
=== Figure 1 ===
In the short run, a tariff decrease simply hurts domestic firms in country B and
15 By Equation (8) and given the distribution, 𝐺(𝑐) , the average quality-adjusted price of good h in
country j is calculated as 𝑃̅ℎ𝑗= (2𝑘 − 𝜃)(𝑐̃ℎ𝐷𝑗 )−𝜃/{2(𝑘 − 𝜃)}. By substituting this price into Equation (4), the number of varieties sold in country j is given by 𝑁̃ℎ𝑗 = −2𝛾(𝑘 − 𝜃) [𝛼 − (𝑐̃𝐷𝑗)−𝜃] /𝜃𝜂(𝑐̃𝐷𝑗)−𝜃.
13
benefits firms in country A. In the long-run, however, tariff decreases change the number of entrants in each country. Let us now examine how trade liberalization affects the cut-off level of marginal costs. According to Equation (13) and 𝑐̃ℎ𝑋𝑗 = (𝜏ℎ𝑗)1𝜃𝑐̃
ℎ𝐷 𝑗
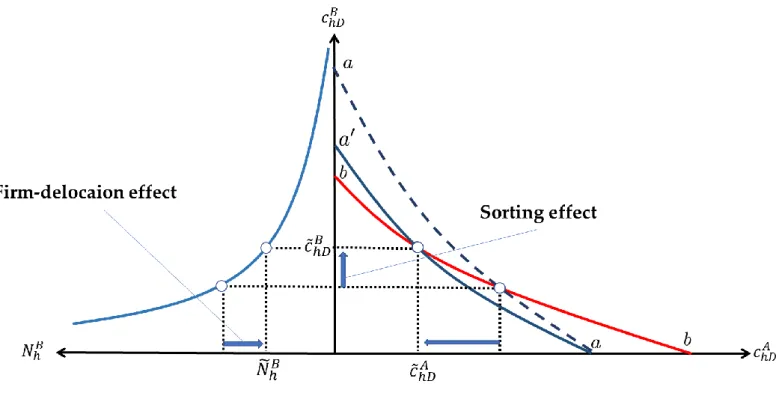
, a decrease in 𝜏𝑗 increases both 𝑐̃ℎ𝐷𝑗 and 𝑐̃ℎ𝑋𝑗 with 𝜃 < 0. Suppose that country B reduces its tariff. Trade liberalization then increases the expected profit from entry in country A. The free-entry conditions then raise the number of the entrants in country A and decrease 𝑐̃ℎ𝐷𝐴 , given the level of 𝑐̃ℎ𝐷𝐵 . This effect is illustrated in Figure 2, where the 𝑎𝑎 curve shifts inside to the 𝑎′𝑎 curve. Because more productive firms export to country B on average, trade liberalization decreases the expected profit in country B. Therefore, it reduces the number of the entrants in country B and increases 𝑐̃ℎ𝐷𝐵 . This implies that less productive producers enter country B. This is the sorting effect of trade liberalization.
=== Figure 2 ===
Furthermore, because the decrease in the number of the domestic varieties in the liberalization country exceeds the increase in the number of the foreign varieties, trade liberalization decreases the number of varieties consumed in country B, as is depicted in the left-side of Figure 2, while it increases the number of entrants in country A. This is the firm-delocation effect of trade liberalization.
Now, we calculate the price and quality effects of a tariff reduction. Because our trade data are product-level rather than firm-level, we need to calculate the average export price of each product category in order to examine tariff pass-through. Specifically, our empirical analysis uses the unit value of each product category as the average export price. Total export values are given by 𝑇𝑉ℎ𝑋𝑗 = ∫𝑐̃ℎ𝑋𝑝ℎ𝑋𝑗 (𝑐)𝑄ℎ𝑋𝑗 (𝑐)𝑑𝐺(𝑐)
𝑗
0 , and the total export quantity is
given by 𝑇𝑄ℎ𝑋𝑗 = ∫𝑐̃ℎ𝑋𝑄ℎ𝑋𝑗 (𝑐)𝑑𝐺(𝑐)
𝑗
0 . Then, average export prices defined by unit values
become 𝑝̅ℎ𝑋𝑗 ≡ 𝑇𝑉ℎ𝑋 𝑗 𝑇𝑄ℎ𝑋𝑗 = (𝑘 − 2𝜃 − 1)(𝑘 − 𝜃 − 1) 𝑘(𝑘 − 2𝜃) 𝑐̃ℎ𝑋 𝑗 . (14) We should also calculate the average quality-adjusted prices, which are defined as the average export prices divided by average quality of exported products. The average quality is given by 𝑧̅ℎ𝑋𝑗 = 1 𝐺(𝑐̃ℎ𝑋𝑗 )∫ 𝑐 1+𝜃𝑑𝐺(𝑐) 𝑐̃ℎ𝑋𝑗 0 = 𝑘 𝑘 + 𝜃 + 1(𝑐̃ℎ𝑋 𝑗 )1+𝜃. (15) Then, the average quality-adjusted export price is given by
𝑃̅ℎ𝑋𝑗 ≡𝑝̅ℎ𝑋 𝑗 𝑧̅ℎ𝑋𝑗 = (𝑘 − 2𝜃 − 1){𝑘2 − (1 + 𝜃)2} 𝑘2(𝑘 − 2𝜃) (𝑐̃ℎ𝑋 𝑗 )−𝜃. (16)
14
By differentiating Equation (14) with respect to 𝜏ℎ𝑗, we obtain the tariff elasticity of export price as 𝑑 ln 𝑝̅ℎ𝑋𝑗 𝑑ln𝜏ℎ𝑗 = (1 − 𝜌ℎ𝑗𝜌ℎ𝑙) + 𝜌ℎ𝑙(𝑘 − 𝜃) 𝜃(1 − 𝜌ℎ𝑗𝜌ℎ𝑙)(𝑘 − 2𝜃) ≡ 𝜀ℎ𝑋 𝑗 < 0. (17) By Equation (15), the tariff elasticity of export quality is given by
𝑑 ln 𝑧̅ℎ𝑋𝑗
𝑑ln𝜏ℎ𝑗 = (1 + 𝜃)𝜀ℎ𝑋
𝑗
< 0, (18) and the tariff elasticity of the quality-adjusted export price becomes
𝑑 ln 𝑃̅ℎ𝑋𝑗
𝑑ln𝜏ℎ𝑗 = −𝜃𝜀ℎ𝑋
𝑗
< 0. (19) Because of the firm-delocation effect described above, trade liberalization decreases the number of varieties in the domestic market, which softens market competition and increases the average quality-adjusted price in the domestic country. Furthermore, less productive producers survive in the liberalizing country, and this sorting effect makes the market competition softer and increases average quality-adjusted prices in the liberalizing country. Such productivity sorting also increases the product’s average quality because firms with higher marginal costs produce higher-quality varieties. Therefore, trade liberalization also increases the average gross price. The following proposition summarizes these effects:
Proposition 1 Under productivity sorting, a decrease in the tariff in the destination country
increases the average gross price, average quality, and average quality-adjusted price of exported products.
The direction of the change in quality-adjusted price is consistent with our empirical result. The directions of changes in (gross) export price and export quality, however, are opposite to our empirical results. This indicates that our productivity sorting model is inappropriate to explain the product-level tariff pass-through of worldwide trade.
3.4. Tariff Pass-Through under Quality Sorting
Let us next investigate the case with 𝜃 > 0 , where both 𝜋ℎ𝐷𝑗 (𝑐) and 𝜋ℎ𝑋𝑗 (𝑐) are increasing in c. In this case, we will observe the quality sorting of firms. Contrary to the productivity-sorting case, firms with 𝑐 > 𝑐ℎ𝐷𝑗 survive in the domestic market of country j, and firms with 𝑐 > 𝑐ℎ𝑋𝑗 export to country j. Here, a Pareto distribution of firm’s cost draws is given by 𝐺(𝑐) = 1 − (𝑐0/𝑐)𝑘 , such that there are fewer high-quality firms than
15
The two countries’ free-entry conditions are given by ∫ 𝜋ℎ𝐷𝐴 (𝑐)𝑑𝐺(𝑐) + ∫ 𝜋ℎ𝑋𝐵 (𝑐)𝑑𝐺(𝑐) +∞ 𝑐ℎ𝑋𝐵 +∞ 𝑐ℎ𝐷𝐴 = 𝑓ℎ𝐴, (20) ∫ 𝜋ℎ𝐷𝐵 (𝑐)𝑑𝐺(𝑐) + ∫ 𝜋ℎ𝑋𝐴 (𝑐)𝑑𝐺(𝑐) +∞ 𝑐ℎ𝑋𝐴 +∞ 𝑐ℎ𝐷𝐵 = 𝑓ℎ𝐵. (21) The right-hand side of Figure 3 depicts these free-entry conditions. As in Figure 1, the 𝑎𝑎 curve represents the free-entry condition in country A, and the 𝑏𝑏 curve represents that in country B. Their downward slope reflects the fact that a higher cut-off level in the foreign country means that the firms producing higher-quality good operate in that country, diminishing the expected profits from exporting and discouraging the domestic firm’s entry. The reduced entry makes the domestic market less competitive, which decreases the cut-off level of the domestic country because lower-quality firms can make positive profits.
=== Figure 3 ===
By solving Equations (20) and (21), the cut-off level of the domestic survival is given by 𝑐̃ℎ𝐷𝑗 = [{1 − 𝜆ℎ 𝑗 𝜆𝑙ℎ}Ψ𝐿𝑗 𝑓ℎ𝑗− 𝜆ℎ𝑙𝑓 ℎ𝑙 ] 1 𝑘+2𝜃 (𝑙 ∈ {𝐴, 𝐵}, 𝑙 ≠ 𝑗), (22) where 𝜆ℎ𝑗 ≡ (𝜏ℎ𝑗)− 𝑘+𝜃 𝜃 < 1 and Ψ ≡ 𝜃2𝑐0𝑘/[2𝛾(𝑘 + 𝜃)(𝑘 + 2𝜃)𝑓𝐸] > 0 . We assume 𝑓ℎ𝑗 − 𝜆𝑙𝑓 ℎ𝑙> 0 to ensure that 𝑐̃ℎ𝐷 𝑗
> 0 holds. The cost cut-off for exporting to country j becomes 𝑐̃ℎ𝑋𝑗 = (𝜏ℎ𝑗)𝜃1𝑐̃
ℎ𝐷 𝑗
. The number of varieties sold in country j is given by
𝑁̃ℎ𝑗 =2𝛾(𝑘 + 𝜃) [𝛼 − (𝑐̃ℎ𝐷
𝑗
)−𝜃] 𝜃𝜂(𝑐̃ℎ𝐷𝑗 )−𝜃
. (23) As is depicted in the left-hand side of Figure 3, an increase in 𝑐̃ℎ𝐷𝑗 increases 𝑁̃ℎ𝑗 . Under quality sorting, a higher cut-off of the marginal cost (i.e., a higher cut-off quality) corresponds to more entries, and thus the number of variety available in country j, 𝑁̃𝑗, is increasing in 𝑐̃ℎ𝐷𝑗 .
Let us consider the effect of trade liberalization. For instance, a reduction to the import tariff in country B shifts the 𝑎𝑎 curve outside to the 𝑎′𝑎′ curve in Figure 4 because it increases the expected profits from producing in country A and the increased entry increases 𝑐̃ℎ𝐷𝐴 given 𝑐̃ℎ𝐷𝐵 . As a result, trade liberalization decreases 𝑐̃ℎ𝐷𝐵 and decreases the number of varieties consumed in the liberalizing country (firm-delocation effect). A decrease in 𝑐̃ℎ𝐷𝐵 comes with a decrease in 𝑐̃ℎ𝑋𝐵 , which decreases the average cost of firms exporting to country B. Because the former effect increases the average quality-adjusted price whereas the latter effect decreases it, the overall effect is ambiguous.
=== Figure 4 ===
16
decreases 𝑐̃ℎ𝑋𝑗 , relatively lower-cost, lower-quality firms survive in the liberalizing country. Therefore, the average quality decreases with a tariff reduction. The negative effect of trade liberalization on average quality is in contrast to the positive effect of trade liberalization on average quality under productivity sorting.
Because trade liberalization decreases the average quality, it may decrease the average gross price of exported products, even if the average quality-adjusted price increases. The following analysis shows that the quality effect is large enough to derive the positive correlation between tariffs and average gross trade prices (i.e., a Lerner paradox). The total export values are given by 𝑇𝑉ℎ𝑋𝑗 = ∫𝑐̃+∞𝑝ℎ𝑋𝑗 (𝑐)𝑄ℎ𝑋𝑗 (𝑐)𝑑𝐺(𝑐)
ℎ𝑋
𝑗 , and the total export quantity is
by 𝑇𝑄ℎ𝑋𝑗 = ∫𝑐̃+∞𝑄ℎ𝑋𝑗 (𝑐)𝑑𝐺(𝑐)
ℎ𝑋
𝑗 . Then, the average unit value of exports becomes
𝑝̅ℎ𝑋𝑗 ≡ 𝑇𝑉ℎ𝑋 𝑗 𝑇𝑄ℎ𝑋𝑗 = (𝑘 + 2𝜃 + 1)(𝑘 + 𝜃 + 1) 𝑘(𝑘 + 2𝜃) 𝑐̃ℎ𝑋 𝑗 . (24) The average quality and quality-adjusted unit value of exports are respectively given by
𝑧̅ℎ𝑋𝑗 = 1 1 − 𝐺(𝑐̃ℎ𝑋𝑗 )∫ 𝑐 1+𝜃𝑑𝐺(𝑐) +∞ 𝑐̃ℎ𝑋𝑗 = 𝑘 𝑘 − 𝜃 − 1(𝑐̃ℎ𝑋 𝑗 )1+𝜃, (25) 𝑃̅ℎ𝑋𝑗 ≡𝑝̅ℎ𝑋 𝑗 𝑧̅ℎ𝑋𝑗 = (𝑘 + 2𝜃 + 1){𝑘2− (1 + 𝜃)2} 𝑘2(𝑘 + 2𝜃) (𝑐̃ℎ𝑋 𝑗 )−𝜃. (26) We assume 𝑘 > 1 + 𝜃 holds to ensure that the average quality is positive.
By differentiating Equations (31), (32), and (33) with respect to the destination’s tariff, we have 𝑑 ln 𝑝̅ℎ𝑋𝑗 𝑑ln𝜏ℎ𝑗 = (𝑘 + 𝜃) + (1 − 𝜆ℎ𝑗𝜆ℎ𝑙)𝜃 𝜃(1 − 𝜆ℎ𝑗𝜆ℎ𝑙)(𝑘 + 2𝜃) ≡ 𝜖ℎ𝑋 𝑗 > 0, (27) 𝑑 ln 𝑧̅ℎ𝑋𝑗 𝑑ln𝜏ℎ𝑗 = (1 + 𝜃)𝜖ℎ𝑋 𝑗 > 0, (28) 𝑑 ln 𝑃̅ℎ𝑋𝑗 𝑑ln𝜏ℎ𝑗 = −𝜃𝜖ℎ𝑋 𝑗 < 0. (29) These results are consistent with our empirical results, as the following proposition summarizes:
Proposition 2 Under quality sorting, a decrease in tariff in the destination country decreases the
average gross price and average quality of exported products, whereas it increases the average quality-adjusted price of exported products.
17
A positive effect from the tariff on the gross export price implies that the quality sorting mechanism of exporters in our model explains the presence of the Lerner paradox observed in our empirical analysis. Furthermore, if we calculate the tariff elasticity of quality-adjusted consumer price of exports, we have
𝑑 ln(𝜏ℎ𝑗𝑃̅ℎ𝑋𝑗 ) 𝑑ln𝜏ℎ𝑗 = −
𝜆ℎ𝑗𝜆ℎ𝑙(𝑘 + 𝜃)
(1 − 𝜆ℎ𝑗𝜆ℎ𝑙)(𝑘 + 2𝜃)< 0. (30) This means that a tariff decrease also increases the quality-adjusted consumer price in the importing country. Therefore, we can also explain the Metzler paradox for the quality-adjusted price observed in the empirical results.
Bagwell and Staiger (2012) and Bagwell and Lee (2015) suggested that market competition in imperfectly competitive environments with variable markups generates firm-delocation effects, which are driving forces behind the emergence of a Metzler paradox for the average quality-adjusted consumer price. Firm-delocation effects, however, cannot explain a Lerner paradox for gross trade prices. To show the presence of Lerner paradox, the model needs to incorporate a quality-sorting mechanism of Baldwin and Harrigan (2011) or Johnson (2012), where high-cost, high-quality firms are more competitive and more likely to be exporters. Our model is a hybrid of a firm-delocation model and quality-sorting model with heterogeneous firms, which enables us to explain the effects of trade liberalization at the product-level and export prices in worldwide trade. In other words, the worldwide product trade is characterized by price competition under variable markups and quality competition under quality sorting. The resulting entry and exit of firms in both export and domestic markets lead to the concurrence of Lerner and Metzler paradoxes.
3.5. Welfare Effect of Trade Liberalization under Quality Sorting
We have shown that our quality sorting model is consistent with the empirical results. Here, we discuss whether unilateral trade liberalization that generates a Lerner paradox for the average gross price and a Metzler paradox for the average quality-adjusted price improves the welfare of the liberalizing country.
By Equation (6), the consumer’s utility is decreasing with the average quality-adjusted price, increasing with the number of varieties, and increasing with the variance of prices. The average quality-adjusted price under quality sorting is calculated as
𝑃̅ℎ𝑗 = 2𝑘 + 𝜃 2(𝑘 + 𝜃)(𝑐̃ℎ𝐷
𝑗
)−𝜃, (31) which is decreasing in 𝑐̃ℎ𝐷𝑗 . The variance of quality-adjusted prices is given by
(σ̃ℎ𝑗)2 = 𝑘𝜃
2
4(𝑘 + 𝜃)2(𝑘 + 2𝜃)(𝑐̃ℎ𝐷 𝑗
)−2𝜃, (32) which is decreasing in 𝑐̃ℎ𝐷𝑗 . By Equation (30), the number of varieties in country j is increasing in 𝑐̃ℎ𝐷𝑗 .
18
Under quality sorting, high-cost firms are more competitive because they produce high-quality products, and the positive quality effect outweighs the negative effect higher marginal costs. Hence, higher-cost firms set lower quality-adjusted prices, as is implied by Equation (30). Because trade liberalization in country j decreases 𝑐̃𝐷𝑗, Equation (23) implies that trade liberalization also reduces the number of varieties sold in that country.
The firm-delocation effect under quality sorting makes the market less competitive, and average quality-adjusted prices increase with trade liberalization. A reduction in the number of varieties and a rise in quality-adjusted prices worsen the consumer’s utility in the importing country. By Equation (32), however, trade liberalization increases the variance of quality-adjusted prices, which improves the consumer’s utility. By substituting Equations (23), (31), and (32) into Equation (6), consumer utility is represented as a function of 𝑐̃ℎ𝐷𝑗 :
𝑈̃𝑗 = 𝐼𝑗+ 1 2𝜂∑ [{𝛼 − (𝑐̃ℎ𝐷 𝑗 )−𝜃} {𝛼 − 𝑘 + 𝜃 𝑘 + 2𝜃(𝑐̃ℎ𝐷 𝑗 )−𝜃}] 𝑀 ℎ=1 . (33) Because 𝑈̃𝑗 is increasing in 𝑐̃ℎ𝐷𝑗 , the negative effects from an increase in quality-adjusted prices and decrease in varieties dominate the positive effect from the increase in variance of quality-adjusted prices. As a result, trade liberalization hurts domestic consumers.
Proposition 3 Even though a tariff reduction decreases the gross trade price, it worsens the welfare
of liberalizing country because it substantially decreases the average quality, increases quality-adjusted prices, and decreases the number of varieties.
This proposition suggests that a unilateral tariff reduction should be accompanied by some additional policy reforms to ensure that the consumer benefits from trade liberalization. One such possible policy is to reduce the cost of entry. This would enhance competition in the liberalizing country and mitigate the increases in the quality-adjusted prices caused by the firm-delocation effect of trade liberalization. Note that Equation (22) suggests that a decline in 𝑓ℎ𝑗 increases 𝑐̃ℎ𝐷𝑗 , implying the increased entries of firms intensifies competition in the domestic country, thereby inducing relatively low-quality firms to exit. A reduction in the cost of entry thus benefits domestic consumers. Therefore, if a competition policy that enhances domestic entry is enacted to accompany trade liberalization, such a policy will mitigate the negative effect of trade liberalization.
4. Concluding Remarks
This paper started by quantifying the worldwide tariff pass-through, i.e., the impact of tariff reductions on trade prices. We found that a 1% reduction of (one plus) tariffs decreases trade prices by 0.1%, i.e., a negative tariff pass-through (Lerner paradox). To better understand the mechanism underlying this result, we next decomposed trade prices into product quality and quality-adjusted trade prices. As a result, we found that a 1% reduction
19
of (one-plus) tariff rates decreases product quality by 1.2% and increases quality-adjusted trade prices by 1.1% (Metzler paradox). To formalize these empirical findings, we constructed a theoretical model that demonstrates the mechanism underlying these empirical results. We suggested that a firm-delocation mechanism under variable markups and a quality-sorting mechanism are the driving forces behind these empirical findings.
Our theoretical model indicates that although a lower tariff decreases the average consumer price of imported products, it comes with even lower quality of these products and thereby increases quality-adjusted consumer prices. The number of varieties of goods also decreases with trade liberalization. We show that a simple reform which unilaterally reduces import tariff hurts domestic consumers. To ensure that consumers benefit from trade liberalization, a reduction in the destination country’s tariff should be accompanied by additional policy reforms that prevent increases in quality-adjusted prices or that mitigate the drop in average quality of exported products.
20
References
Amiti, M. and Khandelwal, A., 2013, Import Competition and Quality Upgrading, Review of
Economics and Statistics, 95(2), 476-490.
Amiti, M. and Konings, J., 2007, Trade Liberalization, Intermediate Inputs, and Productivity: Evidence from Indonesia, American Economic Review, 97(5), 1611–1638.
Antoniades, A., 2015, Heterogeneous Firms, Quality, and Trade, Journal of International
Economics, 95(2), 263-273.
Bagwell, K. and Lee, S.H., 2015, Trade Policy under Monopolistic Competition with Firm Selection, mimeo.
Bagwell, K. and Staiger, R.W., 1999, An Economic Theory of GATT, American Economic
Review, 89(1), 215-248.
Bagwell, K. and Staiger, R.W., 2012, The Economics of Trade Agreements in the Linear Cournot Delocation Model, Journal of International Economics, 88(1), 32-46.
Bagwell, K. and Staiger, R.W., 2016, The Design of Trade Agreements, in Handbook of
Commercial Policy, North-Holland, Vol. 1, 435-529.
Baldwin, R. and Harrigan, J., 2011, Zeros, Quality, and Space: Trade Theory and Trade Evidence, American Economic Journal: Microeconomics, 3(2), 60-88.
Bas, M. and Strauss-Kahn, V., 2015, Input-trade Liberalization, Export Prices and Quality Upgrading, Journal of International Economics, 95(2), 250-262.
Bas, M. and Causa, O., 2013, Trade and Product Market Policies in Upstream Sectors and Productivity in Downstream Sectors: Firm-level Evidence from China, Journal of
Comparative Economics, 41(3), 843-862.
Brander, J.A. and Spencer, B.J., 1984, Trade Warfare: Tariffs and Cartels, Journal of
International Economics, 16(3-4), 227-242.
Broda, C., Greenfield, J., and Weinstein, D., 2017, From Groundnuts to Globalization: A Structural Estimate of Trade and Growth, Research in Economics, 71(4), 759-783.
Bustos, P., 2011, Trade Liberalization, Exports, and Technology Upgrading: Evidence on the Impact of MERCOSUR on Argentinian Firms, American Economic Review, 101(1), 304-340.
Cadot, O., Carrere, C., de Melo, J., Portugal-Perez, A., 2005, Market Access and Welfare under Free Trade Agreements: Textiles under NAFTA, World Bank Economic Review, 19(3), 379-405.
Chang, W. and Winters, L., 2002, How Regional Blocs Affect Excluded Countries: The Price Effects of MERCOSUR, American Economic Review, 92(4), 889-904.
Cirera, X., 2014, Who Captures the Price Rent? The Impact of European Union Trade Preferences on Export Prices, Review of World Economics, 150(3), 507-527.
Crozet, M., Head, K., and Mayer, T., 2011, Quality Sorting and Trade: Firm-Level Evidence for French Wine, Review of Economic Studies, 79(2), 609-644.
21
Demidova, S., 2017, Trade Policies, Firm Heterogeneity, and Variable Markups, Journal of
International Economics, 108, 260-273.
Fajgelbaum, P., Grossman, G.M., and Helpman, E., 2011, Income Distribution, Product Quality, and International Trade, Journal of Political Economy, 119(4), 721-765.
Fan, H., Li, Y.A., and Yeaple, S., 2015, Trade Liberalization, Quality, and Export Prices,
Review of Economics and Statistics, 97(5), 1033-1051.
Fan, H., Li, Y.A., and Yeaple, S., 2018, On the Relationship Between Quality and Productivity: Evidence from China’s Accession to the WTO, Journal of International
Economics, 110, 28-49.
Feenstra, R., 1989, Symmetric Pass-through of Tariffs and Exchange Rates under Imperfect Competition: An Empirical Test, Journal of International Economics, 27(1-2), 25-45. Feng, L., Li, Z., and Swenson, D., 2016, The Connection between Imported Intermediate
Inputs and Exports: Evidence from Chinese Firms, Journal of International Economics, 101, 86-101.
Görg, H., Halpern, L., and Muraközy, B., 2017, Why Do within Firm-product Export Prices Differ across Markets?, The World Economy, 40(6), 1233–1246.
Hallak, J.C. and Sivadasan, J., 2013, Product and Process Productivity: Implications for Quality Choice and Conditional Exporter Premia, Journal of International Economics, 91(1), 53-67.
Han, J., Liu, R., Marchand, B.U., and Zhang, J., 2016, Market Structure, Imperfect Tariff Pass-through, and Household Welfare in Urban China, Journal of International Economics, 100, 220-232.
Ishikawa, J. and Mukunoki, H., 2008, Effects of Multilateral Trade Liberalization on Prices,
Review of International Economics, 16(1), 37-44.
Khandelwal, A., 2010, The Long and Short (of) Quality Ladders, Review of Economic Studies, 77(4), 1450-1476.
Khandelwal, A., Schott, P., and Wei, S., 2013, Trade Liberalization and Embedded Institutional Reform: Evidence from Chinese Exporters, American Economic Review, 103(6), 2169-2195.
Kugler, M. and Verhoogen, E., 2011, Prices, Plant Size, and Product Quality, Review of
Economic Studies, 79(1), 307-339.
Lerner, A.P., 1936, The Symmetry between Import and Export Taxes, Economica, 3(11), 306-313.
Ludema, R. and Yu, Z., 2016, Tariff Pass-Through, Firm Heterogeneity and Product Quality,
Journal of International Economics, 103, 234–249.
Marchand, B.U., 2012, Tariff Pass-through and the Distributional Effects of Trade Liberalization, Journal of Development Economics, 99(2), 265-281.
Melitz, M.J., 2003, The Impact of Trade on Intra ‐Industry Reallocations and Aggregate Industry Productivity, Econometrica, 71(6), 1695-1725.
22
Metzler, L.A. 1949, Tariffs, the Terms of Trade, and the Distribution of National Income,
Journal of Political Economy, 57(1), 1-29.
Olarreaga, M. and Ozden, C., 2005, AGOA and Apparel: Who Captures the Tariff Rent in the Presence of Preferential Market Access?, The World Economy, 28(1): 63-77.
Ozden, C. and Sharma, G., 2006, Price Effects of Preferential Market Access: Caribbean Basin Initiative and the Apparel Sector, World Bank Economic Review, 20(2): 241-259.
Rauch, J., 1999, Networks Versus Markets in International Trade, Journal of International
Economics, 48(1), 7-35.
Raimondos, P. and Woodland, A., 2018, Reciprocity in Trade Negotiations and Welfare,
Journal of International Economics, 111, 134-142.
Taussing, F., 1927, International Trade, New York: Macmillan.
Venables, A.J., 1987, Trade and Trade Policy with Differentiated Products: A Chamberlinian-Ricardian Model, The Economic Journal, 97(387), 700-717.
Verhoogen, E.A., 2008, Trade, Quality Upgrading, and Wage Inequality in the Mexican Manufacturing Sector, Quarterly Journal of Economics, 123(2), 489-530.
23
Table 1. Global Average of Tariff Pass-through
(I) (II) (III) ln (1 + Tariff) 0.041*** -0.033*** 0.084***
[0.004] [0.005] [0.010] Exporter-Importer-Product YES YES YES Exporter-Importer-Year YES YES YES Exporter-Product-Year NO YES YES Importer-Product-Year NO NO YES Number of obs 57,781,720 57,781,720 57,781,720 Adj R-squared 0.7499 0.7588 0.7749
Notes: The dependent variable is a log of trade prices. ***, **, and * indicate 1%, 5%, and 10% significance,
respectively. Parentheses contain the robust standard error.
Table 2. Decomposition into Quality-adjusted Prices and Quality
(I) (II) (III) Quality-adjusted prices
ln (1 + Tariff) -1.290*** -1.101*** -1.105*** [0.006] [0.006] [0.013] Exporter-Importer-Product YES YES YES Exporter-Importer-Year YES YES YES Exporter-Product-Year NO YES YES Importer-Product-Year NO NO YES Number of obs 57,781,720 57,781,720 57,781,720 Adj R-squared 0.9617 0.9639 0.972 Quality ln (1 + Tariff) 1.332*** 1.067*** 1.189*** [0.007] [0.007] [0.016] Exporter-Importer-Product YES YES YES Exporter-Importer-Year YES YES YES Exporter-Product-Year NO YES YES Importer-Product-Year NO NO YES Number of obs 57,781,720 57,781,720 57,781,720 Adj R-squared 0.9285 0.932 0.9425
Notes: ***, **, and * indicate 1%, 5%, and 10% significance, respectively. Parentheses contain the robust
24
Figure 1. Equilibrium cut-offs under productivity sorting
25
Figure 3. Equilibrium cut-offs under quality sorting


![Table B4. Decomposition into Quality-adjusted Prices and Quality: Differentiated versus Nondifferentiated Products Differentiated Non-differentiated Quality-adjusted prices ln (1 + Tariff) -1.137*** -1.006*** [0.015] [0.026] Number of obs 41,024,355 16,7](https://thumb-ap.123doks.com/thumbv2/123deta/9909724.1377898/32.892.165.726.151.399/decomposition-quality-adjusted-differentiated-nondifferentiated-products-differentiated-differentiated.webp)