1.はじめに
筆者は2012年9月27日~ 9月30日の4日間,イタリア,
ローマ市郊外のRome Cavalieriホテルを会場に開催され
た,International Federation of Sports Medicine(FIMS)
が主催するⅩⅩⅩⅡ World Congress of Sports Medicine
(FIMS World congress)にて発表の機会を得たので,そ
の模様を報告する.
2.会議の概要
FIMS World congressは,隔年開催され今回で32回
を 数 え る 歴 史 あ る 国 際 会 議 で あ る.International
Federation of Sports Medicineの名の通り,参加者は
2,700名余り,筆者が発表したポスターセッションだ
けでも655演題の大規模な会議であった.3回の全体
シンポジウムのテーマは,1. Physical activity, heart
and health, 2. Molecular biology in sports medicine,
3. Lifestyle intervention for non-communicable
diseases-the role of sport and exercise medicineと幅
広く,分科会の各セッションにおいても,健康づくり
から,競技パフォーマンス向上,スポーツ傷害等々の
スポーツ医科学全般に渡る広範囲なテーマが取り扱わ
れた.
3.研究発表
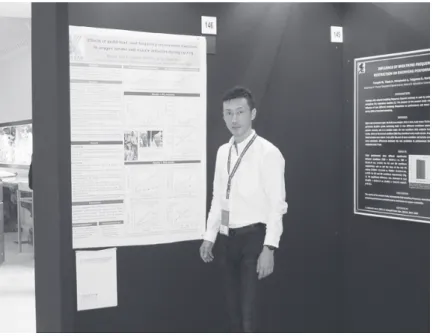
発表に用いたポスターは,Fig.1に示した.Fig.2は
シンポジウム,Fig.3はポスター会場の様子である.
発表の概要を以下に記す.
1)タイトル
Effects of pedal load- and frequency-incremental
exercises in oxygen uptake and muscle activities
during cycling.(自転車運動におけるペダル負荷およ
び速度漸増運動が酸素摂取量と筋活動に及ぼす効果)
2)目的
本研究の目的は,ペダル負荷および速度を漸増させ
た2種類の自転車運動時のパワー発揮に対する,酸素
摂取量と大腿部の筋の電気的活動の反応を明らかにす
ることである.
3)方法
① 被験者
8名の男子大学生(21.0±0 歳,身長170.0±3.4
cm,体重66.8±6.4 kg)が自発的に実験に参加した.
② 実験
以下の通り,自転車エルゴメーターを用いた2種
類の運動負荷試験を実施した.
・負荷漸増運動
(pedal load-incremental exercise;LI)
3分間の安静後,2分毎に0.5kpから3.0kpまで
0.5kp毎に負荷を増加させた一定の速度(60rpm)
の自転車運動を実施した.
・速度漸増運動
[各種報告]
ⅩⅩⅩⅡ World Congress of Sports Medicine 参加報告
得居 雅人*
A participation report on ⅩⅩⅩⅡ World Congress of
Sports Medicine
Masato TOKUI*
九 共 大 紀 要
第4巻 第1号
2013年 9 月
*九州共立大学スポーツ学部スポーツ学科
*Department of Sports Science, Kyushu Kyoritsu
University
46
得居 雅人
(pedal frequency-incremental exercises;FI)
3分間の安静の後,2分毎に40,60,80,100,
120rpmと 速 度 が 増 加 す る5段 階 の 一 定 負 荷
(0.5kp)の自転車運動を実施した.
③ 測定項目
以下の項目を,負荷試験を通して測定した.
・酸素摂取量
(A-E 300S, Minato Medical Science, Japan).
・大腿の5つの筋(外側広筋vastus lateralis; VL,
内 側 広 筋vastus medialis; VM, 大 腿 直 筋rectus
femoris; RF, 大腿二頭筋biceps femoris; BF, and
semitendinosus; ST) の 筋 電 図 信 号(EMG
signal:MQ8, Marq Medical, Denmark).
・ペダル回転数(rpm)算出のため,エルゴメー
ターの車輪に取り付けられたセンサーを用いた車
輪の回転周波数(Hz).
④ データ解析
以下の通り,データを算出した.
・酸素摂取量と筋電図の積分値は,運動負荷試験
の各ステージにおける最後の30秒間の平均値を
採用した.
・筋電図の積分値は,最大収縮時の値により標準
化した(% iEMG).
・総パワーは,ペダルに対して発揮される外的パ
ワーと脚筋自身を回転させる内的パワー(Minetti
et al. 2001)の合計とした.
4) 結果
① 酸素摂取量
LIにおいて,ペダル負荷の増加に伴い酸素摂取
量は直線的に増加した.FIでは,ペダル回転数の
増加に伴い酸素摂取量は指数関数的に増加した.
総パワーの変化に対する酸素摂取量の反応は,LI
とFIの両テストにおいてほぼ同様な直線関係を示
した.
② 筋の電気的活動
LIにおいて,ペダル負荷の増加に伴い% iEMG値
は直線的に増加した.FIではペダル回転数の増加
に伴い% iEMG値は指数関数的に増加した.単関
節筋群(VL, VM)においては,% iEMG値は~
50%の値を示したが,二関節筋群(RF, BF, ST)
における% iEMG値は~ 10%程度であった.総パ
ワーに対する% iEMG値は,両テストで同様な直
線関係を示した.
5)結論
本研究結果は,エネルギー代謝率と大腿の筋活動は
出力された総パワーに比例して増加することが明らか
となったが,出力された力,および筋収縮速度の増加
パターンの違いがそれぞれの筋活動パターンの違いに
影響することが示唆された.
4.おわりに
今回は,歴史あるFIMS World Congressに発表の機
会を得た.これだけの学会にも関わらず日本人の参加
は僅かであったように思う.押し寄せるグローバル化
の波は避けようもなく,大学の国際化を推進するため
にも我々が率先して世界に出て行かなければならない
ことを肝に銘じて研究に取り組みたい.
Received date 2013年7月9日
47
ⅩⅩⅩⅡ World Congress of Sports Medicine 参加報告
Fig. 1.Poster
E
f
f
e
c
t
s
of pedalload-and frequency-incremental exercises
i
n
oxygen uptake and muscle a
c
t
i
v
i
t
i
e
s
during c
y
c
l
i
n
g
Masato TOKUP)
,
Takashi MIGITA2)
,
I
く
o
h
j
iHlRAKOBA3)
1) Kyushu Kyoritsu Univ. (Japan)
,
2)I
くurumeUniv. (Japan),
3)Kyushu Institute of Technology (Japan)-
・
・
E
盲
冒
胃
開
E
官
司
容
官
官
開
閉
fi
烹
恒
罰
摂
理
・
・
・
・
n
-
.
言
問
胃
悶
胃
n
官
官
寝
間
需
朝
間
烹
恒
罰
烹
置
・
To investigate the responses of pulmonary oxygen uptake and electromyographic activities in thigh muscles to power output during cyclingintwo different incrementalexercisestress tests: pedalload -incremental (L!) and丘equency-incrementalexercises (FI)
-
・
・
・
・
・
・
・
・
・
・
・
・
・
E
胃
官
曹
摂
司
・
・
・
・
・
・
・
・
・
・
・
・
・
・
[SubjectslEight healthy malestudents(age 21.0土o
yr, height 170.C土3.4cm, body mass 66.8:f:6.4kg)voluntarilyparticipated in this study [Experimentalprotocol】 Subjectswereevaluated on a friction cycle ergometerinLIandFIstresstestsondi町erentdays(Fig.1. left panel).LIwas started in 0.5 kp for 2 min, followed by increasing 0.5 kp in every 2 min until reachingin 3.0 kp, at a constantpeda!世equencyof 60rpm throughout the exercise stress test(Fig.2. !eft panel).FIconsisted of five levels of pedal frequencies (40, 60, 80, 100 and120rpm), which was increasedevery2 min, at a constant pedalload of 0.5 kp (Fig. 2. right panel) [Measurements] The followingvariables were measured throughout the stress tests • Pulmonary oxygen uptake(VO,)(A-E 300S, Minato Medical Science, Japan) ・Electromyogram(EMG) signals of5 thigh muscles(vastuslateralis; VL, vastus medialis;VM, rectus femoris; RF, bicepsたmoris; BF, and semitendinosus; ST) ゆ~Q8,Marq Medical, Denmark) (Fig.1. upper panel) . Flywheel frequency using a IC hall sensor attached to cycle ergometer in order to analyze pedal世equency(中m) [Dataanalysis) The following data werecalculated • V02 and integratedEMG (iEMG) values wereaveraged last 30 seconds each stage ・iEMGvalue was normalized by thevalueat maximal voluntary contraction (%iEMG) . Total power (TP)was estimated as thesum of extemal power (EP) addedto pedalandintemal power(lP)exertedin exercising musde itse1f(Minetti et al 2001) R~恥'.f.'Wi4i !X!1íLì/
2,500 2.000 1.5∞
言 ~ 1,000/
卿 叩 叩 m m m ( E - E 2 E } 刊 O ﹀ 120 60 80 100 Pedal f問quency(rpm) Fig. 4. V02 response during FI stress test 3,000,
2,500 2,000 E 1,5凹 ミ ε ~'" 1,0凹 500 o o 100 150 200 To凶power(W) Fig.5. Re1ationship beれ;veenV02 to tota1 power output duringLIandFIstresstests 40 • LI• FI 500 1.0 1.5 2.0 2.5 Pedalload(kp) Fig. 3. V02 response duringLIstresstest 3.0 0.5 250 50 Fig.1.Experimentalscenery(1eft)and EMG electrode placement (upper)-
・
・
・
・
・
・
・
・
・
・
Results ①V 02 response 'L! → V 02 was raisedlinearlywith increasing pedalload (Fig. 3)• FI→ V 02 was increased exponentially with increasing pedal frequency (Fig. 4)
・V 02change to TP showed almost same linearrelationship during Ll and FI stresstests (Fig. 5)
② EMG activity
'L! → Normalized iEMG (%iEMG) was raisedlinearlywith increasing pedalload(Fig. 6)
・FI→%iEMGwas increasedexponentially with increasingpedal
仕equency(Fig. 7).
・%iEMGinmono-articular (MA: VL and VM) and bi-articular muscle groups (BM: RF, BF and ST) showed different responses duringL! and FI stress tests (Fig. 6, 7)
• Therefore, the relation between sum of %iEMG inM A, or BA muscle groups and total power was examined. The %iEMG values in M A muscle group were greater than in B A muscle group. The di印erenceof %iEMG between M A and BA muscle groups in L! was largerthan in FL (Fig. 8)
• However