Isolation and taxonomy study of unexplored
microbial resource Ktedonobacteria for
discovery of novel bioactive compounds
著者
Zheng Yu
学位授与機関
Tohoku University
学位授与番号
11301甲第19328号
博士論文
Isolation and taxonomy study of unexplored microbial resource
Ktedonobacteria for discovery of novel bioactive compounds
(未開拓微生物資源クテドノバクテリアの分離と系統分類
及び新規生物活性物質の探索)
i
List of contents
Chapter 1. General introduction ... 1
1.1 Accelerating antimicrobial resistance ... 1
1.2 Actinomycetes contributed for natural products ... 1
1.3 The class Ktedonobacteria represents a promising microbial resource ... 2
1.4 Research objectives and composition of this study ... 4
1.5 Tables and Figures in Chapter 1 ... 5
Chapter 2. Isolation and taxonomic study of the class Ktedonobacteria ... 6
2.1 Introduction ... 6
2.1.1 Phylogeny history of the class Ktedonobacteria prior to this study ... 6
2.1.2 Predominate habitats of Ktedonobacteria and "Tengu-no-mugimeshi" ... 7
2.1.3 Strain information of eight unclassified Ktedonobacteria isolates obtained from abroad ... 9
2.1.4 Prokaryotic sporangia formation prior to this study ... 10
2.1.5 Research objectives and composition of Chapter 2 ... 12
2.2 Materials and Methods ... 12
2.2.1 Sample collection of "Tengu-no-mugimeshi", soils from Mt. Zao, and clay soils from Onikobe geothermal area ... 12
2.2.2 Metagenomic analysis of the bacterial community composition of "Tengu-no-mugimeshi" ... 13
2.2.3 Semi-selective isolation of Ktedonobacteria strains ... 18
2.2.4 16S rRNA gene-based identification and phylogenetic analysis of the novel Ktedonobacteria isolates ... 19
2.2.5 Morphological analysis of the novel Ktedonobacteria isolates ... 20
2.2.6 Physiological analysis of the novel Ktedonobacteria isolates ... 28
2.2.7 Chemotaxonomic analysis of the novel Ktedonobacteria isolates ... 32
2.2.8 Whole genome-based phylogenomic analysis of the novel Ktedonobacteria isolates ... 46
2.2.9 Laboratory preservation and public deposition of the Ktedonobacteria isolates ... 47
2.3 Results and Discussion ... 48
2.3.1 Bacterial community composition of "Tengu-no-mugimeshi" ... 48
2.3.2 Isolation and 16S rRNA-gene based identification of Ktedonobacteria isolates ... 51
ii
2.3.3 Morphology of the class Ktedonobacteria ... 54
2.3.4 Physiology of the class Ktedonobacteria ... 58
2.3.5 Chemotaxonomy of the class Ktedonobacteria ... 59
2.3.6 Comparison of taxonomic traits of the class Ktedonobacteria with other bacterial taxa ... 61
2.3.7 Phylogeny of the class Ktedonobacteria ... 62
2.4 Description of the novel Ktedonobacteria isolates ... 64
2.4.1 Description of the novel Ktedonobacteria isolates ... 64
2.4.2 Emended description of the class Ktedonobacteria ... 68
2.5 Conclusion of Chapter 2 ... 70
2.6 Figures and Tables in Chapter 2 ... 71
Chapter 3. Whole genome sequencing, general genome features, and biosynthetic potential predication of the class Ktedonobacteria ... 99
3.1 Introduction ... 99
3.1.1 Bacterial genomes ... 99
3.1.2 Biosynthetic gene clusters (BGCs) for secondary metabolites... 101
3.1.3 Carbohydrate-active enzymes (CAZymes) for biomass degradation ... 102
3.1.4 Research objectives and composition of Chapter 3 ... 103
3.2 Materials and Methods ... 104
3.2.1 Strain cultural conditions and extraction of genomic DNA ... 104
3.2.2 Whole genome sequencing and de novo assembly ... 106
3.2.3 Bioinformatics analysis ... 107
3.3 Results and Discussion ... 110
3.3.1 Whole genome sequencing and general genome features of the class Ktedonobacteria ... 110
3.3.2 Comparative genomic analysis for the presence of mega-plasmid ... 113
3.3.3 Secondary metabolites biosynthetic potential of the class Ktedonobacteria . 117 3.3.4 CAZYmes biosynthetic potential of the class Ktedonobacteria ... 121
3.4 Conclusion of Chapter 3 ... 124
3.5 Figures and Tables in Chapter 3 ... 125
Chapter 4. Antimicrobial activity of the class Ktedonobacteria and isolation of novel bioactive compounds ... 144
4.1 Introduction ... 144
iii
4.1.2 Natural product isolation and identification ... 145
4.1.3 Research objectives and composition of Chapter 4 ... 148
4.2 Materials and Methods ... 148
4.2.1 Strains and cultural conditions ... 148
4.2.2 Extraction of secondary metabolites from six representative Ktedonobacteria strains for antimicrobial and physico-chemical (PC) screening ... 151
4.2.3 Bioassay-guided isolation of anti-tuberculosis compound from Ts. hazakensis COM3 ... 153
4.2.4 Bioassay-guided isolation of anti-MSSA compound from Ts. hazakensis COM3 ... 157
4.3 Results and Discussion ... 159
4.3.1 Antimicrobial and physico-chemical screening of the crude extract of six representative Ktedonobacteria strains ... 159
4.3.2 Bioassay-guided isolation of anti-tuberculosis compound from Ts. hazakensis COM3 ... 161
4.3.3 Bioassay-guided isolation of anti-MSSA compound from Ts. hazakensis COM3 ... 162
4.4 Conclusion of Chapter 4 ... 164
4.5 Figures and Tables in Chapter 4 ... 165
Chapter 5. Cloning of a type II PKS gene cluster from Ts. hazakensis COM3 ... 177
5.1 Introduction ... 177
5.1.1 Techniques to maximize gene clusters for compounds production ... 177
5.1.2 Direct cloning of biosynthetic gene cluster by TAR in yeast ... 178
5.1.3 Research objective of Chapter 5 ... 179
5.2 Materials and Methods ... 182
5.2.1 Strains, plasmids, and cultural conditions ... 182
5.2.2 Construction of COM1 gene cluster specific capture vector pCAP01-COMSp ... 184
5.2.3 TAR-based cloning of COM1 gene cluster ... 186
5.3 Results and Discussion ... 192
5.3.1 Identification of COM1 biosynthesis (COM1) gene cluster ... 192
5.3.2 TAR-based cloning of COM1 gene cluster ... 193
5.4 Conclusion of Chapter 5 ... 194
5.5 Figures and Tables in Chapter 5 ... 196
iv
References ... 206 Acknowledgements ... 226
1 Chapter 1. General introduction
1.1 Accelerating antimicrobial resistance
Ever since Alexander Fleming discovered the first medical antibiotics of penicillin in 1928, the clinical application of modern antibiotics have greatly improved our well-being with regard to microbial infection over the past several decades (Demain & Sanchez, 2009). However, misuse and overuse of antibiotics in humans and animals in recent years have accelerated the development of antimicrobial resistance in bacterial pathogens such as the Gram-positive methicillin-resistant
Staphylococcus aureus (MRSA), vancomycin-resistant Enterococcus (VRE),
multi-drug-resistant Mycobacterium tuberculosis (MDR-TB), and the Gram-negative carbapenem-resistant Enterobacteriaceae (CRE) gut bacteria (Jansen & Aktipis, 2014; Jiang et al., 2017; Melander et al., 2018). Moreover, a growing number of infections are becoming harder to treat as the current antibiotics become less effective, thus may lead to 10 million deaths per year by 2050 (Jiang et al., 2017; Tacconelli et al., 2018). Given that, the discovery of novel antibiotics is extremely urgent.
1.2 Actinomycetes contributed for natural products
Numerous natural products, which are derived from microbial secondary metabolites including the non-ribosomal peptides (NRPs), polyketides (PKs), and post-translationally modified peptides (RiPPs), exhibit immense structural diversity and complexity, and represent a rich reservoir of pharmaceutically and industrially important compounds for antibiotics discovery (Newman & Cragg, 2016). Traditionally, actinomycetes, particularly the genus Streptomyces, has served as the major producer of antimicrobial natural products, producing some well-known antibiotics such as streptomycin, tetracycline, vancomycin, and some antifungals, immunosuppressants, antiparasitics, etc. (Procópio et al., 2012). However, although Streptomyces had contributed 62% of the microbe-derived antibiotics from the 1950s to 1970s, the ratio has now decreased to 25% in the 2000s to 2010s, with the frequent re-discovery of known compounds further hampering the discovery of novel antibiotics via the traditional bacterial fermentation method
2
(Berdy, 2012). Hence, isolation and screening of rare actinomycetes and marine-derived actinomycetes have become popular (Ding et al., 2019; Subramani & Sipkema, 2019). Furthermore, the application of in silico biosynthetic predictions from genome mining data and novel developed heterologous expression technologies confirm actinomycetes as a continuing source of novel antibiotics (Berdy, 2012; Genilloud, 2017). Nevertheless, it is of high risk to focus the discovery of novel natural products on only a single phylum as this source could become exhausted. Thus, the exploration of new microbial resources comparable to actinomycetes is extremely important and essential.
1.3 The class Ktedonobacteria represents a promising microbial resource The class Ktedonobacteria was first reported in 2006 for the Gram-positive, aerobic, filamentous bacterial lineage within the phylum Chloroflexi (Cavaletti et al., 2006). Notably, Ktedonobacter racemifer SOSP1-21T, the first proposed Ktedonobacteria species, was initially mistakenly identified as an actinomycete
owing to the high morphological similarities (Cavaletti et al., 2006). However, phylogenetic analysis based on 16S ribosomal RNA (rRNA) gene sequences placed the class Ktedonobacteria in the phylum Chloroflexi which was far separated from actinomycetes (Cavaletti et al., 2006). Similar to actinomycetes, isolates and environmental DNA belonging to this class were detected to be ubiquitous in various terrestrial environments from common soil to extreme environments (de Miera et al., 2014; Jiang et al., 2016; Stres et al., 2013; Tebo et al., 2015). However, unlike most Streptomyces species which inhabit the soil environment and live as saprophytic bacteria (Flärdh & Buttner, 2009), the class
Ktedonobacteria appears to preferentially predominate in oligotrophic and extreme
environments (de Miera et al., 2014; Jiang et al., 2016; Kim et al., 2015; Lynch et al., 2012; Northup et al., 2011; Stres et al., 2013; Tebo et al., 2015; Yabe et al., 2017a), suggesting these bacteria may possess different metabolic pathways from actinomycetes.
Notably, as shown in Fig. 1-1, some isolated Ktedonobacteria strains exhibit complex morphologies. The genus Thermosporothrix forms substrate mycelia and
3
subsequently produces grape-like smooth exospores by budding on the aerial mycelia (Yabe et al., 2010b), whereas the surfaces of exospores formed by the genus Thermogemmatispora are wrinkled (King & King, 2014; Yabe et al., 2011). In contrast, strain K. racemifer SOSP1-21T forms spherical spores with a dried
plum shape on aerial mycelia (Cavaletti et al., 2006), whereas Dictyobacter
aurantiacus S27T produces globose or subglobose terminal sporangia from the
vegetative mycelia via short stalk cells (Yabe et al., 2019). It is known that spore formation in bacterial species represents one of the numerous methods developed by bacteria to survive in conditions of nutrient depletion or harsh environment (Errington, 2003; Flärdh & Buttner, 2009). It has also been suggested that bacteria with complex morphological differentiation may possess an active secondary metabolism (Flärdh & Buttner, 2009; Manivasagan et al., 2014), and previous studies conducted in our laboratory indeed revealed broad-spectrum antimicrobial activity of the culture broth extracts of Ktedonobacteria against Gram-positive
Micrococcus luteus, Bacillus subtilis, Staphylococcus aureus Mu50 (MRSA), and
Gram-negative Escherichia coli. Moreover, the metabolites of new acyloins and thiazoles have also been identified in the fermentation broth of Thermosporothrix
hazakensis SK20-1T (Park et al., 2014; Park et al., 2015).
In addition, the released genome draft data revealed that the genome sizes of thermophilic strains Thermogemmatispora onikobensis ONI-1T (Komaki et al.,
2016) and Thermogemmatispora carboxidivorans PM5T were 5.56 Mb and 5.61
Mb, respectively, whereas mesophilic strain K. racemifer SOSP1-21T supported a
large genome of 13.66 Mb (Chang et al., 2011), which is the second largest bacterial genome identified to date following that of Sorangium cellulosum So0157-2 (14.78 Mb) (Han et al., So0157-2013a). Moreover, the large genome sizes also enables the class Ktedonobacteria to possess more biosynthetic gene clusters (BGCs) for secondary metabolites in their genomes (Donadio et al., 2007). Together, these described characteristics encouraged us to consider the class Ktedonobacteria as a Gram-positive, novel microbial resource for bioactive NPs discovery.
4
1.4 Research objectives and composition of this study
However, although the class Ktedonobacteria represents a promising microbial resource, some limitations remain to be solved: 1) The class Ktedonobacteria contains only two orders, three families, four genera, and seven formally proposed species prior to this study (Cavaletti et al., 2006; King & King, 2014; Yabe et al., 2011; Yabe et al., 2010b; Yabe et al., 2017b; Yabe et al., 2016), which is extremely insufficient in comparable to Streptomyces (more than 550 species) on the number of isolated strains; 2) Phylogenetic position and genome features of this class remained unclear. Moreover, although the large genome size of the
Ktedonobacteria species suggest that they might encode multiple BGCs for
secondary metabolites (Donadio et al., 2007; Li & Walsh, 2010; Omura et al., 2001), few descriptions of these gene clusters or their novel natural product biosynthetic potential have been literatured. 3) There had been no studies yet focusing on discovering novel bioactive compounds from the class Ktedonobacteria.
Accordingly, in this study, I attempted to isolate novel members of the class
Ktedonobacteria by screening candidate strains isolated from terrestrial
environments in Chapter 2. Phylogenetical, morphological, physiological, and chemotaxonomic characterizations of these isolates were also analyzed to comprehensively study the taxonomic common features and diversities of the class. In Chapter 3, I performed whole genome sequencing for 18 Ktedonobacteria strains. The total 23 available Ktedonobacteria genomes were then subjected to comprehensive phylogenetic, genomic, secondary metabolic and genome-wide cellulolytic analysis, revealing the unique genome features and biosynthetic potential of this class for novel secondary metabolites and carbohydrate-active enzymes (CAZymes) via in silico analysis. In Chapter 4, I extracted the culture broth of six representative Ktedonobacteria strains and assessed the in vitro antimicrobial activity against a variety of bacterial strains. I also focused on the thermophilic strain Thermosporothrix hazakensis COM3 and mesophilic strain
Dictyobacter alpinus Uno16T to attempted to isolate novel bioactive compounds.
In Chapter 5, I adapted a transformation-associated recombination (TAR) methodology attempting to clone and heterologous express a type II polyketide
5
synthase (PKS) gene cluster from the aforementioned Ts. hazakensis COM3 to produce an antimicrobial polyketide compound.
Given our findings here, I conclude in Chapter 6 that, the Gram-positive, aerobic, and filamentous Ktedonobacteria represents a versatile and promising microbial resource for pharmaceutical and biotechnological use.
1.5 Tables and Figures in Chapter 1
Figure 1-1. Morphology of the class Ktedonobacteria. Scanning electron micrographs of strain Ktedonobacter racemifer SOSP1-21T (A), Thermosporothrix hazakensis SK20-1T (B), Thermogemmatispora onikobensis ONI-1T (C), and Dictyobacter aurantiacus S27T (D), indicating the putative exospores/sporangia
6
Chapter 2. Isolation and taxonomic study of the class Ktedonobacteria
2.1 Introduction
2.1.1 Phylogeny history of the class Ktedonobacteria prior to this study
As aforementioned in Chapter 1, phylogenetic analysis based on 16S rRNA gene sequences placed the class Ktedonobacteria into the phylum Chloroflexi (Cavaletti et al., 2006; Yabe et al., 2010b), as shown in Fig. 2-1. Members of the phylum
Chloroflexi, especially the class Chloroflexi, are generally known as filamentous
anoxygenic phototrophs, also termed filamentous green non-sulfur bacteria (Björnsson et al., 2002). The phylum Chloroflexi also constitutes a deeply branched bacterial lineage encompassing classes of bacteria with diverse metabolic types from strictly anaerobic chlorinated hydrocarbon reducers to filamentous aerobic heterotrophs. Moreover, the majority of the members of the phylum Chloroflexi are Gram-stain negative and do not contain peptidoglycan or atypical peptidoglycan in cell walls or lipopolysaccharide-containing outer membrane (Hugenholtz & Stackebrandt, 2004; Yamada et al., 2006). Currently, the phylum Chloroflexi is divided into six formally proposed classes including class
Chloroflexi (Björnsson et al., 2002), class Thermomicrobia (Hugenholtz &
Stackebrandt, 2004), class Dehalococcoidetes (Hugenholtz & Stackebrandt, 2004), class Anaerolineae (Yamada et al., 2006), class Caldilineae (Yamada et al., 2006), and class Ktedonobacteria (Cavaletti et al., 2006; Yabe et al., 2010b). However, the phylogenetic association between the class Ktedonobacteria and the phylum
Chloroflexi was suspected owing to the low bootstrap values in the 16S rRNA gene
sequence phylogenetic tree (Fig. 2-1) and the dissimilarities in morphological, physiological, and chemotaxonomic data between the two (Cavaletti et al., 2006). In the bacterial taxonomy prior to this study, the class Ktedonobacteria contained
two orders: Ktedonobacterales (Cavaletti et al., 2006) and
Thermogemmatisporales (Yabe et al., 2011). Order Ktedonobacterales consists of
four species with validly published names: Ktedonobacter racemifer (Cavaletti et al., 2006) and Dictyobacter aurantiacus (Yabe et al., 2017b) in the family
7
(Yabe et al., 2010b) and Thermosporothrix narukonensis (Yabe et al., 2016) in the
family Thermosporotrichaceae (Yabe et al., 2010b). Order
Thermogemmatisporales contains three cultured species with validly published
names: Thermogemmatispora onikobensis (Yabe et al., 2011),
Thermogemmatispora foliorum (Yabe et al., 2011), and Thermogemmatispora carboxidivorans (King & King, 2014), all in family Thermogemmatisporaceae
(Yabe et al., 2011).
2.1.2 Predominate habitats of Ktedonobacteria and "Tengu-no-mugimeshi"
Among the seven publically proposed Ktedonobacteria species prior to this study:
K. racemifer SOSP1-21T was isolated from soil collected from a black locust woods
in Gerenzano, Italy, and grows optimal at 25~30 °C (Cavaletti et al., 2006); Ts.
hazakensis SK20-1T was isolated from ripe compost used for the treatment of
livestock excreta, Japan, and grows optimal at 50 °C (Yabe et al., 2010b); Tg.
onikobensis ONI-1T and Thermogemmatispora foliorum ONI-5T were isolated from
fallen leaves sampled from geothermal soils at Jigokudani in Onikobe geothermal area in Miyagi Prefecture, Japan, and grows optimal at 55~65 °C (Yabe et al., 2011); Tg. carboxidivorans PM5T was isolated from geothermally heated biofilm
collected from Puhimau geothermal area located on the east rift zone of Kilauea Volcano, Hawaii, USA, and grows optimal at 55~65 °C (King & King, 2014). Moreover, Tg. carboxidivorans PM5T was reported to oxidize carbon monoxide
(CO) although it did not grow with CO as a sole carbon and energy source. The analysis results indicated that Ts. hazakensis SK20-1T and Tg. onikobensis
ONI-1Talso had the capacity to uptake CO (King & King, 2014); Thermosporothrix narukonensis F4T was isolated from fallen leaves on geothermal soil collected from
Jigokudani geothermal area near the locality of Onikobe in the Naruko hot springs region of Miyagi Prefecture, Japan, and grows optimal at 50 °C (Yabe et al., 2016);
Dictyobacter aurantiacus S27T was isolated from soil collected from a waterlogged
rice paddy field on the mountainside of Gunung Salak (Mount Salak) in West Java, Indonesia, and grows optimal at 25~30 °C (Yabe et al., 2017b).
8
As aforementioned in Chapter 1, similar to actinomycetes, environmental DNA clones belonging to this class Ktedonobacteria were detected to be ubiquitous in various terrestrial environments according to (de Miera et al., 2014; Jiang et al., 2016; Kim et al., 2015; Lynch et al., 2012; Northup et al., 2011; Stres et al., 2013; Tebo et al., 2015; Yabe et al., 2017a). According to a previous 16S rRNA gene-based metagenomic analysis conducted by our group (Yabe et al., 2017a), although DNA clones assigned to the class Ktedonobacteria are widely detected in common mesic environments, their relative abundances in the bacterial community are very limited: 0.005~0.8% relative abundances in forest soil; 0.014% relative abundance in garden soil; 0.08% relative abundance in sand; 0.08% relative abundance in bark. By contrast, the class Ktedonobacteria appears to preferentially predominate in oligotrophic and extreme environments: 12.9~37.34% relative abundances in sediment samples in geothermal areas, Jigokudani geothermal area near the locality of Onikobe in the Naruko hot springs region of Miyagi Prefecture, Japan and Rehai geothermal field of Tengchong geothermal area in Yunnan Province, China (Jiang et al., 2016; Yabe et al., 2017a); 33.88~59.67% relative abundances in soils near naturally occurring CO2 gas vents,
Calatrava volcanic field, Guadiana valley, Ciudad Real Province, Spain (de Miera et al., 2014); predominance in basaltic lava caves in volcanic trenchs in Hawai'i and New Mexico, USA and in Azores, Portugal (Northup et al., 2011); dominance in the recently deglaciated high-altitude soils (5,000~6,000 m above sea level) of the Drohmo peak, Himalaya, Nepal (Stres et al., 2013); dominance in the highest-elevation mineral soils (6330 m) of Volcán Socompa and Volcán Llullaillaco, the Atacama region of Argentina and Chile (Lynch et al., 2012); 0~approx. 32% relative abundances in soil samples collected from Terra Nova Bay in Victoria Land of Antarctica (Kim et al., 2015); and approx. 66% relative abundances in sediment samples collected from dark oligotrophic volcanic ice cave ecosystems of Mt. Erebus in Antarctica (Tebo et al., 2015). Moreover, as the dark terrestrial oligotrophic caves share the characteristics of poor in organics, rich in chemical reactants and less human interference, with the earliest periods of Earth or other planets such as Mars, they may represent good environments to preserve the
9
microbial fossils (Tebo et al., 2015). Herein, Ktedonobacteria, the predominate bacterial class in these oligotrophic volcanic caves, may help us to deepen our understanding to the evolution of life on earth.
Besides the oligotrophic and extreme environments abroad, there are also unique oligotrophic environments in which the class Ktedonobacteria predominate, naming "Tengu-no-mugimeshi". The "Tengu-no-mugimeshi" (天狗の麦飯, which means the boiled barley and rice of the Tengu, a type of legendary creature found in Japanese folk religion) is soil-like orange-to-brown colored microbial mass that has been recognized from the mountainous areas (>1,000 m above sea level) in the volcanic zone of central Japan, and is also known as the "eatable soil" (Takahashi, 1935). In addition, studies on the microbial community composition of "Tengu-no-mugimeshi" can be dated back to the last century: Takahashi reported first in 1911 in a local Japanese journal that Nostoc spp. (Cyanobacteria) is the main body of "Tengu-no-mugimeshi". Later, researchers from Tokyo Imperial University (now as The University of Tokyo) and Kyoto Imperial University (now as Kyoto University) reported that filamentous and biofilm-like bacterial structures are the main body of "Tengu-no-mugimeshi" (Kato, 1934; Kawamura, 1916; Molisch, 1926; Ono, 1916; Takahashi, 1935). After that, Dr. Okada from Biological Institute, Tohoku Imperial University (now as Tohoku University) revealed the predominance of filamentous bacteria in "Tengu-no-mugimeshi" (Okada, 1937). Remarkably, with the development of next-generation sequencing technologies, the recent metagenomic sequencing of bacterial 16S rRNA amplicons revealed that the class Ktedonobacteria and Acidobacteria predominate in "Tengu-no-mugimeshi" (Takatori, 2009). However, all of these researchers challenged but finally failed to isolate the predominate bacteria (Ktedonobacteria) from "Tengu-no-mugimeshi".
2.1.3 Strain information of eight unclassified Ktedonobacteria isolates obtained from abroad
Eight unclassified Ktedonobacteria isolates (strains 1, 9, SOSP1-30, SOSP1-52, SOSP1-85, SOSP1-142, 150039, and 150040), which were
10
isolated together from various soil samples with K. racemifer SOSP1-21T (Cavaletti
et al., 2006), were obtained from Dr. Cavaletti, our co-researcher in Vicuron Pharmaceuticals, Gerenzano, Italy, and named the SOSP series. Isolation information of these SOSP series strains are summarized in Table 2-1. According to the 16S rRNA gene-based phylogenetic analysis shown in Fig. 2-1, strains of SOSP1-1, SOSP1-30, SOSP1-52, and SOSP1-85 are clustered with K. racemifer SOSP1-21T, while strains of SOSP1-9 and SOSP1-142 are clustered with D. aurantiacus S27T. Strains of 150039 and 150040, however, form independent
clades in order Ktedonobacterales, indicating their unique phylogenetic positions. Nonetheless, the detailed taxonomic classification of these SOSP series strains remain to be determined.
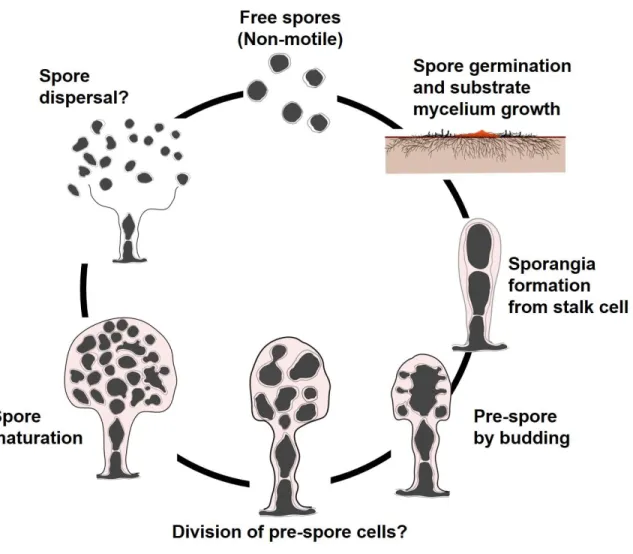
2.1.4 Prokaryotic sporangia formation prior to this study
Sporangia, which enclose sporangiospores inside, are commonly formed by plants and some phyla of fungi (Noblin et al., 2012). In Prokaryotic species, however, the formation of sporangia are only observed in some genera of actinomycetes (such as Actinoplanes) and myxobacteria to date (Barka et al., 2016; Landwehr et al., 2016). Actinoplanes, which is the first sporangia-forming Gram-positive bacteria discovered by (Couch, 1949), germinate from a swimming zoospore under suitable for vegetative growth and form substrate mycelia (Barka et al., 2016; Couch, 1949). After that, Actinoplanes form terminal sporangia from the vegetative mycelia and produce hundreds of spherical and motile spores inside (Barka et al., 2016; Couch, 1949). After releasing, the newborn zoospores swim with a tuft of flagella to start another life cycle of the Actinoplanes (Uchida et al., 2011). By contrast, the formation of sporangia in the Gram-negative myxobacteria was discovered by (Thaxter, 1982), which form species-specific "fruiting-bodies" under starvation conditionsand enclose myxospores inside (Landwehr et al., 2016; Thaxter, 1982). Moreover, as aforementioned in Chapter 1, bacteria with complex morphological differentiation usually possess an active secondary metabolism (Flärdh & Buttner, 2009; Manivasagan et al., 2014), thus these two taxa are characterized as important bacterial resources for discovery of pharmaceutically important compounds (Landwehr et al., 2016). For example, Actinoplanes species produce
11
Valienamine, the precursor to the antidiabetic drug acarbose and the antibiotic validamycin (Zhang et al., 2002); Teicoplanin, a semisynthetic glycopeptide antibiotic with a spectrum of activity similar to vancomycin (Jung et al., 2009); and Ramoplanin, a glycolipodepsipeptide antibiotic drug inhibiting bacterial cell wall biosynthesis (Farver et al., 2005). Moreover, due to the unique life cycle differentiating from other actinomycetes such as the genus Streptomyces, molecular mechanisms that regulate the sporangia formation of Actinoplanes
missouriensis were investigated (Mouri et al., 2018; Mouri et al., 2017).
Consequently, it was figured out that, an orthologue of bldD gene is responsible to globally regulate the transcription of dozens of genes involved in vegetative growth and sporangia formation of A. missouriensis (Mouri et al., 2018; Mouri et al., 2017). The bldD gene has been known as a key global transcriptional regulator responsible for the morphological development of Streptomycetes and are highly conserved among other sporulating actinomycetes (Mouri et al., 2017). Some other genes which are involved in morphological differentiation of actinomycetes include: bldA, bldC, bldD, bldH, bldM, bldN, ssgA, ssgB, whiB, whiD, whiG, etc. (den Hengst et al., 2010).
Among the publically proposed Ktedonobacteria species including K. racemifer
SOSP1-21T, and the genera Thermosporothrix and Thermogemmatispora,
species-specific exospores are formed on branched mycelia as described in Chapter 1. Thus, the globose or subglobose structures formed by D. aurantiacus S27T on branched mycelia was also initially mistakenly recognized as exospores
(Yabe et al., 2017b). Noticeably, the formation of sporangiospores by D.
aurantiacus S27T was accidentally observed on long-term aerobically cultured
(more than two months) 10-fold diluted Reasoner’s 2A (R2A) gellan gum plates. However, sporangia formation of D. aurantiacus S27T was unstable under ordinary
aerobic culture conditions. The details of the life cycle and genetic mechanisms underlying the sporangia formation in D. aurantiacus S27T remain unclear.
12
2.1.5 Research objectives and composition of Chapter 2
In this chapter, aiming to isolate novel Ktedonobacteria strains and comprehensively study the taxonomic traits of class Ktedonobacteria: 1) we collected envomental samples of "Tengu-no-mugimeshi", soils from Mt. Zao, clay soils from Onikobe geothermal area for strain isolation; 2) the isolated
Ktedonobacteria strains together with the eight unclassified Ktedonobacteria
isolates obtained from Dr. Cavaletti, were subjected to a comprehensive phylogenetic, morphological, physiological, and chemotaxonomic analysis to study the taxonomic common features and diversities of the class; 3) culture conditions for stable sporangia formation of D. aurantiacus S27T was investigated and the
putative life cycle and genetic mechanisms were proposed. 4) bacterial community composition of "Tengu-no-mugimeshi" was also investigated via metagonomic analysis.
2.2 Materials and Methods
2.2.1 Sample collection of "Tengu-no-mugimeshi", soils from Mt. Zao, and clay soils from Onikobe geothermal area
The sample of "Tengu-no-mugimeshi" used in this study was collected in July, 2016, with the help of Mr. Yasuaki Kobayashi, landowner of the sampling site. Six "Tengu-no-mugimeshi" samples (1-1a, 1-2a, 1-3a, 1-4a, 1-5a, con2) were collected from an alpine area in Tsumagoi-mura, Agatsuma-gun, Gunma Prefecture, Japan (Fig. 2-2A). Considering the protection of "Tengu-no-mugimeshi" from illegal sampling, geographic location of the sampling sites can not be specified here.
Mt. Zao is a complex and active volcano, located on the border between the Yamagata and Miyagi Prefectures in Japan, and contains an acidotrophic crater lake (pH=3.5) named Okama in the center of the mountain. Moreover, Mt. Zao shares some similarities with the sampling sites of "Tengu-no-mugimeshi" in Tsumagoi-mura. We collected the soil samples for strain isolation at a barren area near the Okama Crater that was not covered by any vegetation (Fig. 2-2B). The
13
approximate geographic location of the sampling site was 38°08ʹN, 140°26ʹE, and was 1600 m above sea level.
Onikobe is one of the most active geothermal areas in Japan and is characterised by very high heat flow and hydrothermal activity (Takada & Furuya, 2010). Moreover, two Thermogemmatispora species (Tg. onikobensis ONI-1T and Tg. foliorum ONI-5T) were isolated from fallen leaves sampled from geothermal soils
at Jigokudani, a walking trail in the Onikobe geothermal area (Yabe et al., 2011). In this study, we collected red clay soils from the mound (Fig. 2-2C) near Jigokudani (38°48ʹN, 140°40ʹE), Onikobe geothermal area of Osaki City, Miyagi Prefecture, Japan.
The collected samples of "Tengu-no-mugimeshi" (Fig. 2-2D), soils from Mt. Zao, and red clay soils from Onikobe geothermal area were placed in Ziploc® plastic
bags (Asahi Kasei Corporation, Tokyo, Japan), transported to the laboratory, and stored at 4 °C until use.
2.2.2 Metagenomic analysis of the bacterial community composition of "Tengu-no-mugimeshi"
2.2.2.1 Extraction of environmental DNA from "Tengu-no-mugimeshi"
Total environmental DNA (eDNA) samples were extracted from 0.1 g of the six "Tengu-no-mugimeshi" samples (1-1a, 1-2a, 1-3a, 1-4a, 1-5a, con2) and two control soils samples (soil1 and soil2) with DNeasy PowerSoil Kit (Qiagen, Hilden, Germany) following the manufacturer’s instructions. Quality and quantity of the extracted eDNA samples were checked with 0.8% agarose gel electrophoresis and BioSpectrometer® basic (Eppendorf, Hamburg, Germany), and stored at -20°C
until later use.
2.2.2.2 PCR amplification of the V3-V4 regions of bacterial 16S rRNA genes A. 1st-round PCR amplification
In the 1st-round PCR, degenerate primer pairs (V3V4f_MIX and V3V4r_MIX) targetingV3-V4 regions of bacterial 16S rRNA genes were used to PCR-amplify these sequences from each eDNA sample. The V3V4_MIX primers contain about
14
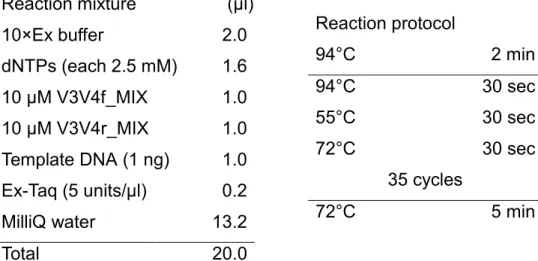
35 bp adapter sequences and 5 bp random sequences on the 5ʹ terminal for Miseq sequencing, as shown in Table 2.2.2.2-1. The PCR amplification was conducted on a Veviti 96-well Thermal Cycler (Applied Biosystems, Foster, USA) with protocol given in Table 2.2.2.2-2, while TaKaRa ExTaq DNA polymerase (Takara Bio, Kusatsu, Japan) was used in the reaction mixture. After that, the PCR amplicons were cleaned up with Agencourt Ampure XP magnetic beads (Beckman Coulter, Inc. Brea, USA), and quality checked with QuantiFluor dsDNA System (Promega Co., Wisconsin, USA) and Synergy H1 (Bio Tek Inc., Vermont, USA) by Bioengineering Lab. Co., Ltd., Japan.
Table 2.2.2.2-1. V3V4_MIX primer pairs used in the 1st-round PCR amplification
Primer Sequences (5'-3')
V3V4f_MIX
ACACTCTTTCCCTACACGACGCTCTTCCGATCT-NNNNN- CCTACGGGNGGCWGCAG
V3V4r_MIX
GTGACTGGAGTTCAGACGTGTGCTCTTCCGATCT-NNNNN-GACTACHVGGGTATCTAATCC
Adapter sequences at the 5' terminal are shown in italic, while sequences homologous to 16S rRNA genes are shown in bold at the 3' terminal. Sequences shown as "N" are the random sequences.
Table 2.2.2.2-2. Reaction mixture (left) and protocol (right) of the 1st-round PCR amplification Reaction protocol 94°C 2 min 94°C 30 sec 55°C 30 sec 72°C 30 sec 35 cycles 72°C 5 min Reaction mixture (µl)l) 10×Ex buffer 2.0 dNTPs (each 2.5 mM) 1.6 10 µM V3V4f_MIX 1.0 10 µM V3V4r_MIX 1.0 Template DNA (1 ng) 1.0 Ex-Taq (5 units/µl) 0.2 MilliQ water 13.2 Total 20.0
15
B. 2nd-round PCR amplification
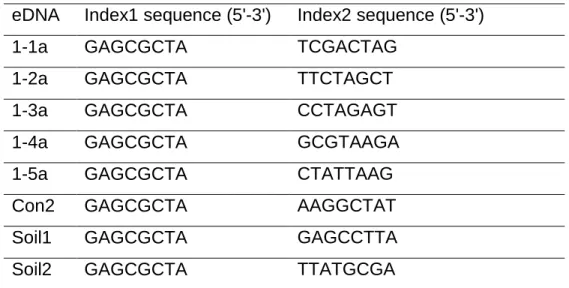
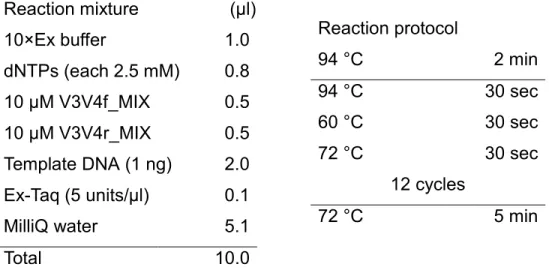
In the 2nd-round PCR amplification, approx. 8 bp index (barcode) sequences were contained at both forward and reverse primers to uniquely identify each eDNA sample (Table 2.2.2.2-3). The tailed PCR amplification were conducted by Bioengineering Lab. Co., Ltd., Japan, following the below reaction miture and protocol (Table 2.2.2.2-4). PCR amplicons obtained from the 1st-round PCR were used as DNA templates. After that, the 2nd-round PCR amplicons were cleaned up and quality checked with the same methods described above.
Table 2.2.2.2-3. V3V4_MIX primer pairs used in the 2nd-round PCR amplification Primer Sequences (5'-3')
2ndF AATGATACGGCGACCACCGAGATCTACAC-Index1-
ACACTCTTTCCCTACACGACGC
2ndR CAAGCAGAAGACGGCATACGAGAT-Index2-
GTGACTGGAGTTCAGACGTGTG
eDNA Index1 sequence (5'-3') Index2 sequence (5'-3')
1-1a GAGCGCTA TCGACTAG
1-2a GAGCGCTA TTCTAGCT
1-3a GAGCGCTA CCTAGAGT
1-4a GAGCGCTA GCGTAAGA
1-5a GAGCGCTA CTATTAAG
Con2 GAGCGCTA AAGGCTAT
Soil1 GAGCGCTA GAGCCTTA
16
Table 2.2.2.2-4. Reaction mixture (left) and protocol (right) of the 2nd-round PCR amplification
2.2.2.3 Sequencing of the PCR amplicons and raw data analysis Illumina MiSeq sequencing
The cleaned 2nd-round PCR amplicons were quality-checked with Fragment Analyzer and dsDNA 915 Reagent Kit (Advanced Analytical Technologies Inc., USA), and sequenced by Bioengineering Lab. Co., Ltd., Japan, using Illumina MiSeq 2 × 300 technology.
Raw data analysis
The raw reads obtained from the Illumina MiSeq sequencing platform were sorted according to the index sequences, trimmed for the primer sequences with the FASTX-Toolkit v. 0.0.13.2 tools (http://hannonlab.cshl.edu/fastx_toolkit), filtered at
minimum threshold of 20 bp in Sickle v. 1.33 software
(https://github.com/najoshi/sickle), and merged with forward and backward sequences by FLASH v. 1.2.10 software (Magoc & Salzberg, 2011) at default mode with the Quantitative Insights Into Microbial Ecology (QIIME) v. 1.8.0 software package (Caporaso et al., 2010). Subsequently, operational taxonomic units (OTUs) were clustered from the non-chimera high-quality reads using the
Reaction protocol 94 °C 2 min 94 °C 30 sec 60 °C 30 sec 72 °C 30 sec 12 cycles 72 °C 5 min Reaction mixture (µl)l) 10×Ex buffer 1.0 dNTPs (each 2.5 mM) 0.8 10 µM V3V4f_MIX 0.5 10 µM V3V4r_MIX 0.5 Template DNA (1 ng) 2.0 Ex-Taq (5 units/µl) 0.1 MilliQ water 5.1 Total 10.0
17
Usearch pepline (Edgar, 2010) at 97% identity and singleton clusters were removed.
2.2.2.4 Assignment of the OTUs for taxonomic classifications and phylogenetic analysis
The generated OTUs were submitted to RDP classifier (Wang et al., 2007) (http://pyro.cme.msu.edu/index.jsp) on the basis of RDP database at a minimum confidence threshold of 80%. The output hierarchy file was used to assign the OTUs for phylum and class level taxonomic classifications. Subsequently in a second round of clustering, OTUs assigned to the class Ktedonobacteria and shared >97 % similarity were clustered again using the QIIME v. 1.8.0 software package (Caporaso et al., 2010). Typically, a 16S rRNA gene similarity threshold of <97% is required to distinguish between two bacterial species (Stackebrandt, 1994). The representative sequences of each Ktedonobacteria OTUs were obtained using the functions pick_otus and pick_rep in QIIME at default mode and singleton clusters were removed.
Sequences of the obtained representative Ktedonobacteria OTUs with >1.0% relative abundance in each "Tengu-no-mugimeshi" sample were integrated into one fasta file with the 16S rRNA gene sequences of the Ktedonobacteria strains and clone sequences in Fig. 2-1 using the BioEdit software (Hall, 1999). Multiple sequences were aligned with CLUSTAL_W (v 1.83) in MEGA v. 7.0 software package (Kumar et al., 2016), and gaps with unidentified bases in these aligned sequences were removed. The neighbour-joining (NJ) (Saitou & Nei, 1987) and maximum-likelihood (ML) (Felsenstein, 1981) phylogenetic trees were reconstructed in the MEGA v. 7.0, with bootstrap values based on 1000 replications. Evolutionary distances were calculated using Kimura’s two-parameter method (Kimura, 1980) for both NJ and ML trees, and the complete deletion option was used for gaps treatment. For ML tree, the Nearest-Neighbor-Interchange (NNI) heuristic search algorithm was used.
18
2.2.3 Semi-selective isolation of Ktedonobacteria strains
To isolate novel Ktedonobacteria strains, the collected samples of "Tengu-no-mugimeshi", soils from Mt. Zao, and red clay soils from Onikobe geothermal area were directly spread on 10-fold-diluted R2A broth medium (Wako Pure Chemical Industries, Ltd., Osaka, Japan) supplemented with 20 ppm sodium azide (Kanto Chemical Co., Inc., Tokyo, Japan) and 50 ppm cycloheximide (Nacalai Tesque, Inc., Kyoto, Japan) to inhibit the growth of actinomycetes and fungi. Sodium azide is a highly water-soluble antibacterial agent used to prevent bacterial contamination (Russo et al., 2008), while cycloheximide is an antifungal agent produced by the bacterium Streptomyces griseus (Sisler & Coursen, 1960). The pH of the medium was adjusted to 6.0 with HCl and NaOH at room temperature, and 1.5 % (w/v) gellan gum (Kanto Chemical Co., Inc., Tokyo, Japan) was added for solidification. Plates spread with samples of "Tengu-no-mugimeshi" and soils from Mt. Zao were incubated at 30 °C, while plates spread with red clay soils collected from Onikobe geothermal area were incubated at 65 °C.
After 2~4 weeks of incubation, white ~ pale orange coloured colonies which formed branched vegetative mycelia colonies by the observation under a LED light digital microscope at a magnification of 1000X (KH-8700; HiRox Co., Ltd, Tokyo, Japan). The Ktedonobacteria-like colonies were picked and serially diluted in saline solution, and the dilutions were plated on isolation plates. The single colonies were further purified three times and selected for further isolation and full characterisation.
R2A gellan gum medium
R2A broth 3.2 g
Calcium chloride 2.0 g
Sodium azide 20 ppm
Cycloheximide * 50 ppm
Gellan gum 15.0 g
MilliQ water Fill up to 1000 ml
19
* Stock solution of cycloheximide: 100 mg/ml in Ethanol, filter sterilize, store at 4 °C. 2.2.4 16S rRNA gene-based identification and phylogenetic analysis of the novel
Ktedonobacteria isolates
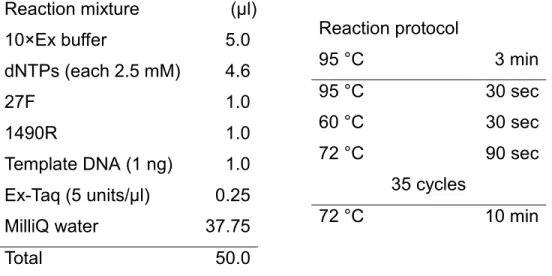
Crude genomic DNA was extracted from the purified Ktedonobacteria-like isolates by lysing the colonies with 0.05 M NaOH at 95 °C for 15 min (Yabe et al., 2017b). The near full-length 16S rRNA gene sequences of these Ktedonobacteria-like isolates were amplified by PCR using the universal primer set 27F and 1492R (Lane, 1991) with TaKaRa ExTaq DNA polymerase (Takara Bio, Kusatsu, Japan) on a Veviti 96-well Thermal Cycler (Applied Biosystems, Foster, USA). The PCR reaction mixture and protocol are given below. Quality and quantity of the PCR products (approx. 1.5 kb) were checked with 0.8% agarose gel electrophoresis and BioSpectrometer® basic (Eppendorf, Hamburg, Germany). The amplified PCR products were purified by ethanol precipitation and the near full-length 16S rRNA gene sequences were sequenced commercially by Macrogen Japan Corp., with primers 27F, 518F, 800R, 907R, 1492R (Lu et al., 2000), using an Applied Biosystems® 3730xl DNA analyzer (Thermo Fisher Scientific Inc., Waltham, USA).
The resulting near full-length 16S rRNA gene sequence were deposited in GenBank and queried with the National Center for Biotechnology Information (NCBI) Nucleotide Basic Local Alignment Search Tool (BLAST) to compare the genetic similarity. The related reference sequences were downloaded and phylogenetic tree was built using the same method aforementioned in 2.2.2.4.
Table 2.2.4-1. Universal primer set 27F and 1492R used in PCR amplification of 16S rRNA gene sequences
Primer Sequences (5'-3')
27F AGAGTTTGATCAT GGCTCGA
20
Table 2.2.4-2. Reaction mixture (left) and protocol (right) used in PCR amplification of 16S rRNA gene sequences
Table 2.2.4-3. Primers used in sequencing of the near full-length 16S rRNA gene sequences Primer Sequences (5'-3') 27F AGAGTTTGATCAT GGCTCGA 518F CCAGCAGCCGCGGTAATACG 800R TACCAGGGTATCTAATCC 907R CCGTCAATTCMTTTRAGTTT 1492R ACGGYTACCTTGTTACGACTT
2.2.5 Morphological analysis of the novel Ktedonobacteria isolates
2.2.5.1 Strain culture conditions, visual and digital microscope observation
For morphological analysis, the isolated strains of Uno3, Uno11, Uno16, Uno17, W12, A1-2, A3-2; the obtained unclassified isolates of SOSP1-1, SOSP1-9, SOSP1-30, SOSP1-52, SOSP1-85, SOSP1-142, 150039, 150040; and the related type strains of K. racemifer SOSP1-21T, Ts. hazakensis SK20-1T, Tg. onikobensis
ONI-1T, Tg. foliorum ONI-5T, Tg. carboxidivorans PM5T, Dictyobacter aurantiacus
S27T were grown on International Streptomyces Project (ISP) series medium
Reaction protocol 95 °C 3 min 95 °C 30 sec 60 °C 30 sec 72 °C 90 sec 35 cycles 72 °C 10 min Reaction mixture (µl)l) 10×Ex buffer 5.0 dNTPs (each 2.5 mM) 4.6 27F 1.0 1490R 1.0 Template DNA (1 ng) 1.0 Ex-Taq (5 units/µl) 0.25 MilliQ water 37.75 Total 50.0
21
(Shirling & Gottlieb, 1966), FS1V (Stott et al., 2008), R2A, or NBRC 231 gellan gum plates. Strains of Uno3, Uno11, Uno16, Uno17, W12, SOSP1-1, SOSP1-9, SOSP1-30, SOSP1-52, SOSP1-85, SOSP1-142, 150039, 150040, of K. racemifer SOSP1-21T, Dictyobacter aurantiacus S27T were incubated at 30 °C for six weeks.
Strains of A1-2, A3-2, Tg. onikobensis ONI-1T, Tg. foliorum ONI-5T, Tg. carboxidivorans PM5T were incubated at 60 °C for one week. Ts. hazakensis
SK20-1T was incubated at 50 °C for one weeks.
After incubation, shapes and colors of the colonies were observed by visual. Revised standard soil color charts (The Agriculture, Forestry and Fisheries Research Council (AFFRC), The Ministry of Agriculture, Forestry and Fisheries (MAFF), Japan) was used as a standard to check the colony colors. Subsequently, formation of branched mycelia and spores were checked with the LED light digital microscope (KH-8700; HiRox Co., Ltd, Tokyo, Japan) at different magnifications.
ISP1 gellan gum medium
Tryptone 5.0 g
Extract yeast dried 3.0 g
Calcium chloride 2.0 g
Gellan gum 15.0 g
MilliQ water Fill up to1000 ml
pH 6.0, adjust with 1M HCl and 1M NaOH Autoclave at 121 °C, 20 min
22
ISP3 gellan gum medium
Premium pure oats (Oatmeal) 20.0 g
Trace Salts Solution * 1.0 ml
MilliQ water Fill up to 1000 ml
pH 6.0, adjust with 1M HCl and 1M NaOH
Cook or steam for 20 min. Filter through cheese cloth. Add 15.0 g gellan gum and make up to 1000.0 ml. Autoclave at 121 °C, 20 min. Aseptically add 1 ml Trace Salts Solution.
* Trace Salts Solution
Iron (II) sulfate heptahydrate 0.1 g
Manganese (II) chloride tetrahydrate 0.1 g
Zinc sulfate heptahydrate 0.1 g
MilliQ water Fill up to 100 ml
FS1V gellan gum medium
Ammonium chloride 0.2 g
Potassium dihydrogenphosphate 0.05 g
Magnesium sulfate heptahydrate 0.2 g
Calcium chloride 0.1 g
Extract yeast dried 10.0 mg
FeEDTA Solution * 3 ml
Trace Salts Solution 1 † 3 ml
Trace Salts Solution 2 ‡ 1 ml
Murashige and Skoog Modified Vitamin Solution (1000X) 1 ml
MilliQ water Fill up to 1000 ml
pH 6.0, adjust with 1M HCl and 1M NaOH
Autoclave at 121 °C, 20 min. Aseptically add 1 ml Murashige and Skoog Modified Vitamin Solution (1000X).
23
* FeEDTA Solution
Iron (II) sulfate heptahydrate 1.54 g
Ethylenediaminetetra-acetic acid disodium salt dihydrate
2.06 g
MilliQ water Fill up to 1000 ml
† Trace Salts Solution 1
Zinc sulfate heptahydrate 0.44 g
Copper (II) sulfate pentahydrate 0.20 g Manganese (II) chloride tetrahydrate 0.19 g
Sodium molybdate dihydrate 0.06 g
Boric acid 0.10 g
Cobalt (II) chloride 0.08 g
MilliQ water Fill up to 1000 ml
‡ Trace Salts Solution 2
Nitrilotriacetic acid 1.5 g
Iron (II) ammonium sulfate 0.2 g
Sodium selenite 0.2 g
Cobalt (II) chloride 0.1 g
Manganese (II) sulfate dihydrate 0.1 g
Sodium molybdate dihydrate 0.1 g
Sodium tungstate dihydrate 0.1 g
Zinc sulfate heptahydrate 0.1 g
Aluminum chloride hexahydrate 0.04 g Nickel (II) chloride hexahydrate 0.025 g
Boric acid 0.01 g
Copper (II) sulfate pentahydrate 0.01 g
MilliQ water Fill up to 1000 ml
24
NBRC 231 gellan gum medium
Extract yeast dried 1.0 g
Beef extract 1.0 g
NZ amine typeA 2.0 g
Maltose (Monohydrate) 10.0 g
Calcium chloride 2.0 g
Gellan gum 15.0 g
MilliQ water Fill up to 1000 ml
pH 6.0, adjust with 1M HCl and 1M NaOH Autoclave at 121 °C, 20 min
2.2.5.2 Scanning electron microscopy (SEM) observation
Colonies which formed both branched mycelia and spore-like structures on the plates according to the LED light digital microscope observation were selected for the subsequent SEM observation following a previously described protocol (Yabe et al., 2010b):
1. Cut suitable gellan gum blocks containing target colonies with a scalpel, and mount on glass slides (76 mm×26 mm) respectively. It is important to cut out the blocks into different shapes to distinguish the target colonies.
2. Fix the glass slides containing target colonies in a sealed bin containing appropriate volume of 2 % osmium tetroxide (Nisshin EM Co., Ltd., Tokyo, Japan) at 4 °C overnight.
3. Take the glass slides out from the sealed bin and evaporate the remaining osmium tetroxide in a fume hood at room temperature for 15 min.
4. Freeze-dry the gellan gum blocks containing target colonies in appropriate volume of liquid nitrogen and continue to dry the samples in a rotary evaporator (FDU-1200, Tokyo Rikakikai Co.,Ltd.,Tokyo, Japan) at 14.5 Pa for 15 h.
25
5. Mount the dried samples on a carbon-tape specimen support (S-QM, Nisshin EM Co.,Ltd.,Tokyo, Japan), and cover the dried samples with gold film with a Magnetron Sputter (MSP-1S, Vaccum device Co., Ltd., Ibaraki, Japan) at 45 mA for 20 sec.
6. Observe the colonies using a field emission scanning electron microscopes (FE-SEM) (SU8000 Series; Hitachi, Ltd, Tokyo, Japan) in high-vacuum mode at 3.0 kV, 10 µA.
2.2.5.3 Culture condition of D. aurantiacus S27T for sporangia observation
Among the media of ISP1, ISP3, FS1V, R2A, and NBRC 231, the formation of sporangia by D. aurantiacus S27T was only observed on 10-fold diluted R2A gellan
gum plates, thus was used in the observation of sporangia formation. All of the incubations in this section were conducted at 30 °C for 23 days and the formation of sporangia was checked with the LED light digital microscope (KH-8700; HiRox Co., Ltd, Tokyo, Japan).
To explore the aerobic, micro-aerobic or anaerobic conditions which may promote sporangia formation, 10-fold diluted R2A gellan gum plates inoculated with D.
aurantiacus S27T were incubated in vacuum desiccators (VM, AS ONE Co., Osaka,
Japan). The desiccators were initially evacuated with a vacuum pump (V-700, BUCHI Co., Tokyo, Japan) and then filled with 0.12 MPa of various gases using a mass flow controller (MC series, Alicat Scientific Inc., Tucson, USA). The vacuum desiccators containing 10-fold diluted R2A gellan gum plates inoculated with D.
aurantiacus S27T were then incubated at 30 °C room. Sporangia formation were
frequently checked with the LED light digital microscope (KH-8700; HiRox Co., Ltd, Tokyo, Japan) at day 7, day 14, and day 23, respectively.
26
Table 2.2.5.3-1 Aerobic, micro-aerobic or anaerobic conditions tested in this study
Condition CO2 H2 N2 O2 Air 1 100% - - - - 2 - 100% - - - 3 - - 100% - - 4 20% 80% - - - 5 5-8% - - 6-10% - 6 - - - - 100%
2.2.5.4 Observation of sporangia formation by D. aurantiacus S27T
A. SEM observation
Suitable gellan gum blocks containing colonies of D. aurantiacus S27T that formed
sporangia at early stage (7 days), middle stage (14 days), and mature stage (23 days) were cut out, treated by Hanaichi UltraStructure Research Institute, Okazaki, Japan following the below protocol, and observed by our laboratory:
1. Mount the cutted gellan gum blocks on glass slides.
2. Fix the glass slides in a sealed bin containing appropriate volume of 2 % osmium tetroxide (Nisshin EM Co., Ltd., Tokyo, Japan) at 4 °C for 2 h.
3. Dehydrate with a graded series of ethanol (30% and 50% for 5 min each at 4°C; 70%, 90%, 100%, 100%, and 100% for 15 min at room temperature).
4. Freeze-dry the gellan gum blocks with appropriate volume of liquid carbon dioxide (JCPD-5; JEOL, Tokyo, Japan).
5. Cover the dried samples with gold film by plasma coating (OPC-80; Japan Laser Co., Tokyo, Japan).
6. Observe the colonies using SEM (JSM-7500F; JEOL, Tokyo, Japan) in high-vacuum mode at 5.0 kV by Hanaichi UltraStructure Research Institute, Okazaki,
27
Japan, and by our laboratory using the FE-SEM (SU8000 Series; Hitachi, Ltd, Tokyo, Japan) in high-vacuum mode at 3.0 kV, 10 µA.
B. Transmission electron microscope (TEM) observation
To observe ultrathin-sectioned sporangia with TEM, suitable 10-fold diluted R2A gellan gum blacks containing middle and mature stage-sporangia of D. aurantiacus S27T were fixed and dehydrated in the same way by Hanaichi UltraStructure
Research Institute, Okazaki, Japan as for SEM preparation. Furthermore, the dried samples were embedded in Epon812 embedding medium (Shell Chemical Co., New York, USA) and cured at 60°C for 48 h. The embedded samples were then cut by ultramicrotome into 80–90 nm slices, stained with uranyl acetate and lead citrate, and observed by TEM (JEM1200EX; JEOL, Tokyo, Japan) at an accelerating voltage of 80 kV.
C. Observation of sporangiospores with TEM and by phase-contrast microscope (PCM)
To observe sporangiospores in matured sporangia with TEM and by PCM, sporangiospores were obtained after incubation for 23 days by running a wire loop over the surface of a plate flooded with water to scratch up mature sporangia. A 100-μl drop of this suspension was placed on the slide glass (76×26 mm) and covered by a cover slip (24×32 mm). The cover slip was gently tapped and moved with a finger, and the released sporangiospores and the empty shell of the sporangium were observed microscopically. When numerous sporangiospores were released, the water containing them was harvested with a small pipette, deposited on parlodion-covered electron microscope grids, and air-dried. Shadowing was observed under a phase-contrast microscope, and the sample was negatively stained with 1% phosphotungstic acid and observed under a JEOL JEM2000EX electron microscope at an accelerating voltage of 100 kV.
28
2.2.5.5 NCBI Protein-Protein Blast of bld and whi regulatory genes in the genome of D. aurantiacus S27T
Several regulatory genes, which are involved in the morphological differentiation of Actinoplanes missouriensis, are downloaded from NCBI and summarized in Table 2.2.5.5-1. We blasted amino acid sequences of these regulatory genes with the genome of D. aurantiacus S27T, using the NCBI Protein-Protein Blast program (https://blast.ncbi.nlm.nih.gov/Blast.cgi).
Table 2.2.5.5-1 Regulatory genes involved in the morphological differentiation of
Actinoplanes missouriensis
Genes aa NCBI Accession
bldB 91 WP_014134765.1 bldC 68 WP_014137253.1 bldD 167 WP_014134541.1 bldG 113 WP_014136695.1 bldH 625 BAJ28505.1 bldM 203 WP_014136228.1 amfC 172 BAJ30157.1 whiA 326 WP_014138611.1 whiB 90 WP_014136066.1 whiD 108 WP_014136229.1 whiG 276 WP_014138327.1 whiH 290 WP_014138477.1 whiI 246 WP_014138581.1 sigF 301 BAJ29532.1 sigN 296 WP_014136839.1 crgA 84 WP_014137035.1
2.2.6 Physiological analysis of the novel Ktedonobacteria isolates 2.2.6.1 Temperature range and optimum for growth
To determine temperature range and optimum for growth, the isolated strains of Uno3, Uno11, Uno16, Uno17, W12, A1-2, A3-2; the obtained unclassified isolates of SOSP1-1, SOSP1-9, SOSP1-30, SOSP1-52, SOSP1-85, SOSP1-142, 150039, 150040; and the related type strains of K. racemifer SOSP1-21T, Ts. hazakensis
29
Dictyobacter aurantiacus S27T were grown on 10-fold diluted R2A gellan gum
plates (at pH 6.0).
Strains of Uno3, Uno11, Uno16, Uno17, W12, SOSP1-1, SOSP1-9, SOSP1-30,
SOSP1-52, SOSP1-85, SOSP1-142, 150039, 150040, K. racemifer SOSP1-21T,
and Dictyobacter aurantiacus S27T were incubated at the temperatures of 4 °C,
11 °C, 15 °C, 20 °C, 30 °C, 37 °C, 45 °C for one month. Strains of A1-2, A3-2, Tg.
onikobensis ONI-1T, Tg. foliorum ONI-5T, Tg. carboxidivorans PM5T were
incubated at the temperatures of 30~80 °C for one week. The growth of these strains on plates were determined by visual.
2.2.6.2 pH range and optimum for growth
For pH range and optimum analysis, the above strains were grown on 10-fold diluted R2A gellan gum plates at different pH values (from 3.0 to 12.0 at one pH unit intervals) using three buffer systems: pH 3.0~6.0, 0.1 M acetic acid/0.1 M sodium acetate; pH 7.0~9.0, 0.1 M di-sodium hydrogenphosphate 12-Water (Na2HPO4•12H2O)/0.1 M hydrochloric acid (HCl); and pH 10.0~12.0, 0.1 M sodium
hydrogen carbonate (NaHCO3)/0.1 M sodium hydroxide (NaOH).
Strains of Uno3, Uno11, Uno16, Uno17, W12, SOSP1-1, SOSP1-9, SOSP1-30,
SOSP1-52, SOSP1-85, SOSP1-142, 150039, 150040, K. racemifer SOSP1-21T,
and Dictyobacter aurantiacus S27T were incubated at 30 °C for one month. Strains
of A1-2, A3-2, Tg. onikobensis ONI-1T, Tg. foliorum ONI-5T, Tg. carboxidivorans
PM5T were incubated at 60 °C for one week. The growth of these strains on plates
were determined by visual.
2.2.6.3 Sodium Chloride (NaCl) tolerance
For NaCl tolerance and the below physiological assays from section 2.2.6.4 to section 2.2.6.8, strains of Uno3, Uno11, Uno16, Uno17, W12, 1, SOSP1-9, SOSP1-30, SOSP1-52, SOSP1-85, SOSP1-142, 15003SOSP1-9, 150040, K. racemifer SOSP1-21T, and Dictyobacter aurantiacus S27T were grown on 10-fold diluted
R2A gellan gum plates or liquid medium at 30 °C, pH 6.0 for one month. Strains of A1-2, A3-2, Tg. onikobensis ONI-1T, Tg. foliorum ONI-5T, Tg. carboxidivorans
30
PM5T were grown on 10-fold diluted R2A gellan gum plates or liquid medium at
60 °C, pH 6.0 for one week.
NaCl tolerance of these strains were tested in the presence of various concentrations of NaCl (0~4 % at 1 % intervals) in the liquid medium. The growth of these strains were determined by visual.
2.2.6.4 Anaerobic growth assay
Anaerobic growth assay of these strains were conducted on 10-fold diluted R2A gellan gum plates in an anaerobic jar (AnaeroPack-Anaero, Mitsubishi Gas Chemical Co., Inc., Tokyo, Japan). The growth of these strains were determined by visual.
2.2.6.5 Gram-stain assay
Gram staining of the strains were performed following a modified Hucker method (Smibert & Krieg, 1994) using the BD Gram Stain Kits and Reagents (Becton, Dickinson and Company, Sparks, USA):
1. Add 10 µl of MiliQ water to the colony on the plate and transfer the suspended culture to a slide glass and air dry.
2. Fix the microbial smear by heating carefully with a gas burner 2~3 times. 3. Cover the preparation with Violet Cristal Oxalate Gram-Hucker solution for 1 minute. Wash excess dye gently with running water.
4. Cover the preparation with Stabilized Gram Iodine solution for 1 min. 5. Rinse again with running water.
6. Rinse with Gram Decolorizer solution for 20~30 sec. 7. Rinse again with running water.
8. Cover the preparation with Gram Safranin solution according to Gram-Hucker for 1 min.
31
10. Observe the cell color with optical microscope (Blue violet, Gram-positive; Red-pinkish, Gram-negative).
2.2.6.6 Catalase activity assay
Catalase activity was verified by adding 3 % hydrogen peroxide (H2O2) solution to
the colonies on the plate and observing bubble production by visual. Bubble production, catalase activity positive; non-production, catalase activity negative. 2.2.6.7 Gelatin liquefaction assay
Gelatin liquefaction was tested in 10-fold-diluted R2A broth medium supplemented with 10 % (w/v) gelatin (Kanto Chemical Co., Inc., Tokyo, Japan). After cultivation at 30 or 60 °C, the culture tubes were incubated at 4 °C for 1 h. Liquefaction of gelatin or not was checked by visual.
2.2.6.8 Hydrolysis activity assay
Hydrolysis of skim milk (Nacalai Tesque, Inc., Kyoto, Japan), microcrystalline cellulose (Avicel) (Alfa Aesar, Haverhill, USA), carboxymethyl cellulose (CMC) (Alfa Aesar, Haverhill, USA), starch (Wako Pure Chemical Industries, Ltd., Osaka, Japan), chitin (Kanto Chemical Co., Inc., Tokyo, Japan), and xylan (Tokyo Chemical Industry Co., Ltd., Tokyo, Japan) were tested by adding 0.5 % (w/v) of each substrate to 10-fold diluted R2A gellan gum plates. The presence of a clear zone around a colony indicated hydrolysis of these substrates.
The plate of skim milk was checked by visual. The plate of starch was covered with Lugol's iodine solution (Iodine 1 g, Potassium Iodide 2 g, MilliQ water 300 ml) and washed with running water. The plates of Avicel, CMC, chitin and xylan were layered with pre-heated 0.6% agarose and then cooled to room temperature. The double-layer plates were stained with 0.1% Congo Red solution for 30 min and then washed with 1 M sodium chloride solution to visualize potential halos. 2.2.6.9 Utilization of sole carbon sources
For utilization of sole carbon sources, the strains were grown on 10-fold diluted R2A agar plates supplemented with 0.5 % (w/v) final concentrations of each D-fructose, D-glucose, D-mannitol, D-xylose, myo-inositol, L-arabinose, L-rhamnose,
32
and sucrose. All of the sugars are bought from Kanto Chemical Co., Inc., Tokyo, Japan.
The 10-fold diluted R2A agar medium was autoclaved at 121 °C, 20 min, and then aseptically added each 10 ml of each stock sugar solutions to make the final concentration of 0.5 %. The stock sugar solutions were pre-prepared by filter (Toyo Roshi Kaisha, Ltd.,Tokyo, Japan) sterilize and stored at 4 °C.
2.2.7 Chemotaxonomic analysis of the novel Ktedonobacteria isolates
For chemotaxonomic analysis in this section, strains of Uno3, Uno11, Uno16, Uno17, W12, 1, 9, 30, 52, 85, SOSP1-142, 150039, 150040, K. racemifer SOSP1-21T, D. aurantiacus S27T were grown
in R2A broth medium at 30 °C, shaking at 100 rpm for 28~45 days. Strains of A1-2, A3-A1-2, Tg. onikobensis ONI-1T, Tg. foliorum ONI-5T, Tg. carboxidivorans PM5T
were grown in R2A broth medium at 60 °C, shaking at 100 rpm for 5 days. Cell pellets of these strains were collected by centrifuge at 4 °C, 12,100 rpm, 10 mins. 2.2.7.1 Analysis of cellular fatty acid composition
Cellular fatty acid composition was methylated and extracted using minor modifications of the method of (Sasser, 1990) and identified using the Sherlock Microbial Identification System (v 6.0; MIDI) and the TSBA6 database:
1. Put 100 mg of wet cell pellets in a screw cap glass test tube and add 1.0 ml of Saponification solvent to the test tube.
2. Close the cap and heat at 100 °C for 5 min in a heat block (HDB-1N, AS ONE Co., Osaka, Japan).
3. Shake vigorously for 5~10 sec and continue to heat at 100 °C for 60 min. 4. Cooled down the samples rapidly in ice water.
5. Add 2.0 ml of Methylation solvent to the test tube and heat at 80 ± 1 °C for 10 min.
33
7. Add 1.25 ml of Extraction solvent to the test tube and vortex for 10 min. 8. Pipette out and discard the aqueous (lower) phase.
9. Add 3.0 ml of Wash solvent the organic phase remaining in the tubes and tumble on a sliding rotor (BC-740, Bio Craft,Tokyo, Japan) for 5 min.
10. Pipette the organic (upper) phase into an Eppendorf tube and centrifuge at 15,000 rpm for 5 min.
11. Pipette the supernatant to a new Eppendorf tube and store at -20 °C until use. 12. Cellular fatty acid composition was identified using the Sherlock Microbial Identification System (v 6.0; MIDI) and the TSBA6 database by Techno Suruga Laboratory Co., Ltd., Shizuoka, Japan.
Saponification solvent Sodium hydroxide 15.0 g
Methanol 50 ml
MilliQ water Fill up to 100 ml
Extraction solvent
Hexane 50 ml
Methyl tert-butyl ether (MTBE) 50 ml
2.2.7.2 Analysis of polar lipid composition
Polar lipids were extracted and separated by two-dimensional thin layer chromatography (TLC) according to the method of (Tindall, 1990a; Tindall, 1990b), and visualized by spraying with appropriate detection reagents (Tindall et al., 2007): A. Polar lipid extraction
Methylation solvent
6M Hydrochloric acid 130 ml
Methanol 110 ml
Wash solvent
Sodium hydroxide 1.2 g
34
1. Put 100 mg of dried cell pellets into a screw cap glass test tube and add 6.75 ml of chloroform:methanol:0.3% aqueous NaCl (5:10:4, v/v/v) solvent to the test tube. Tumble gently at room temperature overnight.
2. Centrifuge at 4,000 rpm for 5 min.
3. Transfer the supernatant to a new test tube and add 1.75 ml of chloroform and 1.75 ml of 0.3% NaCl solution to the test tube. Tumble gently at room temperature for 1 h.
4. Centrifuge at 4,000 rpm for 5 min.
5. Pipette the organic (lower) phase into a new test tube with Pasteur pipette. 6. Dry the extracted polar lipids with nitrogen gas flow for 10~20 min.
7. Dissolve the dried sample in 200 μl of chloroform:methanol (2:1, v/v) solvent. Store at -20 °C until use.
B. TLC separation
1. Cut the Silica gel 60 TLC glass plate (10x20 cm, Merck KGaA, Darmstadt, Germany) into square plate (10x10 cm) with a diamond cutter.
2. Use a pencil to gently draw a straight line across the plate approximately 1 cm from the bottom.
3. Spot 10 μl of the extracted polar lipid sample at the across where the two pencil lines are overlapped. Dry the spot with a dryer. Prepare and spot five TLC plates for each sample.
4. Equilibrate the developing chamber with 100 ml of the 1st-dimensional developing solvent (chloroform:methanol:MiliQ water (65:25:4, v/v/v)) for approx. 30 min.
5. Place the plate into the chamber as evenly as possible and lean it against the side. Allow the plate to develop until the solvent rise up to the top of the plate (approx. 25~30 min).