Study on Hydrophilic Structure of
Anion Conductive Aromatic Ionomer Membranes
A Doctoral Thesis
Presented to
Interdisciplinary Graduate School of
Medicine and Engineer
University of Yamanashi
March 2015
Naoki Yokota
Contents
Chapter 1 Introduction
1.1 Ionic Conductive Ionomers ··· 1
1.2.1 Ionic Materials and Ionomers ··· 1
1.2.2 Mechanism of Ionic Conduction ··· 1
1.2.3 Self-Assembly of Ionic Materials and Ionomers ··· 5
1.2.4 Applications of Ion Conductive Materials ··· 6
1.2 Anion Conductive Ionomer Membranes ··· 7
1.2.1 Anion Conductive Polystylene-based Ionomers ··· 7
1.2.2 Anion Conductive Aliphatic Ionomers ··· 9
1.2.3 Anion Conductive Aromatic Ionomers ··· 10
1.2.4 Degradation Mechanisms of Anion Conductive Ionomers ··· 13
1.2.5 Recent Progress on Stable Onium Groups ··· 16
1.3 Purpose of the Study ··· 18
References ··· 19
Chapter 2 Anion Conductive Aromatic Ionomer Membranes Containing Diphenyl Ether or Sulfide Groups 2.1 Introduction ··· 25
2.2 Experimental Section··· 25
2.3 Results and Discussion ··· 31
2.3.1 Synthesis and Characterization ··· 31
2.3.2 Morphology ··· 41
2.3.3 Water Uptake and Hydroxide Ion Conductivity ··· 41
2.3.4 Alkaline Stability Test ··· 45
2.3.5 Hydrogen and Oxygen Permeability ··· 49
2.3.6 Hydrazine Permeability ··· 49
2.3.8 Fuel Cell Performance ··· 52
2.4 Conclusion ··· 55
References ··· 55
Chapter 3 Anion Conductive Aromatic Ionomer Membranes Containing Polyphenylene Moiety 3.1 Introduction ··· 56
3.2 Experimental Section··· 56
3.3 Results and Discussion ··· 60
3.3.1 Synthesis of Model Oligomers ··· 60
3.3.2 Synthesis and Characterization ··· 61
3.3.3 Morphology ··· 68
3.3.4 Water Uptake and Hydroxide Ion Conductivity ··· 68
3.3.5 Alkaline Stability Test ··· 76
3.3.6 Mechanical Property ··· 76
3.3.7 Fuel Cell Performance ··· 81
3.4 Conclusion ··· 81
References ··· 81
Chapter 4 Conclusion 4.1 Current Status of the Ionomer Membranes of This Study ··· 84
4.2 Future Prospect ··· 88 References ··· 89 List of Publications ··· 90 Meeting Abstracts ··· 91 List of Patents ··· 93 Acknowledgements ··· 94
-1-
Chapter 1
Introduction
1.1 Ionic Conductive Ionomers 1.1.1 Ionic Materials and Ionomers
Ion is defined as an atomic or molecular particle having a net electric charge.1 Anion
and cation are held together by Coulomb force in the solid state, and soluble ions dissociate by solvation in polar solvent such as water. Most ionic materials have high melting point due to strong Coulomb force (e.g. the melting point of sodium chloride is 801 °C), whereas some ionic materials exhibit low melting point, which are named ionic liquids (e.g. the melting point of 1-methylimidazolium tetrafluoro-borate is 36-37 °C).2
Polymers containing ionic groups are called ionomers, which have unique properties combining polymers with electrolyte.3 There are many ionomers such as hyaluronic acid,
chondroitin sulfate, and deoxyribonucleic acid in nature, and the mimetics such as hydrogel,4 superabsorbent polymers,5 and artificial helical polymers.6 Mechanically and
thermally stable ionomers, such as sulfonated polystyrene, quaternized polystyrene, amphoteric polystyrene,7 poly(perfluorosulfonic acid) (Nafion),8 partially fluorinated
poly(styrenesulfonic acid) (BAM membrane),9 poly(pyridinium phenylene),10
polyviologen,11 sulfonated poly(p-phenylene) (JSR membrane),12,13 and sulfonated
poly(arylene ketone)14 have been developed (Figure 1-1).
1.1.2 Mechanism of Ionic Conduction
The conductivity (σ (S cm-1)) is defined as the equation:
σ
where N (cm-3) is the density of charge carrier, Q (C) is the electric charge per a charge
carrier, u (cm2 V-1 s-1) is mobility of charge carrier, and i is the kind of charge carrier.15,16
The electron conductivity in solid metals (Pt, Cu, etc.) is on the order of 105-106 S cm-1,
whereas the ion conductivity in electrolyte aqueous solutions (e.g., 1 M NaCl) is ca. 10-2-10-1 S cm-1 despite the similar level of carrier density (solid metals: 1022-1023
-2-
………..
Figure 1-1. Chemical structures of (a) sulfonated polystyrene, (b) quaternized poly- styrenes, (c) amphoteric polystyrenes, (d) poly(perfluorosulfonic acid), (e) partially fluorinated poly(styrenesulfonic acid), (f) poly(pyridinium phenylene), (g) polyviologen, (h) sulfonated poly(p-phenylene), and (i) sulfonated poly(arylene ketone).
(e) (h) (i) (a) (d) (g) (f) (c) (b)
-3-
cm-3; 1M NaCl: 1021 cm-3). This is because the mobility of ions is significantly lower than
that of electron. The mass and radius of electron are 5.5 × 10⁻⁴ g mol-1 and almost zero,
whereas the mass and radius of ions are 100-102 g mol-1 and 10-10-10-9 m.17,18 In addition,
electron conduction is quantum-mechanical phenomenon, whereas ion conduction is phenomenon accompanied by mass transfer.19,20
The conductivity of ion solution (σ (S cm-1)) is calculated from the equation:
σ
where F is Faraday constant, z is the absolute value of valence of ion, c (mol cm-3) is the
concentration of ion, u (cm2 V-1 s-1) is ion mobility, and i is the kind of ion.
Limiting ionic mobilities (25 °C) is shown in Table 1-1. The mobilities of proton and hydroxide ions are much higher than those of other ions. It indicates that proton and hydroxide ion transferred by not only vehicle mechanism (Figure 1-2) but also Grotthuss mechanism (Figure 1-3).22,23
Table 1-1. Limiting ionic mobilities (25 °C)21
cation /10-4 cm2 V-1 s-1 anion /10-4 cm2 V-1 s-1 H+ 36.4 OH- 20.5 K+ 7.62 SO 42- 8.29 NH4+ 7.62 Br- 8.10 Ca2+ 6.17 I- 7.96 Mg2+ 5.50 Cl- 7.91 Na+ 5.19 NO 3- 7.41 (CH3)4N+ 4.66 ClO4- 6.98 Li+ 4.01 F- 5.74 (C2H5)4N+ 3.38 CH3COO- 4.24
In ionomer membranes, ionic groups interact with water, resulting in hydration and dissociation of counter ions. The dissociated counter ions have the ability to migrate through hydrated ionomer membrane. The charge carriers in solution are both anion and
-4-
…..
Figure 1-2. Schematic illustration of (a) hydronium and (b) hydroxide ion transfer by vehicle mechanism.
Figure 1-3. Schematic illustration of (a) hydronium and (b) hydroxide ion transfer via Grotthuss mechanism.
(a) (b)
-5-
cation, whereas that in hydrated ionomer membrane is not the ionic groups attached to the polymer chains but the dissociated counter ions, which account for the transport number as unity.
1.1.3 Self-Assembly of Ion Conductive Materials and Ionomers
Some molecules spontaneously form ordered structure, such as micelle, column, lamellae, and gyroid, by intermolecular forces.24,25 This self-assembly could often be
utilized to prepare functional nanomaterials. In ionic materials and ionomers, self-assembly has the potential for bicontinuous ion transport.
Attempts to combine ionic liquids with liquid crystals were reported. The nanostructured materials composed of complex of zwitterionic molecule and benzenesulfonic acid achieved high anhydrous proton conductivity of 10-4 S cm-1.26
Structure and properties of aggregated ionic groups in ionomers have been studied since early times.27 Nafion, a typical poly(perfluorosulfonic acid) ionomer, exhibits
hydrophilic/ hydrophobic phase separated morphology with bicontinuous water domains.28 It is derived from the unique polymer structure composed of hydrophobic
perfluoroalkyl main chain and pendant side chain tethered with highly acidic perfluorosulfonic acid (or super acid) groups. It is recognized that the well-developed phase separation provides interconnected ionic channels and thus enhances ion conductivity. Gierke et al proposed cluster network model composed of reverse micelles formed by ionomers and absorbed water molecules (clusters) connected with narrower ionic channels.29,30 In this model, realignment of ionic groups in response to change in
water content is proposed. Gebel proposed structure inversion model based on small angle X-ray and neutron scattering analyses. There are isolated spherical ionic clusters with a diameter close to 1.5 nm, and an inter-cluster distance is close to 2.7 nm in dry membrane. The cluster size increases with increasing water content, and the clusters percolate over water content of 20%. Increasing water content between 30% and 50%, hydration causes expansion of channel and increase in proton conductivity. At water content more than 50%, structure inversion takes place and polymer main chains aggregate surrounded by water.31 Other aggregation models are also suggested in the literature, such as bimodal
-6-
network model,32 sandwich-like model,33 percolation network model,34 parallel long
channel model.35
The block copolymers composed of incompatible block components often exhibit microphase separation.36 The phase-separated morphology of the block copolymer
membranes may be controllable by modulating chemical structure, copolymer composition, chain length, or film-forming conditions. Sulfonated multiblock copoly(p-phenylene) and poly(arylene ketone) membranes exhibited bicontinuous gyroid-type hydrophilic/ hydrophobic morphology, and high ion conductivity.12-14
1.1.4 Applications of Ion Conductive Materials
Ion conductive materials have a variety of applications in electrochemical devices such as water treatment,37 electrodialysis,38 reverse electrodialysis,39,40 recovery of usable
metal41, dopant of electron conductive polymer42, actuators,43 metal-air batteries,44 redox
flow batteries,45,46 electrolysis,47,48 and fuel cells.49-51
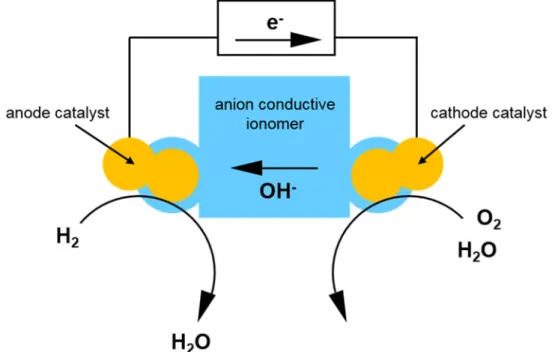
Fuel cells are regarded as highly efficient energy devices due to their direct conversion of chemical energy to electricity. Among several types of fuel cells, polymer electrolyte fuel cells using proton conductive ionomers are operable at moderate temperatures and are thus suitable for applications in cogeneration system, portable devices, and electric vehicles. However, the use of strongly acidic proton conductive ionomers requires expensive, exhaustible precious metals (Pt) as electrocatalysts. A potential breakthrough is the use of anion conductive ionomers. Replacing proton conductive ionomers with anion conductive ionomers enables the use of abundant transition metals (Ni, Co, Fe, etc.) as electrocatalysts.52-54 Moreover, it is well-known that the kinetics of the oxygen reduction
reaction are more favorable under alkaline conditions. The schematic illustration of principle of alkaline fuel cells using hydrogen as fuel is shown in Figure 1-4. At the anode, the reaction of hydrogen and hydroxide ions produces water and electrons. From the anode, the electrons travel to the cathode through the external circuit. At the cathode, the reaction of oxygen, water and electrons produces hydroxide ions, and the hydroxide ions travel to the anode through the electrolyte membrane. The desired properties of anion conductive ionomers as electrolyte membrane include (1) chemical and electrochemical
-7-
stability, (2) high anion conductivity at wide range of temperature and humidity, (3) low electron conductivity, (4) low permeability of fuel and oxidant, (5) excellent mechanical properties, (6) balanced water transport, (7) compatibility with electrocatalysts, and (8) low cost. The electrochemical reactions in alkaline fuel cells are summarized in Table 1-2.
Figure 1-4. The schematic illustration of principle of alkaline fuel cells.
Table 1-2. Electrochemical Reactions in Alkaline Fuel Cells54
Fuel Anode reactions
(Fuel oxidation)
Cathode reactions (Oxygen reduction) Hydrogen 2H2 + 4OH- → 4H2O + 4e- O2 + 2H2O + 4e- → 4OH
-Hydrazine N2H4 + 4OH- → 4H2O + N2 + 4e- O2 + 2H2O + 4e- → 4OH
-Methanol CH3OH + 6OH- → CO2 + 5H2O + 6e- 3/2O2 + 3H2O + 6e- → 6OH
-1.2 Anion Conductive Ionomer Membranes
1.2.1 Anion Conductive Polystyrene-based Ionomers
Typical method to preparate anion conductive ionomers is chloromethylation of aromatic-containing polymers, followed by quaternization with amines and ion exchange reactions.55-58 As the most classic anion exchange resin, the synthetic route of quaternized
-8-
Figure 1-5. Synthetic route of quaternized polystyrene.
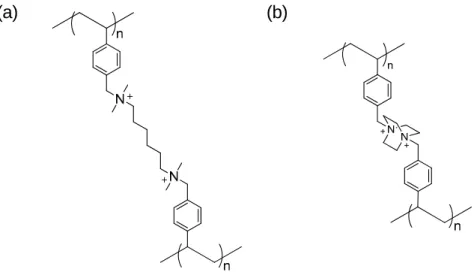
Because of high ammonium density (or ion exchange capacity) and rather flexible polymer main chain, it shows high solubility in polar organic solvents and water. For industrial applications, cross-linked polystyrenes with divinylbenzene as a comonomer, such as Amberlite and Diaion, are widely used (Figure 1-6). Quaternaization of benzyl chloride with diamine59,60 or 4,4’-diazabicycle-[2,2,2]-octane (DABCO)61 is also carried
out to provide cross-linked structure (Figure 1-7).
Figure 1-6. Chemical structure of cross-linked quaternized polystyrene.
Figure 1-7. Chemical structures of quaternized polystyrene cross-linked with (a) diamine, and (b) DABCO.
-9-
Diblock copolystyrenes composed of quaternized hydrophilic block and cross-linkable hydrophobic block were cross-linked by ring opening metathesis polymerization (ROMP), which achieved high hydroxide ion conductivity of 98 mS cm-1 at room temperature
(Figure 1-8).62
Figure 1-8. Chemical structure of diblock copolystylenes crosslinked by ROMP.
1.2.2 Anion Conductive Aliphatic Ionomers
Qutaernized aliphatic ionomers are synthesized by direct polymerization of cationic monomers. Cyclic ammonium-based ionomers were synthesized from diallyldimethyl- ammonium (Figure 1-9).63 Coates et al. reported ROMP routes to anion conductive
aliphatic ionomers (Figure 1-10).64-66 Cross-linked qutaernized aliphatic ionomers (Figure
1-10c, IEC = 2.3 mequiv g-1) achieved high hydroxide ion conductivity of 111 mS cm-1
(50 °C, in water).
Figure 1-9. Chemical structure of poly(diallyl dimethyl ammonium).
Figure 1-10. Chemical structures of anion conductive aliphatic ionomers polymerized by ROMP.
(c)
(b) (a)
-10- 1.2.3 Anion Conductive Aromatic Ionomers
Anion conductive aromatic ionmoers are often prepared by introduction of cationic groups into engineering plastics such as poly(arylene ether sulfone)s and poly(arylene ether)s. Similar to the above mentioned polystyrene-based quaternized ionomers, quaternized poly(ether sulfone)s can be synthesized via chloromethylation of aromatic rings, followed by quaternization, and ion exchange reactions (Figure 1-11).67,68
Quaternized poly(ether sulfone) obtained from 4,4’-biphenol and 4,4’-dihalodiphenyl- sulfone (Figure 1-11a, IEC = 2.5 mequiv g-1) achieved hydroxide ion conductivity of 35
mS cm-1 at 30 °C in water.67 An H
2/O2 fuel cell was operated with quaternized poly(ether
sulfone) obtained from bisphenol A and 4,4’-dihalodiphenyl- sulfone (Figure 1-12b, IEC = 1.1 mequiv g-1) as the membrane and electrode binder, achieving high maximum power
density of 120 mW cm-2 at a current density of 230 mA cm-2.69
Figure 1-11. Chemical structure of quaternized poly(ether sulfone)s.
Alternative is bromonation of methyl groups and the following quaternization as is the case for quaternized poly(2,6-dimethyl-1,4-phenylene ether) (Figure 1-12). The copolymer membranes (IEC = 2.7 mequiv g-1) showed high hydroxide ion conductivity of
24 mS cm-1 at room temperature in water.70
Figure 1-12. Synthesis of quaternized poly(phenylene ether).
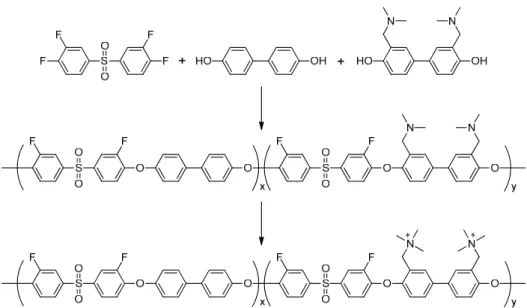
Another route to anion conductive aromatic ionmoers is polymerization of precursors containing tertiary amine groups. In this method, number and position of ionic groups are controllable (Figure 1-13).71 (b) (a) S O O O O N N n
-11-
Figure 1-13. Synthesis of anion conductive aromatic ionomer from precursor containing tertiary amine groups.
Similar to proton conductive ionomer membranes composed of aromatic block copolymers that exhibit high proton conductivity due to their well-developed hydrophilic/hydrophobic phase-separated morphology, quaternized multiblock copolymers are claimed to exhibit high hydroxide ion conductivity. 72,73 Some of them are
shown in Figure 1-14 as representative examples.74-78 Poly(arylene ether) containing
fluolenyl groups as scaffold for quaternized ammonium groups (Figure 1-14b, IEC = 1.9 mequiv g-1) achieved high hydroxide ion conductivity up to 144 mS cm-1 at 80 °C in
water.76 A noble metal-free direct hydrazine fuel cell was operated with the polymer as the
membrane (IEC = 1.1 mequiv g-1), achieving a maximum power density of 297 mW cm-2
at a current density of 826 mA cm-2. Beckham et al. reported multiblock copoly(arylene
ether sulfone)s, of which properties were compared with those of the corresponding random copopymers (Figure 1-14d).78 The block copolymer (16 mS cm-1 at 25 °C in water,
25%) showed higher hydroxide ion conductivity and water uptake than those of the random copolymer (5.7 mS cm-1 at 25 °C in water, 16%) with the same IEC (1.4 mequiv
g-1). In addition, the multiblock copolymer exhibits significantly shorter spin-spin
relaxation time (20.2 ms) than that of the random copolymer (50.2 ms), indicating efficient water transport of multiblock copolymer.
-12-
Figure 1-14. Chemical structure of quaternized multiblock copolymers.
Hibbs et al. reported anion conductive ionmoers based on polyphenylene, via Diels-Alder polymerization, follow by bromonation of methyl groups, and quaternization (Figure 1-15).79 The quarternozed polyphenylene (IEC = 2.5 mequiv g-1) showed
hydroxide ion conductivity of 50 mS cm-1 at 30 °C in water). Since this structure contains
none of alkyl chains and hetero linkages such as ether, sulfone, or ketone groups, the backbone exhibited excellent stability.
Figure 1-15. Chemical structure of quaternized polyphenylene. (a)
(c) (b)
-13-
1.2.4 Degradation Mechanisms of Anion Conductive Ionomers
In addition to the ion conductivity, stability is another critical issue for anion conductive ionomers especially under alkaline conditions. In this section, possible degradation mechanisms for anion conductive ionomers are discussed.
Hydroxide ion often attacks methylene protons β-position to trimethylammonium groups, resulting in the production of alkenyl group, trimethylamine and water (Figure 1-16a). The degradation is called Hofmann elimination.80 Boncella et al. made a
systematic study on Hofmann elimination using model compounds.81 Replacing
β-position hydrogen with methyl groups suppresses Hoffman elimination.
Quaternary ammonium groups without β-position hydrogen experience different degradations. The degradation of benzyl(trimethyl)azanium by nucleophilic substitution (SN2) provides benzyl alcohol and trimethylamine (Figure 1-16b), or N,N-dimethyl-1-
phenylmethanamine and methanol (Figure 1-16c).81-84 Additionally, decomposition of
benzyl(trimethyl)azanium via Sommelet-Hauser rearrangement to form N,N-dimethyl(2- methylphenyl) methanamine and water (Figure 1-16d), and via Stevens rearrangement to form N,N-dimethyl- 1-phenylethanamine and water (Figure 1-16e), or N,N-dimethyl-2- phenylethanamine and water (Figure 1-16f)). Ramani et al. reported that degradation of benzyl(trimethyl)phosphonium occurs by the same mechanism as benzyl(trimethyl) azanium.85
Anion conductive ionomers could degrade on the polymer main chains under certain conditions. Kim et al.86,87 and Ramani et al.88 reported independently that ether linkages or
isopropylidene groups adjacent to phenylene rings with electron-withdrawing groups were attacked by hydroxide ions, and cleaved (Figure 1-17).
-14-
Figure 1-16. Possible degradation mechanisms of quaternized ammonium groups. (a) Hofmann elimination, (b, c) nucleophilic substitution, (d) Sommelet-Hauser rearrangement, and (e, f) Stevens rearrangement.
+ + + + + + + electron-withdrawinggroup β-position proton (a) (b) (c) (d) (e) (f) electron-withdrawinggroup
-15-
Figure 1-17. Possible degradation mechanisms of polymer main chains. (a) cleavage of isopropylidene group, and (b, c) cleavage of ether bond.
electron-withdrawing group electron-withdrawing group electron-withdrawing group (a) (b) (c) C CH3 CH3 N OH H2O OH N HO OH S OH O O HO OH
-16- 1.2.5 Recent Progress on Stable Onium Groups
In recent years, there has been a significant advancement on the stable onium groups and derived polymers. Hickner and Li et al. proposed that comb-shaped poly(phenylene ether) containing long alkyl side chains pendant to the nitrogen-centered cationic group are highly stable in alkaline solution (Figure 1-18).70,89 The anion conductivity of the
polymers is higher than that of poly(phenylene ether) containing trimethylammonium (Figure 1-12). The polymers remained 80% of their initial anion conductivity in 1 M NaOH at 80 °C for 2000 h.
Figure 1-18. Chemical structure of poly(phenylene ether) containing long alkyl side chains pendant to the nitrogen-centered cationic group.
Yan et al. synthesized poly(ether sulfone) containing tris(2,4,6-trimethoxyphenyl) phosphonium as ionic groups (Figure 1-19).90,91 2,4,6-Trimethoxyphenyl groups as strong
electron donors and sterically bulky substituents are likely to protect the phosphonium ions and the α-carbon atom against hydroxide attack. The polymer showed higher anion conductivity (IEC = 1.09 equiv g-1, 27 mS cm-1 at 20 °C in water) than poly(ether sulfone)
containing trimethylammonium (Figure 1-11b, IEC = 1.07 equiv g-1, 11 mS cm-1 at 30 °C
in water).92 The polymer remained initial anion conductivity in 1 M KOH at 60 °C for 30
days. Coates et al. prepared aliphatic polymers containing tetrakis(dialkylamino) phosphonium groups (Figure 1-20).93 The polymers retained initial anion conductivity in 1
M KOH at 80 °C for 22 days. The charge delocalization due to adjacent phosphorus ion and nitrogenous lone electron pair probably improve the stability.
-17-
Figure 1-19. Chemical structure of poly(ether sulfone) containing tris(2,4,6-trimethoxy- phenyl)phosphonium groups.
Figure 1-20. Chemical structure of polyethylene containing tetrakis(dialkylamino) phosphonium groups.
Holdcroft et al. reported unique ionomers based on sterically hindered polybenzimidazolium ions possessed high hydroxide ion conductivity and stability (Figure 1-21).94,95 This polymer was stable in strong alkaline solution (2 M KOH) at
60 °C.
Figure 1-21. Chemical structure of polybenzimidazolium.
Hickner and Taw et al. synthesized poly(norbornene)s containing bis(terpyridine) ruthenium(II) complexes as ionic groups (Figure 1-22).96 Only minor changes in the
spectra of the complexes were observed in 1 M NaOH at 80 °C for 48 h. The nitrogenous coordinate bonds are likely to improve the stability of ruthenium ion (eighteen electron
(b) (a) O n P O S O O O O O O O O O O O
-18-
rule). The hydroxide ion conductivity of the polymers (IEC = 1.4 equiv g-1, 29 mS cm-1 at
30 °C in water) are higher than that of poly(norbornene)s containing trimethylammonium (Figure 1-10a, IEC = 1.4 equiv g-1, 18 mS cm-1 at 20 °C in water)64 probably due to
divalent ionic groups.
Figure 1-22. Chemical structure of Metal-cation-based anion conductive ionomer.
1.3 Purpose of the Study
As described above, there have been a number of attempts to develop highly anion conductive and chemically stable ionomer membranes in the last decade. However, no membrane materials meet the criteria for fuel cell applications. In this study, I focused on aromatic block copolymers and investigated the effect of hydrophilic structure containing ammonium groups on their structure, morphology, and properties.
In chapter 2, synthesis and properties of a novel series of aromatic block copolymers composed of diphenyl ether or diphenyl sulfide groups as scaffold for quaternized ammonium groups, and fluorinated phenylene and biphenylene groups are described. The block copolymers were synthesized via aromatic nucleophilic substitution polycondensation, chloromethylation, quaternization, and ion exchange reactions. The strong electron-donating properties of chalcogen linkages (ether and sulfide) promote the introduction of chloromethyl groups (and thus, ammonium groups) to each phenylene ring, providing high ammonium density in the hydrophilic blocks. Improvement of hydroxide ion conductivity is expected.
In chapter 3, synthesis and properties of anion conductive aromatic copolymers containing oligophenylene moieties as a scaffold for quaternized ammonium groups are
N N N Ru N N N O x y z 2+
-19-
described. The hydrophilic components consist of a chemically robust oligophenylene main chain modified with a high density of ionic groups. A partially fluorinated oligo(arylene ether) was employed as a hydrophobic block. The targeted copolymers were synthesized via nickel-mediated coupling polymerization, followed by chloromethylation, quaternization, and ion exchange reactions. Trade-off relation between hydroxide ion conductivity and chemical stability are expected to be improved by high ammonium group densities without hetero linkages.
In chapter 4, properties of the above mentioned anion conductive ionomer membranes were compared with those of state-of-the-art ionomers. Future prospects of anion conductive ionomer membranes for alkaline fuel cell applications are also discussed.
References
(1) International Union of Pure and Applied Chemistry Compendium of Chemical Terminology Gold Book, 2014.
(2) Greaves, T. L.; Drummond, C. J. Chem. Rev. 2008, 108, 206-237.
(3) Tant, M. R.; Mauritz, K. A.; Wilkes, G. L. Ionomers: Synthesis, Structure, Properties and Applications; Springer, 1997.
(4) Hirst, A. R.; Escuder, B.; Miravet, J. F.; Smith, D. K. Angew. Chem. Int. Ed. 2008, 47, 8002–8018.
(5) Buchholz, F. L.; Graham, A. T. Modern Superabsorbent Polymer Technology; Wiley: New York, 1998.
(6) Furusho, Y. Yashima, E. Macromol. Rapid Commun. 2011, 32, 136-146. (7) Furusho, S.; Kikuchi, T.; Tashiro, T.; Sugimoto, R. EP0609839 B1, 1997. (8) Mauritz, K. A.; Moore, R. B. Chem. Rev. 2004, 104, 4535-4585.
(9) Wei, J.; Stone, C.; Steck, A. E. U.S. Patent 5,422,411.
(10) Izuhara, D.; Swager, T. M.; J. Am. Chem. Soc. 2009, 131, 17724–17725.
(11) Lee, M.; Choi, U. H.; Colby, R. H.; Gibson, H. W. Macromol. Chem. Phys. 2015, 216, 344-349.
(12) Goto, K.; Rozhanskii, I.; Yamakawa, Y.; Otsuki, T.; Naito, Y. Polym. J. 2009, 41, 95-104.
-20-
(13) Okaba, M.; Goto, K. Japan Patent 2003-201403, 2003
(14) Miyahara, T.; Hayano, T.; Matsuno, S.; Watanabe, M.; Miyatake, K. ACS Appl. Mater. Interfaces 2012, 4, 2881-2884.
(15) Newman, J.; Thomas-Alyea, K. E. Electrochemical Systems; Wiley: New York, 2004. (16) Watanabe, T.; Kanamura, K.; Masuda, H.; Watanabe, M. Electrochemistry; Maruzen: Tokyo, 2001.
(17) National Institute of Standards and Technology CODATA Internationally Recommended Values of the Fundamental Pkysical Constants, 2010. (http://physics.nist.gov/cuu/Constants/ index.html)
(18) Cotton, F. A.; Wilkinson, G.; Gauss, P. L. Basic Inorganic Chemistry; Wiley: New York, 1995.
(19) Kittel, C. Introduction to Solid State Physics; Wiley: New York, 1986.
(20) Kreuer, K.-D.; Paddison, S. J.; Spohr, E.; Schuster, M. Chem. Rev. 2004, 104, 4637-4678
(21) The Electrochemical Society of Japan Handbook of Electrochemistry; Maruzen: Tokyo, 2013.
(22) Marx, D.; Tuckerman, M. E.; Hutter, J.; Parrinello, M. Nature 1999, 397, 601-604. (23) Tuckerman, M. E.; Marx, D.; Parrinello, M. Nature 2002, 417, 925-929.
(24) Hamley, I. W. Angew. Chem. Int. Ed. 2003, 42, 1692-1712.
(25) Israelachvili, J. N. Intermolecular and Surface Forces; Academic Press: London, 1992.
(26) Soberats, B.; Yoshio, M.; Ichikawa, T.; Taguchi, S.; Ohno, H.; Kato, T. J. Am. Chem. Soc. 2013, 135, 15286-15289.
(27) Yano, S.; Hirasawa, E. Development of Ionomer and Ion Containing Polymer; CMC Publishing: Tokyo, 2009.
(28) Kim, M.-H.; Glinka, C. J.; Grot, S. A.; Grot, W. G. Macromolecules 2006, 39, 4775-4787.
(29) Gierke, T; Munn, G; Wilson, F. J. Polym. Sci., Polyme. Phys. 1981, 19, 1687-1704. (30) Hsu, W. Gierke, T. J. Membr. Sci. 1983, 13, 307-26.
-21-
(32) Hwang, G. S.; Kaviany, M.; Gostick, J. T.; Kientiz, B.; Weber, A. Z.; Kim, M. H. Polymer 2011, 52, 2584-2593.
(33) Haubold, H. G.; Vad, T.; Jungbluth, H.; Hiller, P.; J. Phys. Chem. B 2001, 46,1559-1563.
(34) Webber, A.; Newman, J. J. Electrochem. Soc. 2003, 150, A1008-A1015. (35) Schmidt-Rohr, K.; Chen, Q. Nat. Mater. 2008, 7, 75-83.
(36) David G. Bucknall, D. G.; Anderson, H. L. Science 2003, 302, 1904-1905.
(37) Park, H. B.; Freeman, B. D.; Zhang, Z.-B.; Sankir, M.; McGrath, J. E. Angew. Chem. Int. Ed. 2008, 47, 6019-6024.
(38) Sata, T. J. Membr. Sci. 2000, 167, 1-31.
(39) Logan, B. E.; Elimelech, M. Nature 2012, 488, 313-319.
(40) Geise, G. M.; Hickner, M. A.; Logan, B. E. ACS Macro Lett. 2013, 2, 814-817. (41) Barbaro, P.; Liguori, F. Chem. Rev. 2009, 109, 515–529.
(42) Groenendaal, L. B.; Jonas, F.; Freitag, D.; Pielartzik, H.; Reynolds, J. R. Adv. Mater. 2000, 12, 481-494.
(43) Lin, J.; Liu, Y.; Zhang, Q. M. Polymer 2011, 52, 540-546.
(44) Takeguchi, T.; Yamanaka, T.; Takahashi, H.; Watanabe, H.; Kuroki, T.; Nakanishi, H.; Orikasa, Y.; Uchimoto, Y.; Takano, H.; Ohguri, N.; Matsuda, M.; Murota, T.; Uosaki, K.; Ueda, W. J. Am. Chem. Soc. 2013, 135, 11125-11130.
(45) Ding, C.; Zhang, H.; Li, X.; Liu, T.; Xing, F. J. Phys. Chem. Lett. 2013, 4, 1281-1294.
(46) Chen, D.; Hickner, M. A.; Agar, E.; Kumbur, E. C. ACS Appl. Mater. Interfaces 2013, 5, 7559-7566.
(47) Pavel, C. C.; Cecconi, F.; Emiliani, C.; Santiccioli, S.; Scaffidi, A.; Catanorchi, S.; Comotti, M. Angew. Chem. Int. Ed. 2014, 53, 1378-1381.
(48) Leng, Y.; Chen, G.; Mendoza, A. J.; Tighe, T. B.; Hickner, M. A.; Wang, C.-Y. J. Am. Chem. Soc. 2012, 134, 9054-9057.
(49) Vielstich, W. Handbook of Fuel Cells; Wiley: Chichester, England, 2009. (50) Steele, B. C. H.; Heinzel, A. Nature 2001, 414, 345-352.
-22-
D.; Wilson, M.; Garzon, F.; Wood, D.; Zelenay, P.; More, K.; Stroh, K.; Zawodzinski, T.; Boncella, J.; McGrath, J. E.; Inaba, M.; Miyatake, K.; Hori, M.; Ota, K.; Ogumi, Z.; Miyata, S.; Nishikata, A.; Siroma, Z.; Uchimoto, Y.; Yasuda, K.; Kimijima, K.; Iwashita, N. Chem. Rev. 2007, 107, 3904-3951.
(52) Varcoe, J. R.; Slade, R. C. T. Fuel Cells 2005, 5, 187-200.
(53) Lu, S.; Pan, J.; Huang, A.; Zhuang, L.; Lu, J. Proc. Natl. Acad. Sci. U.S.A. 2008, 105, 20611-20614.
(54) Yu, E. H.; Wang, X.; Krewer, U.; Li, L.; Scott, K. Energy Environ. Sci. 2012, 5, 5668-5680.
(55) Couture, G.; Alaaeddine, A.; Boschet, F.; Ameduri, B. Prog. Polym. Sci. 2011, 36, 1521-1557.
(56) Merle, G.; Wessling, M.; Nijmeijer, K. J. Membr. Sci. 2011, 377, 1-35.
(57) Hickner, M. A.; Herring, A.; Coughlin J. Polym. Sci., Part B: Polym. Phys. 2013, 51, 1727-1735.
(58) Miyake, J.; Watanabe, M.; Miyatake, K. Polymer J. 2014, 46, 656-663. (59) Varcoe, J.R.; Slade, R.C.T.; Yee, E. L. H. Chem. Commun. 2006, 1428–1429.
(60) Komkova, E. N.; Stamatialis, D. F.; Strathmannb, H.; Wessling, M. J. Membr. Sci. 2004, 244, 25-34.
(61) Pandey, A. K.; Goswami, A.; Sen, D.; Mazumder, S.; Childs, R. F. J. Membr. Sci. 2003, 217, 117-130.
(62) Ren, X.; Price, S. C.; Jackson, A. C.; Pomerantz, N.; Beyer, F. L. ACS Appl. Mater. Interfaces 2014, 6, 13330-13333.
(63) Yao, W.; Tsai, T.; Chang, Y.-M.; Chen, Muguo US6183914, 2001.
(64) Clark, T. J.; Robertson, N. J.; Kostalik H. A.; Lobkovsky, E. B.; Mutolo, P. F.; Abruna, H. D.; Coates G. W. J. Am. Chem. Soc. 2009, 131, 12888-12889.
(65) Kostalik, H. A.; Clark, T. J.; Robertson, N. J.; Mutolo, P. F.; Longo, J. M.; Abruna, H. D.; Coates, G. W. Macromolecules 2010, 43, 7147-7150.
(66) Robertson, N. J.; Kostalik, H. A.; Clark, T. J.; Mutolo, P. F.; Abruna, H. D.; Coates, G. W. J. Am. Chem. Soc. 2010, 132, 3400-3404.
-23- Cornelius, C. J. Chem. Mater. 2008, 20, 2566-2573.
(68) Wanga, G.; Wenga, Y.; Chub, D.; Chena, R.; Xie, D. J. Membr. Sci. 2009, 332, 63-68. (69) Pan, J.; Lu, S.; Li, Y.; Huang, A.; Zhuang, L.; Lu, J. Adv. Funct. Mater. 2010, 20, 312-319.
(70) Li, N.; Leng, Y.; Hickner, M. A.; Wang, C.-Y. J. Am. Chem. Soc. 2013, 135, 10124-10133.
(71) Wang, J.; Zhao, Z.; Gong, F.; Li, S.; Zhang, S. Macromolecules 2009, 42, 8711– 8717.
(72) Elabd, Y. A.; Hickner, M. A. Macromolecules 2011, 44, 1-11. (73) Li, N.; Guiver, M. D. Macromolecules 2014, 47, 2175-2198. (74) Hwanga, G.-J.; Ohya, H. J. Membr. Sci. 1998, 140, 195-203. (75) Hwanga, G.-J.; Ohya, H. J. Membr. Sci. 1998, 149, 163-169.
(76) Tanaka, M.; Fukasawa, K.; Nishino, E.; Yamaguchi, S.; Yamada, K.; Tanaka, H.; Bae, B.; Miyatake, K.; Watanabe, M. J. Am. Chem. Soc. 2011, 133, 10646−10654.
(77) Ono, H.; Miyake, J.; Bae, B.; Watanabe, M.; Miyatake, K. Bull. Chem. Soc. Jpn. 2013, 86, 663−670.
(78) Park, D.-Y.; Kohl, P. A.; Beckham, H. W. J. Phys. Chem. C 2013, 117, 15468-15477. (79) Hibbs, M. R.; Fujimoto, C. H.; Cornelius, C. J. Macromolecules 2009, 42, 8316– 8321.
(80) McMurry, J. E. Organic chemistry; Cengage learning: Stanford, 2003.
(81) Edson, J. B.; Macomber, C. S.; Pivovar, B. S.; Boncella, J. M. J. Membr. Sci. 2012, 399-400, 49-59.
(82) Chempath, S.; Einsla, B. R.; Pratt, L. R.; Macomber, C. S.; Boncella, J. M.; Rau, J. A.; Pivovar, B. S. J. Phys. Chem. C 2008, 112, 3179-3182.
(83) Chempath, S.; Boncella, J. M.; Pratt, L. R.; Henson, N.; Pivovar, B. S. J. Phys. Chem. C 2010, 114, 11977-11983.
(84) Long, H.; Kim, K.; Pivovar, B. S. J. Phys. Chem. C 2012, 116, 9419-9426.
(85) Arges, C. G.; Parrondo, J.; Johnson, G.; Nadhan, A.; Ramani, V. J. Mater. Chem. 2012, 22, 3733-3744.
-24- 423-424, 438-449.
(87) Choe, Y.-K.; Fujimoto, C.; Lee, K.-S.; Dalton, L. T.; Ayers, K.; Henson, N. J.; Kim, Y. S. Chem. Mater. 2014, 26, 5675-5682.
(88) Arges, C. A.; Ramani, V. Proc. Natl. Acad. Sci. USA 2013, 110, 2490-2495.
(89) Li, N.; Yan, T.; Li, Z.; Thurn-Albrecht, T.; Binder, W. H. Energy Environ. Sci. 2012, 5, 7888-7892.
(90) Gu, S.; Cai, R.; Luo, T.; Chen, Z.; Sun, M.; Liu, Y.; He, G.; Yan, Y. Angew. Chem. Int. Ed. 2009, 48, 6499-6502.
(91) Gu, S.; Cai, R.; Luo, T.; Jensen, K.; Contreras, C.; Yan, Y. ChemSusChem 2010, 3, 555-558.
(92) Lu, S.; Pan, J.; Huang, A.; Zhuang, L.; Lu, J. Proc. Natl. Acad. Sci. U. S. A. 2008, 105, 20611-20614.
(93) Noonan, K. J. T.; Hugar, K. M.; Kostalik, H. A.; Lobkovsky, E. B.; Abrunna, H. D.; Coates, G. W. J. Am. Chem. Soc. 2012, 134, 18161-18164.
(94) Thomas, O.; Soo, K.; Peckham, T.; Kulkarni, M.; Holdcroft, S. J. Am. Chem. Soc. 2012, 134, 10753-10756.
(95) Wright, A.; Holdcroft, S. ACS Macro Lett. 2014, 3, 444-447.
(96) Zha, Y.; Disabb-Miller, M. L.; Johnson, Z. D.; Michael A. Hickner, M. A.; Tew, G. N. J. Am. Chem. Soc. 2012, 134, 4493-4496.
-25-
Chapter 2
Anion Conductive Aromatic Ionomer Membranes
Containing Ammonium-Functionalized Diphenyl Ether
or Sulfide Groups
2.1 Introduction
In this chapter, the objective is to evaluate the effect of diphenyl ether and diphenyl sulfide groups as a scaffold for ammonium groups on the structure and properties of anion conductive aromatic block copolymer membranes. Because of the strong electron- donating properties of chalcogen bonds, each phenylene ring could be substituted quantitatively with an ammonium group by the Friedel-Crafts chloromethylation reaction followed by the Menshutkin reaction with trimethylamine, providing high ammonium density in the hydrophilic blocks. Furthermore, rather flexible chalcogen bonds are expected to provide anion conductive ionomers with good solubility in organic solvents. Syntheses, characterization, properties, and fuel cell performance of diphenyl ether (QPE-O) and diphenyl sulfide (QPE-S) containing anion conductive aromatic block ionomers are described.
2.2 Experimental Section Materials.
Decafluorobiphenyl (DFBP, >98.0%, TCI Inc.), hexafluorobisphenol A (HFBPA, >98.0%, TCI Inc.), bis(4-hydroxyphenyl)sulfide (BHPS, >98.0%, TCI Inc.), bis(4-hydroxyphenyl) ether (BHPE, >98.0%, TCI Inc.), potassium carbonate (>99.5%, Kanto Chemical), chloromethyl methyl ether (CMME, >94.0%, Kanto Chemical), 0.5 M zinc chloride tetrahydrofuran solution (Sigma-Aldrich), 45 wt % trimethylamine aqueous solution (Sigma-Aldrich), methanol (>99.8%, Kanto Chemical), dimethyl sulfoxide (DMSO, >99.0%, Kanto Chemical), and potassium hydroxide (>86.0%, Kanto Chemical) were commercial products and used as received. N,N-Dimethylacetamide (DMAc, >99.0%, Kanto Chemical), toluene (>99.5%, Kanto Chemical), and 1,1,2,2-tetrachloroethane (TCE, >97.0%, Kanto Chemical) were dried over 4 Å molecular sieves (Kanto Chemical) prior
-26-
to use. Chloroform-d1 with 0.03% TMS (CDCl3, 99.8 atom % D, Acros Organics),
dimethyl-d6 sulfoxide with 0.03% TMS (DMSO-d6, 99.9 atom % D, Acros Organics),
N,N-dimethylformamide (DMF, >99.7%, Kanto Chemical), anhydrous lithium bromide (>95.0%, Kanto Chemical), potassium tetrachloroplatinate (II) (>95.0%, Kanto Chemical), and 60 wt % hydrazine hydrate aqueous solution (Otsuka Chemical) were commercial products and used as received.
Synthesis of DFBP-terminated Telechelic Oligomers 1.
A typical procedure is as follows (X = 4). A 100 mL round-bottomed flask equipped with a mechanical stirrer, a reflux condenser, a Dean-Stark trap, and a nitrogen inlet/outlet was charged with HFBPA (2.5 g, 7.4 mmol), potassium carbonate (1.5 g, 11 mmol), DMAc (16 mL), and toluene (8.0 mL). The mixture was stirred at 150 °C for 3 h for azeotropic removal of water with toluene. After cooling to room temperature, DFBP (3.0 g, 8.9 mmol) was added to the mixture. The reaction was carried out at 60 °C for 2 h. Then, additional DFBP (0.30 g, 0.89 mmol) as an end-capping reagent was added to the mixture. After the reaction at 60 °C for 1 h, the mixture was cooled to room temperature, diluted with additional DMAc (20 mL), and poured dropwise into a large excess of ultrapure water to precipitate a white powder. The crude product was washed with hot ultrapure water and hot methanol several times. After drying in a vacuum oven at 60 °C overnight, oligomer 1 was obtained in 84% yield.
Synthesis of BHPE-terminated Telechelic Oligomers 2.
A typical procedure is as follows (Y = 7). A 100 mL round-bottomed flask equipped with a mechanical stirrer, a reflux condenser, a Dean-Stark trap, and a nitrogen inlet/outlet was charged with BHPE (3.4 g, 17 mmol), potassium carbonate (3.5 g, 25 mmol), DMAc (30 mL), and toluene (15 mL). The mixture was stirred at 150 °C for 3 h for azeotropic removal of water with toluene. After cooling to room temperature, DFBP (4.5 g, 14 mmol) was added to the mixture. The reaction was carried out at 60 °C for 2 h. Then, additional BHPE (0.34 g, 1.7 mmol) as an end-capping reagent was added to the mixture. After the reaction at 60 °C for 1 h, the mixture was cooled to room temperature, diluted with
-27-
additional DMAc (30 mL), and poured dropwise into a large excess of ultrapure water to precipitate a white powder. The crude product was washed with hot ultrapure water and hot methanol several times. After drying in a vacuum oven at 60 °C overnight, oligomer 2 was obtained in 71% yield.
Synthesis of BHPS-terminated Telechelic Oligomers 3.
A typical procedure is as follows (Y = 8). A 100 mL round-bottomed flask equipped with a mechanical stirrer, a reflux condenser, a Dean-Stark trap, and a nitrogen inlet/outlet was charged with BHPS (3.7 g, 17 mmol), potassium carbonate (3.5 g, 25 mmol), DMAc (30 mL), and toluene (15 mL). The mixture was stirred at 150 °C for 3 h for azeotropic removal of water with toluene. After cooling to room temperature, DFBP (4.5 g, 14 mmol) was added to the mixture. The reaction was carried out at 60 °C for 2 h. Then, additional BHPS (0.37 g, 1.7 mmol) as an end-capping reagent was added to the mixture. After the reaction at 60 °C for 1 h, the mixture was cooled to room temperature, diluted with additional DMAc (30 mL), and poured dropwise into a large excess of ultrapure water to precipitate a white powder. The crude product was washed with hot ultrapure water and hot methanol several times. After drying in a vacuum oven at 60 °C overnight, oligomer 3 was obtained in 81% yield.
Synthesis of PE-O.
A typical procedure is as follows (X = 4, Y = 7). A 100 mL round-bottomed flask equipped with a mechanical stirrer, a reflux condenser, and a nitrogen inlet/outlet was charged with oligomer 1 (2.2 g, 0.48 mmol), oligomer 2 (1.8 g, 0.48 mmol), potassium carbonate (0.10 g, 0.70 mmol), and DMAc (14 mL). The reaction was carried out at 60 °C for 6 h. The mixture was cooled to room temperature, diluted with additional DMAc (20 mL), and poured dropwise into a large excess of ultrapure water to precipitate a white powder. The crude product was washed with hot ultrapure water and hot methanol several times. After drying in a vacuum oven at 60 °C overnight, PE-O was obtained in 90% yield.
-28- Synthesis of PE-S.
A typical procedure is as follows (X = 4, Y = 8). A 100 mL round-bottomed flask equipped with a mechanical stirrer, a reflux condenser, and a nitrogen inlet/outlet was charged with oligomer 1 (2.1 g, 0.45 mmol), oligomer 3 (2.0 g, 0.45 mmol), potassium carbonate (0.10 g, 0.70 mmol), and DMAc (14 mL). The reaction was carried out at 60 °C for 8 h. The mixture was cooled to room temperature, diluted with additional DMAc (20 mL), and poured dropwise into a large excess of ultrapure water to precipitate a white powder. The crude product was washed with hot ultrapure water and hot methanol several times. After drying in a vacuum oven at 60 °C overnight, PE-S was obtained in 91% yield.
Chloromethylation of the Block Copolymers.
A typical procedure is as follows (CMPE-O (X = 4, Y = 7)). A 100 mL pressure bottle equipped with a magnetic stirring bar was charged with PE-O (1.0 g, 0.056 mmol), 0.5 M zinc chloride tetrahydrofuran solution (2.0 mL, 1.0 mmol), CMME (12 mL, 160 mmol), and TCE (22 mL) in a glovebox under argon. The reaction was carried out at 80 °C for 120 h. The mixture was cooled to room temperature, diluted with additional TCE, and poured dropwise into a large excess of methanol to precipitate a white powder. The crude product was washed with methanol several times. After drying in a vacuum oven at 60 °C overnight, CMPE-O was obtained in 84% yield.
Preparation of Quaternized Membranes.
CMPE-O (or S) (0.20 g) was dissolved in TCE (2.0 mL) and cast onto a flat glass plate. After drying the solution at 50 °C, a membrane was obtained (ca. 50 μm thick). The membrane was immersed in 45 wt % trimethylamine aqueous solution at room temperature for 48 h. The membrane was washed with ultrapure water several times. After drying in a vacuum oven at 60 °C overnight, QPE-O (or -S) membrane (in chloride form) was obtained. The QPE-O (or -S) membrane (0.20 g) was dissolved in DMSO (4.0 mL) and recast onto a flat glass plate. After drying the solution at 60 °C, a membrane was obtained (ca. 50 μm thick). Then, the membrane was treated with 1 M potassium hydroxide aqueous solution at room temperature for 48 h. The membrane was washed and
-29-
soaked in degassed ultrapure water for 1 day to obtain a QPE-O (or -S) membrane (in hydroxide form).
Measurements.
1H (500 MHz) and 19F (471 MHz) NMR spectra were obtained on a JEOL JNM-ECA 500
using CDCl3 or DMSO-d6 as a solvent and TMS as an internal reference. Apparent
molecular weights were measured with gel permeation chromatography (GPC) with a Jasco 805 UV detector. DMF containing 0.01 M lithium bromide was used as an eluent. A Shodex K-805L column was used for polymers, and a Shodex SB-803HQ column was used for oligomers, respectively. Molecular weights were calibrated with standard polystyrene samples. For transmission electron microscopic (TEM) observation, the membranes were stained with tetrachloroplatinate ions by ion exchange of the ammonium groups in a 0.5 M potassium tetrachloroplatinate (II) aqueous solution, rinsed with ultrapure water, and dried in a vacuum oven at 80 °C overnight. The stained membranes were embedded in epoxy resin, sectioned to 50 nm thickness with a Leica microtome Ultracut UCT, and placed on copper grids. Images were taken on a Hitachi H-9500 TEM with an accelerating voltage of 200 kV. Hydroxide ion conductivity of the membranes was measured in a degassed, ultrapure water (18 MΩ cm) using a four-probe conductivity cell attached with impedance spectroscopy (Solartron 1255B and 1287). Ion conducting resistances (R (Ω)) were determined from the impedance plot obtained in the frequency range from 10 to 105 Hz. The hydroxide ion conductivity (σ (S cm−1)) was calculated from
the equation: σ = l/(A × R), where l (cm) and A (cm2) are the distance between inner two
probes and the conducting area, respectively. Water uptake and dimensional change measurements were carried out in ultrapure water at room temperature for 24 h. Drying the membranes in a vacuum oven at 80 °C provided weight (Wd (g)) and length (Dd (cm))
of dry membranes. Weight (Ww (g)) and length (Dw (cm)) of wet membranes were
measured after the surface water was carefully wiped off with tissue paper. The water uptake of the membranes was calculated using the following equation: water uptake (%) = (Ww − Wd)/Wd × 100. The dimensional change was calculated using the following
-30-
(DMA) was carried out with an ITK DVA-225 dynamic viscoelastic analyzer. Relative humidity (RH) dependence of storage modulus (E’ (Pa)), loss modulus (E’’ (Pa)), and tan δ at 80 °C was obtained for the membrane (5 mm × 30 mm) at a humidification rate of 1% RH min−1. Hydrogen and oxygen permeability was measured with a GTR Tec
GTR-20XFYC gas permeation measurement apparatus equipped with a Yanaco G2700T gas chromatograph (GC) with a thermal conductivity detector. Argon and helium were used as a carrier for the measurement of hydrogen and oxygen, respectively. The same humidity conditions were applied to both test and carrier gases to ensure homogeneous wetting of the membrane samples. Then, flow gas was sampled and subjected to the GC to quantify the test gas permeated through the membrane. The measurement was repeated until stable permeation data were obtained. The gas permeability coefficient of the membranes (Q (cm3 (STP) cm s−1 cm−2 cmHg−1)) was calculated using the following
equation: Q = 273/T × 1/A × B × 1/t × d × 1/(76 − Pwater), where T (K) is the absolute
temperature, A (cm2) is the permeation area, B (cm3) is the volume of the test gas
permeated through the membrane, t (s) is the sampling time, d (cm) is the thickness of the membrane, and Pwater (cmHg) is the water vapor pressure. Hydrazine permeability was
determined using an H-type two-compartment cell separated by the membranes. A 10 wt % hydrazine aqueous solution was poured into one compartment, and ultrapure water was poured into the other compartment on the same level. The solutions were stirred with a magnetic stirring bar to ensure the homogeneity of the solutions. A total of 1 mL of solution was sampled from the ultrapure water side every hour for 5 h, and 1 mL of fresh ultrapure water was added each time. The sampled solutions were diluted by 100 times with ultrapure water, and the mass of hydrazine in the solutions was quantified with a Metrohm 881 Compact IC ion chromatography. The hydrazine permeability of the membranes (Q’ (g mm m−2 h−1)) was calculated using the following equation: Q’ = m/t × d
× 1/A, where m (g) is the mass of hydrazine permeation per hour, t (h) is the sampling time, d (mm) is the thickness of the membrane, and A (m2) is the permeation area.
Preparation of Catalyst Coated Membrane (CCM).
-31-
VP-50 ultrasonic homogenizer for 10 min. A 2 wt % QPE-O (IEC = 0.7 mequiv g−1, 0.83
g as polymer weight) solution in DMF was added to the mixture, which was sonicated for 3 min and stirred with an IKA VIBRAX VXR basic shaker for 15 min. The slurry obtained was sprayed onto one side of a QPE-O membrane (IEC = 1.9 mequiv g−1, 16
cm2) to form the anode catalyst layer. The coated area was 4.4 cm2. Then, iron
phenanthroline (0.050 g) and DMF (2.0 mL) were mixed with an ITOH LA-PO.1 ball mill at 200 rpm for 2 h and sonicated for 60 min. A 2 wt % QPE-S (IEC = 1.9 mequiv g−1, 0.84
g as polymer weight) solution in DMF was added to the mixture, which was sonicated for 3 min. A 60 wt % polytetrafluoroethylene dispersion (Daikin, D-210C, 0.0034 g) was added to the mixture and stirred for 15 min. The slurry obtained was sprayed onto the other side of the membrane in a similar way to that described above, to form the cathode catalyst layer. The loaded amounts of the catalysts were 2.6 mg cm−2 for NiZn as the
anode and 1.0 mg cm−2 for iron phenanthroline as the cathode. The catalyst-coated
membrane (CCM) was pressed at 13 MPa at room temperature for 30 s.
Fuel Cell Operation.
The CCM was monnted in a single cell with a gas diffusion layer (anode: cloth, Zoltek and cathode: cloth, Zoltek with microporous layer) and treated with 1.0 M potassium hydroxide aqueous solution overnight for the ion exchange of the membrane and binder to the hydroxide form. A fuel cell was operated at 80 °C, supplying a mixture of 1.0 M potassium hydroxide and 5.0 wt % hydrazine aqueous solution to the anode at a flow rate of 2 mL min−1 and humidified air (26% RH) to the cathode at a flow rate of 500 mL min−1.
The operating pressure was set at 20 kPa for both electrodes. Point symmetric serpentine flow fields were used for both electrodes.
2.3 Results and Discussion
2.3.1 Synthesis and Characterization
The title quaternized block copolymers, QPE-O and -S, were synthesized as shown in Scheme 2-1. Hydrophobic oligomers 1 were prepared by nucleophilic substitution polycondensation of DFBP and HFBPA under basic conditions. Slight excess of DFBP was
-32-
used to obtain fluorine-terminated telechelic oligomers 1 with controlled chain length. The chemical structure of 1 was characterized by 1H and 19F NMR spectra, in which all peaks
were well-assigned to the supposed chemical structure (Figure 2-1). A detailed discussion on the synthesis and characterization of 1 can be found in previous report.1 The numbers of
a repeat unit of 1 were estimated from the 19F NMR spectra and GPC analyses (calibrated
with polystyrene standards), which were in fair agreement with those expected from the feed comonomer ratios (Table 2-1).
Precursor oligomers 2 and 3 for the hydrophilic blocks were prepared from DFBP and BHPE for 2 or BHPS for 3 under the reaction conditions similar to those for 1. The chemical structure of 2 and 3 was characterized by 1H and 19F NMR spectra (Figure 2-2
and Figure 2-3). In the 1H NMR spectra of oligomers 2 and 3, the small peaks at 6.7-7.3
ppm were assignable to the terminal bisphenol groups. The 19F NMR spectra of oligomers 2
and 3 showed two large peaks at −137.9 and −153.0 ppm, suggesting that the reaction of DFBP occurred preferentially at its 4,4’-positions to give the linear oligomers 2 and 3. In the 19F NMR spectra of oligomers 2 and 3, no peaks derived from DFBP-terminal were
confirmed, indicating complete end-capping with hydroxyl-containing monomers (BHPE or BHPS). The numbers of repeat units of 2 and 3 were estimated from the 1H NMR spectra
and GPC analyses, which were somewhat greater than those expected from the feed comonomer ratios (Table 2-2), probably due to slightly lower reactivity of BHPE and BHPS compared to HFBPA.
PE-O and -S were synthesized via block copolymerization of the oligomers 1 and 2 or 3 under conditions similar to those for the above-mentioned oligomers. The molecular weight calculated from the NMR spectra was used for calculation of the feed oligomer ratio. Block copolymerization reactions were carried out at low temperature (60 °C) and short time (8 h) to avoid unfavorable side reactions such as cross-linking or branching. The obtained PE-O and -S were soluble in organic solvents such as chloroform, TCE, DMSO, DMAc, and DMF. PE-O and -S were characterized by 1H and 19F NMR spectra, which suggested the
equimolar components of the starting oligomers (Figure 2-4a and Figure 2-5a). There was no detectable evidence of the terminal groups and unfavorable side reactions. The molecular weights of PE-O and -S were Mn = 18-70 kDa and Mw = 61-263 kDa,
-33-
…………..
-34-
Figure 2-1. 1H and 19F NMR spectra of oligomer 1 (X = 5).
Table 2-1. Molecular Weight of Oligomers 1
xa xb xc Mnd/kDa Mwd/kDa Mw/Mn
1
5 4.4 6.8 4.6 8.4 1.8 4 5.3 5.4 3.9 6.3 1.6 22 23.9 16.8 10.9 22.3 2.0
aCalculated from the feed comonomer ratio. bDetermined by 19F NMR spectra. cCalculated
-35-
Figure 2-2. 1H and 19F NMR spectra of oligomer 2 (Y = 11).
-36- Table 2-2. Molecular Weight of Oligomers 2 and 3
ya yb yc Mnd/kDa Mwd/kDa Mw/Mn 2 4 6.4 9.2 4.8 8.4 1.7 4 7.0 8.1 4.4 7.4 1.7 8 11.3 10.7 6.7 24.5 3.7 3 4 6.8 10.6 5.7 10.4 1.8 4 8.0 7.0 3.8 5.9 1.6
aCalculated from the feed comonomer ratio. bDetermined by 1H NMR spectra. cCalculated
from Mn. dDetermined by GPC analyses (calibrated with polystyrene standards).
respectively (Table2-3), which were several times greater than those of the starting oligomers to support the formation of the multiblock copolymers. It should be noted that the apparent molecular weights obtained by GPC analyses with polystyrene standards could be overestimated since PEs as typical aromatic polymers would not form a typical random coil configuration in the GPC eluents (DMF containing 0.01 M LiBr).
A Friedel-Crafts chloromethylation reaction of the PE-O and -S with CMME was carried out using zinc chloride as a Lewis acid catalyst in TCE solution. CMPE-O and -S showed slightly better solubility than the parent PE-O and -S and were soluble in chloroform, TCE, DMAc, DMF, and DMSO. In the 1H NMR spectra of CMPE-O and -S, a new peak (peak 8)
appeared at 4.7 ppm assignable to the chloromethyl groups. The peaks 3 and 4 were smaller than those of the precursor PE-O and -S (Figure 2-4b and Figure 2-5b). The results indicate that the chloromethyl groups were substituted onto the mainchain phenylene rings at both positions ortho and meta to the ether groups, probably due to their similar electron densities and steric situations.2 The degree of chloromethylation in CMPE-O was higher than that of
CMPE-S under the same reaction conditions. In previous polymers containing fluorenylidene biphenyl groups, the chloromethyl groups could not be substituted at the main-chain phenylene rings but only on the fluorenyl groups.1 In the present polymers, the
main chain phenylene groups were chloromethylated because of the strong electron-donating chalcogen (ether and sulfide) groups. In the 19F NMR spectra of
-37-
…..
Figure 2-4. 1H NMR spectra of (a) PE-O (X = 5, Y = 11) in CDCl3, (b) CMPE-O (X = 5, Y
-38-
Figure 2-5. 1H NMR spectra of (a) PE-S (X = 4, Y = 8) in CDCl3, (b) CMPE-S (X = 4, Y =
-39-
Table 2-3. Properties of PE, CMPE, and QPE-O and -S Molecular weight DCb IEC c /mequiv g-1 Mna/kDa Mwa/kDa QPE-O (X5Y11) 29 127 2.1 2.1 QPE-O (X9Y8) 64 277 2.1 1.5 QPE-O (X4Y7) 18 61 1.9 1.3 QPE-O (X4Y7) 18 61 1.4 1.0 QPE-O (X24Y6) 70 232 2.1 0.7 QPE-S (X4Y8) 21 97 1.8 1.3 QPE-S (X4Y8) 21 97 1.2 1.0 QPE-S (X24Y7) 59 263 1.9 0.7
aDetermined by GPC analyses (calibrated with polystyrene standards). bDegree of
chloromethylation = (amount of chloromethyl group/repeat unit), calculated from 1H NMR
spectra. cExpected IECs calculated from 1H NMR spectra.
the same chemical shift to those of the precursor PE-O and -S. The result is indicative that no chloromethylation occurred at the phenylene rings bonded with electron-withdrawing trifluoromethyl groups in the hydrophobic blocks. The degree of chloromethylation was estimated from the integral ratios of the peaks of chloromethyl groups (peak 8) to the peaks of phenylene protons ortho to the hexafluoropropyl groups (peak 2) in the 1H NMR spectra.
As summarized in Table 2-4, the degree of chloromethylation increased with the reaction time and temperature and the amount of CMME. A nearly quantitative chloromethylation reaction (each phenylene ring in diphenyl ether and diphenyl sulfide groups was chloromethylated) was achieved. GPC profiles were unimodal and shifted to lower retention time (higher molecular weight) compared to those of the starting PE-O and -S. The 1H and 19F NMR spectra and GPC profiles of the CMPE-O and -S suggested no
detectable evidence of degradation and cross-linking during the chloromethylation reaction. Casting from the TCE solution of CMPE-O and -S provided colorless, transparent, and bendable membranes. The membranes were quaternized by treating with trimethylamine
-40-
aqueous solution. A series of QPE membranes with ion exchange capacity (IEC) values ranging from 0.7 to 2.1 mequiv g−1 were obtained. The as-prepared QPE-O and -S
membranes were light brown and less flexible compared with the parent CMPE membranes. Unlike previous QPEs with quaternized fluorenyl groups,1,2,3 the obtained QPE-O and -S
were soluble in polar organic solvents such as DMSO and DMF, which enabled recasting the membranes. The flexibility (bendability) of the membranes was recovered by recasting from DMSO solutions. In the 1H NMR spectra of QPE-O and -S, new peaks (peak 9)
appeared at 4.8 ppm assignable to the methyl groups on quaternary ammonium groups (Figure 2-4c and Figure 2-5c). The peaks 8 shifted to a higher magnetic field compared to those of CMPE-O and -S, indicating complete quaternization of the chloromethyl groups in CMPE-O and -S. GPC analyses were unavailable because of the possible interactions of the quaternized polymers with the GPC columns. The difference in the hydrophilic block (diphenyl sulfide and diphenyl ether) had a minor effect on the syntheses.
Table 2-4. Degree of Chloromethylation in PE-O and -S
Temperature /°C CMMEa Reaction time /h DCb
PE-O (X4Y7) 50 80 48 0.8 50 80 120 1 50 160 48 1.3 80 80 48 1.3 80 80 120 1.4 80 160 120 1.9 PE-S (X4Y8) 50 80 48 0.3 50 80 120 0.6 50 160 48 0.6 80 80 48 0.7 80 80 120 0.8 80 160 120 1.8
aEquivalent vs repeat unit. bDegree of chloromethylation = (amount of chloromethyl
-41- 2.3.2 Morphology
Figure 2-6 shows cross-sectional TEM images of QPE-O and -S (in tetrachloroplatinate form), in which the dark areas represent ionic clusters composed of ammonium tetrachloroplatinate groups and the bright areas represent hydrophobic moieties composed of polymer main chains. QPE-O and -S membranes displayed distinct phaseseparated morphology similar to those of partially fluorinated QPE membranes with comparable IEC.1 The hydrophilic domains were ca. 5 nm wide and interconnected throughout the
field of view. The two membranes with the same IEC values (Figure 2-6a and Figure 2-6c) showed similar morphology, indicating that the chalcogen bonds in the hydrophilic blocks did not impact the phase-separated morphology. The QPE-O membrane with higher IEC (Figure 2-6b) did not provide more developed phase separation, indicating that IEC showed a minor effect. The phase-separated morphology was not as distinct as those of previous quaternized multiblock poly(arylene ether)s containing fluorenyl groups in the hydrophilic block, while the latter was quaternized after the casting. It is considered that bulky fluorenyl groups could contribute to development of the phase-separated morphology. Similar results were obtained in proton conducting membranes.4,5
2.3.3 Water Uptake and Hydroxide Ion Conductivity
Water uptake at room temperature and hydroxide ion conductivity at 30 °C of QPE-O and -S membranes were measured and are plotted as a function of the IEC in Figure 2-7. Water uptake of QPE-O and -S membranes increased with increasing IEC values as expected. The number of absorbed water molecules per ammonium group (λ) followed the same tendency and was in approximate linear relationship with the IEC value (Figure 2-8). The connecting chalcogen groups, ether or sulfide, did not affect the water absorbing properties of the QPE membranes. In the QPE-O membrane (2.1 mequiv g−1), in-plane
and through-plane dimensional changes were 27% and 12%, respectively. QPE-O membranes showed slightly higher hydroxide ion conductivity than that of QPE-S membranes with comparable IEC. The local IEC value in the hydrophilic block was higher for QPE-O (2.9 mequiv g−1) than for QPE-S (2.7 mequiv g−1), which could account
-42-
………
Figure 2-6. TEM images of (a) QPE-O (X = 4, Y= 7, IEC = 1.3 mequiv g−1), (b) QPE-O (X = 5, Y = 11, IEC = 2.1 mequiv g−1), and (c) QPE-S (X = 4, Y = 8, IEC = 1.3 mequiv
-43-
Figure 2-7. (a) Water uptake at room temperature and (b) hydroxide ion conductivity at 30 °C of QPE-O and -S membranes as a function of IEC.
-44-
-45-
hydroxide ion conductivity of QPE-O and -S membranes is shown in Figure 2-9. The hydroxide ion conductivity of QPE-O and -S membranes increased with increasing temperature, and QPE-O with the highest IEC (2.1 mequiv g−1) achieved 62 mS cm−1 at
80 °C. While this conductivity was very high, QPE-O and -S membranes exhibited relatively low hydroxide ion conductivity compared to those of poly(arylene ether) block copolymer membranes containing ammonium-substituted fluorenyl groups (Figure 1-15b, 144 mS cm−1 at 80 °C, IEC = 1.9 mequiv g−1) taking the IEC values into account.3 The
results may imply that bulky fluorenyl groups serve better as a scaffold for ionic groups than the slightly bent diphenyl ether and sulfide groups. The hydroxide ion conductivity of the QPE-O and -S membranes showed approximate Arrhenius-type temperature dependence. The apparent activation energies were estimated from the slopes to be 11−17 kJ mol−1, which were similar to those of previous QPEs,1 indicating that they share similar
ion-conducting mechanism involving hydrated hydroxide ions. Since QPE-O exhibited higher hydroxide ion conductivity than that of QPE-S, I focused on the QPE-O membrane for further investigation below.
2.3.4 Alkaline Stability Test
An alkaline stability test of the QPE-O membrane (IEC = 1.0 mequiv g−1, in chloride
form) was carried out in 1 M KOH aqueous solution at 40 °C (Figure 2-10). The QPE-O membrane exhibited an initial conductivity of 6.6 mS cm−1. The conductivity increased to
20.1 mS cm−1 within 48 h since the anions were exchanged from chlorides to more
conductive hydroxides. Then, the conductivity dropped to ca. 5.4 mS cm−1 after 72 h and
maintained a nearly constant value up to 300 h. The post-test analysis was conducted with a 1H NMR spectrum (Figure 2-11). While the integral ratios of the peaks of all aromatic
protons (both hydrophilic and hydrophobic segments) to methylene groups (peak 8) or methyl groups (peak 9) did not change after a 300 h stability test, there were small changes in the aromatic protons associated with benzylammonium groups. In the 19F
NMR spectrum of the post-test sample, the peaks assignable to octafluorobiphenylene groups became smaller and new peaks appeared nearby. The results indicate that QPE-O degraded to a small extent during the stability test most probably in the hydrophilic blocks,
-46-
…....
Figure 2-9. Temperature dependence of hydroxide ion conductivities of QPE-O and -S membranes.
-47-
Figure 2-10. Time course of ion conductivity of QPE-O membrane (IEC = 1.0 mequiv g−1) in 1 M KOH aqueous solution at 40 °C.
-48-
Figure 2-11. (a) 1H and (b) 19F NMR spectra of QPE-O (in DMSO-d6 at room