ANALYSIS OF THE URBAN THERMAL
ENVIRONMENT ASSOCIATED WITH SOCIO
ECONOMIC CONDITIONS IN JAKARTA,
INDONESIA USING SATELLITE REMOTE
SENSING
衛星リモートセンシングを用いたインドネシア・ジャカルタ市における熱環
境と社会経済条件の比較分析
September 2014
Hasti Widyasamratri
ANALYSIS OF THE URBAN THERMAL
ENVIRONMENT ASSOCIATED WITH SOCIO
ECONOMIC CONDITIONS IN JAKARTA,
INDONESIA USING SATELLITE REMOTE
SENSING
YAMANASHI UNIVERSITY GRADUATE SCHOOL JOINT
MEDICAL ENGINEERING DEPARTMENT
DOCTORAL COURSE DISSERTATION
September 2014
ABSTRACT
ANALYSIS OF THE URBAN THERMAL ENVIRONMENT
ASSOCIATED WITH SOCIO ECONOMIC CONDITIONS IN
JAKARTA, INDONESIA USING SATELLITE REMOTE SENSING
Hasti Widyasamratri
Indonesia population has reached 225 million by 2006 (Indonesia statistic bureau, 2006) and more than 50 % population is concentrated in Java island which comprises about 7 % of the total land area. Rapid growth of population is triggering to high intensive urbanization and environmental problem in the big city such as Jakarta. The urbanization is characterized by change of agricultural to non-agricultural activities and can be associated by change of vegetation to impervious surfaces. Less vegetation area in urban areas, which would bring air temperature rise and high density of transportation, is found to be the most important cause of urban heat island in Jakarta. High concentration of population in urban areas can aggravate the urban environmental condition. In some developed areas, dense ground meteorological sites are installed to measure air temperature (Ta) in 1.5 – 2 m height above the ground. However, this condition is relatively difficult to apply in developing areas.
The usage of remote sensing satellite to detect physical component including thermal condition in a large spatial area has been widely known. Thermal infra-red remote sensing data is one of the satellite data sources that can help to determine surface temperature (TS) from the space. It can provide large scale area on earth surface distribution data and the isolated area even it cannot calculate detail information of temperature. Ta components are governed from the earth-atmosphere balance, such as absorption of incoming solar radiation, emission of infrared long wave radiation and the sensible-latent heat loss. These Ta components are connected to TS that can be extracted from thermal sensor in satellite remote sensing
Thermal environment status in urban area, which extracted remote sensing data, and its relation with urban socioeconomic condition become the objectives of this research.
Firstly, we investigated land cover at Jakarta in 1989 and 2006 to understand the distribution of land surface features in urban areas. The result shows that the built-up areas are growing to the outer city while vegetation areas are decreased. The thermal environment, observed by direct measurement (September – October 2012), shows the features of urban heat island at Jakarta, which were characterized by high air temperature in the city center at night time. Thermal environment in Jakarta has been
influenced by the sea breezes from the Java sea in the northern area, and the mountainous in the southern area.
Secondly, to estimate Ta from satellite-derived TS, we applied simple regression (SR) method to Landsat data in 1989 and 2006. From the comparison between ground-based observation of TS and Ta, it was shown that they are correlated strongly enough to use that data to Ta estimation (R2 = 0.74). The minimum value of Ta estimated in 1989 was 20.11 °C, maximum value was 35.62 °C, and standard deviation was (SD) 5.93 °C. In 2006, the minimum was 31.8 °C, maximum value was 37.6 °C, and standard deviation was 6.35 °C. Large standard deviation in these results shows that this method still needs to be improved.
To improve the method, we tested simple regression and surface energy balance (SEB) method into MODIS (2012 dry season) data. In the estimated value by SR method with MODIS data, the RMSE at night time was 15.53 °C, the minimum value was 19.62°C, and maximum value was 22.49 °C, respectively. In daytime, RMSE was 11.69°C, and minimum value 21.55°C, and maximum value was 31.55°C (appeared in the city center). To reduce the error in Ta estimation, we also applied the SEB method to the same data sets. In the estimated value by SEB method using MODIS data, the RMSE value at the night time was 11.36°C, the minimum value was 23.43°C, and the maximum value was 25°C. In the daytime, the RMSE value was 9.75°C, the minimum value was 25°C, and the maximum value was 30°C. From these results, it was shown that the biases in SEB method were smaller than those in SR method.
Lastly, to detect the relationship between urban thermal environment and socio economic conditions in Jakarta, we combined physical and socioeconomic variables into urban livelihood indices. We used Ta as the physical variable; and we used population, family using electricity, health insurance certificate for poor family, and poor family certificate as the socioeconomic variables. Weighted analysis and overlay technique in ArcGIS was used in this step. Averaged Ta derived from MODIS data sets has close correlation with population except at 1 am. From this relationship, Ta and population are combined and represented by environment index. Low environment index is detected mainly in inner urban both at the nighttime and daytime (36.1% at nighttime and 29.6% in daytime). Socioeconomic index is created by overlaying socioeconomic variables from PODES 2010 except population data; and it represents household and population welfare in study area. In Jakarta, 45.9% areas, where 37.7% families are living, are dominated by fair socioeconomic index. Urban environment livelihood index is the synthesis result from environment index and socioeconomic index in study area. We found that the urban center in Jakarta has low environmental livelihood which was characterized by low environment and high socioeconomic quality.
This study revealed the effectiveness of remote sensing data to estimate Ta in a large scale as an order to overcome the spatial lack of ground meteorological measurement and use the result as the physical parameter to detect urbanization. The SEB method estimates Ta better than SR method and it showed good performance in MODIS data. We also show that the combined index of thermal status and socioeconomic parameters is effective to evaluate the urban livelihood.
要約
衛星リモートセンシングを用いたインドネシア・ジャカルタ市における 熱環境と社会経済条件の比較分析 ハスティ ウィディヤサムラトリ インドネシアの人口は 2006 年までに(インドネシア統計局、2006 年)225 百万人に 達し、50%以上の人口が総面積の約 7%を占めるジャワ島に集中している。都市化は、 農地のそれ以外の土地利用への改変によって特徴付けられ、それは植生域の不浸透 面への変化につながる。気温上昇や交通の過密化をもたらす都市部での植生減少は、 ジャカルタのヒートアイランドの最も重要な原因であることが指摘されている。都市部の 過密な人口も都市環境条件を悪化させうる。一部の開発地域では、地上から高さ 2~ 1.5m の気温(Ta)を測定する地上気象観測点が密に設置されている。しかし、このよう な密な地上観測点の設置は、発展途上国では困難である。 また、大きな空間スケールでの熱環境を含む物理的な要素を検出するために衛星 リモートセンシングが広く利用されている。地表面温度(TS)の空間分布については衛 星による熱赤外線リモートセンシングデータより推定可能である。Ta は、地表面に入 射する太陽放射の吸収、長波放射の放出、顕熱潜熱による損失などの熱収支により 決まっている。これらの Ta を決定する要素は、衛星リモートセンシングから抽出可能な TS から推定することが可能である。 以上を踏まえて、本研究では衛星リモートセンシングによる都市熱環境の抽出、お よび熱環境と社会経済的条件との比較分析を目的とする。 第一に、我々は、都市部における土地表面の特徴の分布を把握するために 1989 年と 2006 年にジャカルタで土地被覆を推定した。その結果、市街地が外側へ拡大し、 植生領域が減少したことを示した。直接測定による熱環境観測(2012 年 9 月-10 月) から、特に夜間の市内中心部における高い気温によって特徴づけられた、ジャカルタ におけるヒートアイランドの特徴が捉えられた。ジャカルタでの熱環境は、北部地域で はジャワ海からの潮風の、南部地域では山岳地帯の影響を受けていることがわかった。 第二に、衛星リモートセンシングから抽出された TSから Ta を推定するために、 我々は 1989 年と 2006 年の Landsat 衛星データに単回帰(SR)法を適用した。地上観 測より得られた TSと Ta の比較から、それらは Ta の推定に使用するのに十分な強い 相関を持っている(R2 = 0.74)ことが示された。1989 年における Ta 推定値の最小値は 20.11℃であり、最大値は 35.62℃であり、標準偏差(SD)は 5.93℃であった。2006 年では、最小値は 31.8℃、最大値は 37.6℃、標準偏差は 6.35℃であった。これらの結 果における大きな標準偏差より、この手法は、改善の余地があると考えられる。 手法を改善するために、我々は 2012 年乾季における MODIS データに単回帰と 地表面エネルギー収支(SEB)法を適用した。SR 法を MODIS データに適用した推定 値では、夜間の Ta について RMSE は 15.53℃、最大値は 22.49℃、最小値は 19.62℃であった。昼間の Ta については、RMSE は 11.69℃であり、最小値は 21.55℃ であり、最大値は(市の中心部で見られた)31.55℃であった。続いて Ta の推定におけ る誤差を低減するために、同じデータセットに SEB 法を適用した。SEB 法を MODIS データに適用した推定値では、夜間の Ta について RMSE 値は 11.36℃、最小値は 23.43℃、最大値は 25.00℃であった。昼間の Ta については、RMSE 値は 9.75°C、 最小値は 25℃であり、最大値は 30℃であった。これらの結果から、SEB 方法における バイアスが SR 方式のものよりも小さいことが示された。 最後に、ジャカルタの都市熱環境と都市化との関係を検出するために、物理的お よび社会経済的変数を組み合わせた都市生活指標を検討する。物理的な変数として Ta を使用し、社会経済的変数として、人口、電気を利用できる世帯数、貧困家庭用健 康保険を活用している世帯数、貧困家庭の認定を受けている世帯数を使用した。重 み付け分析および ArcGIS のオーバーレイ技術を活用した。MODIS データセットから 推定した平均気温(Ta)は午前 1 時を除いて、人口と密接な相関関係を示した。この 関係より、Ta と人口を結合し、環境指標として表す。低い環境指標は、夜間(36.1%)と 昼間(29.6%)の両方で都市域の内側で検出された。社会経済指標は、PODES2010 から人口データを除いた社会経済的変数を組み合わせることによって作成され、調査 地域における世帯の豊さを表す。ジャカルタで世帯数の 37.7%が居住している 45.9%の領域において、良好な社会経済指標が見られた。都市生活指標は調査地域 において環境指標と社会経済指標を合成して作成したものである。その検討を通じて、 ジャカルタの中心部は、低い環境指標と高い社会経済指標により特徴づけられた低い 都市生活指標を示すことが明らかとなった。 本研究では、地上気象測定の空間的不足を克服し、都市化を検出するために必 要な物理的なパラメータである広域での Ta を推定するために、リモートセンシングデ ータの活用が有効であることを示した。SEB 方法は、SR 方式よりも Ta を良く推定する ことが可能であり、MODIS データへの適用において良好な性能を示した。また、熱的、 社会経済的変数を組み合わせた指標が、都市生活を評価する有効な指標であること を示した。
ACKNOWLEDGEMENTS
I would like to express my deepest gratitude to the Lord for his guidance and strength. I would like to express my sincere gratitude to my supervisor Assoc. Prof. Kazuyoshi Souma for his guidance, support and encouragement throughout the course of graduate study at University of Yamanashi. I would like to thank also Prof. Tadashi Suetsugi, Assoc. Prof. Yutaka Ichikawa, Assoc. Prof. Hiroshi Ishidaira, and Assoc. Prof. Hiroshi Kobayashi for their meaningful guidance as members of supervising committee. I am grateful to Assistant Prof. Jun Magome for his suggestion during my research work here. I am also grateful to all GCOE members, staffs and colleagues for their suggestions, support and facilitation during my study here.
I owe my gratitude to many people who shared their expertise and friendship. These include Dr. Kazuhiro Kakizawa, Dr. Ichiko Inagaki, Dr. Masakazu Hashimoto, Nurul Nadia, Ayaka Watanabe, and all Suikou members. My Indonesian friends in Kofu who have been through all the happy and sad times, Dr. Ratih Indri Hapsari, Dr. Yureana Wijayanti, Dr. Risky Ayu Kristanti, Anang Faturochman, Purna Sophie, Febrina Hartanti, and Octavina Naa. I would like to thank also Prof. Suhartono, Dr. Suharyadi, Dr. Arief Kusumawanto as my supervisor in Gadjah Mada University, thank you for the online discussion. My classmate members in Gadjah Mada University, thank you for the sharing.
I am very grateful to the GCOE program of University of Yamanashi and Japanese government (MEXT scholarship) in providing me financial support during my graduate studies.
Finally, I would like to express my biggest and special gratitude to my brother and parents, Hariyadi Djamal., M. T, and Asih Priyanti who always support me in every single time. Mr. Sarjono and families, Mr. Yukihiko Sakatani and families, Mr. A. Ouchi and families, their supports are uncountable. Thank you for all my friends here that I can not mention one by one. Thank you for those who come and go in my life. You have written many stories which encourage me during my life in Japan. Thank you.
TABLE OF CONTENTS
Abstract ... i
Acknowledgment ... v
List of figures ... viii
List of tables ... x
List of abbreviations ... xi
CHAPTER 1 ... Introduction ... 1
1.1. Urban Development in Jakarta city ... 1
1.2. Literature review... 2 1.3. Study area ... 5 1.4. Objectives ... 6 1.5. Dissertation structure ... 7 References ... 8 CHAPTER 2 ... URBAN THERMAL OBSERVATION AND LAND COVER CLASSIFICATION ... 2.1. Introduction ... 11
2.2. Observation in Jakarta ... 11
2.3. Land cover classification ... 13
2.4. Result and Discussion ... 15
2.5. Summary ... 18
References ... 20
CHAPTER 3 ... AIR TEMPERATURE ESTIMATION TO DETECT THE EFFECT OF URBANIZATION USING LANDSAT DATA ... 3.1. Introduction ... 22
3.2. Air temperature trends from the 1950s to 2010 in Jakarta ... 23
3.3. Method ... 24
3.3.1. Land surface temperature (LST) retrieval method ... 24
3.3.2. Variations in LST data ... 26
3.4.1. Observed relationship between air temperature and land surface ... 28
3.5. Summary ... 31
References ... 32
CHAPTER 4 ... AIR TEMPERATURE ESTIMATION USING SIMPLE REGRESSION AND SURFACE ENERGY BALANCE METHOD IN MODIS DATA ... 4.1. Introduction ... 36
4.2. Material and Method ... 37
4.2.1. Land surface temperature (LST) in MODIS... 38
4.2.2. Air surface temperature (Ta) in MODIS ... 38
4.3. Result and Discussion ... 43
4.4. Summary ... 46
References ... 47
CHAPTER 5 ... COMPARISON BETWEEN URBAN THERMAL ENVIRONMENT AND SOCIOECONOMIC CONDITION ... 5.1. Introduction ... 50
5.2. Data and Method ... 52
5.2.1. Data ... 52
5.2.2. Method ... 52
5.3. Result and Discussion ... 57
5.3.1. The relationship between air temperature and population... 57
5.3.2. Urban socioeconomic ... 61
5.3.3. Urban environment livelihood (ULI) ... 62
5.4. Summary ... 65
References ... 66
CHAPTER 6 ... Conclusions ... 68
LIST OF FIGURES
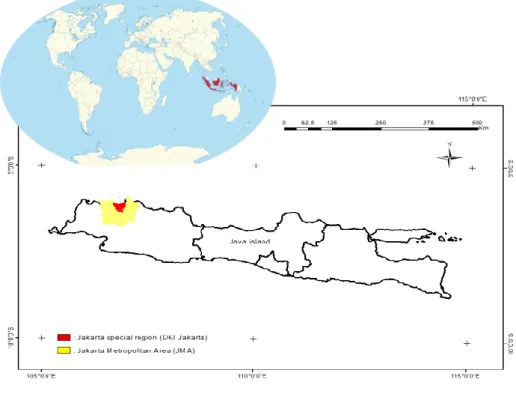
Figure 1.1. The Greater Jakarta ... 6
Figure 1.2. Dissertation structure ... 7
Figure 2.1. Fix point installation ... 12
Figure 2.2. Observation equipments at fix point ... 12
Figure 2.3. Mobile measurement equipments ... 13
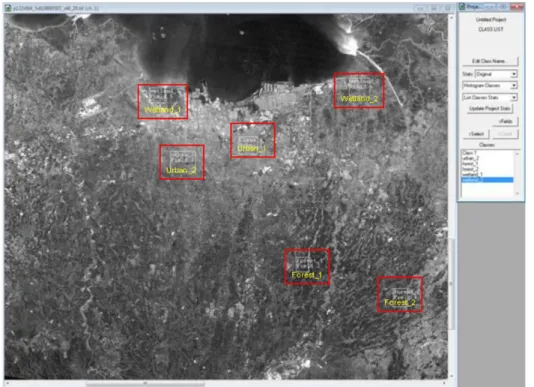
Figure 2.4. Land cover classification step using MultiSpec software ... 14
Figure 2.5. Air temperature in fix point in Jakarta city and suburban area ... 15
Figure 2.6. Relative humidity in fix point in Jakarta city and suburban area ... 15
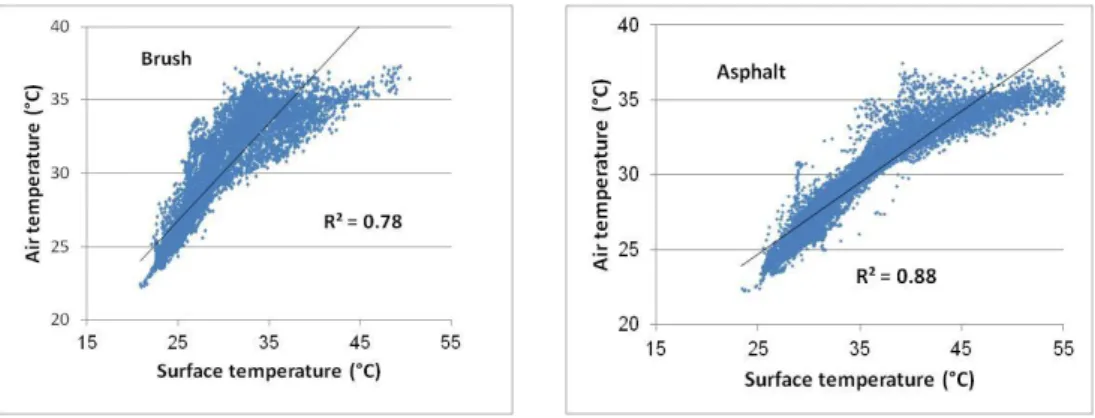
Figure 2.7. Scatter diagram between air temperature (Ta) – surface temperature (LST;TS) in Jakarta ... 16
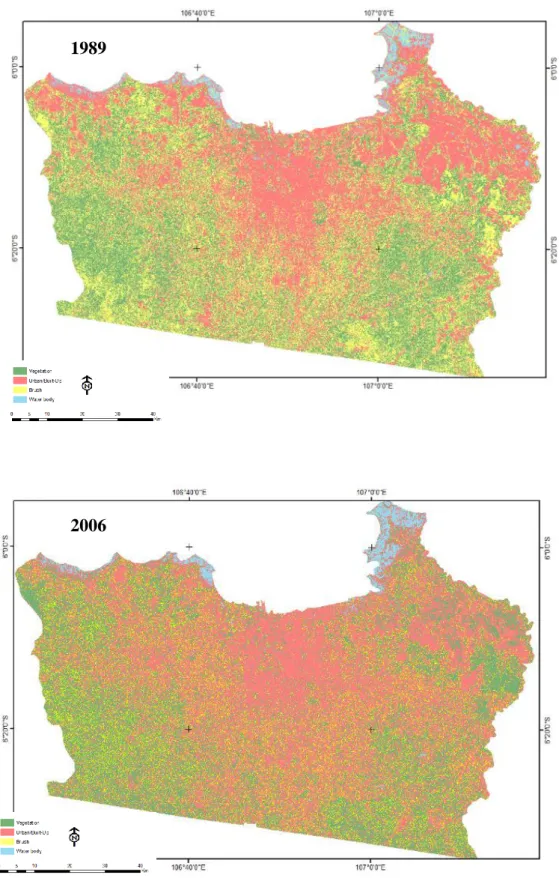
Figure 2.8. Land cover classification in 1989 and 2006 ... 17
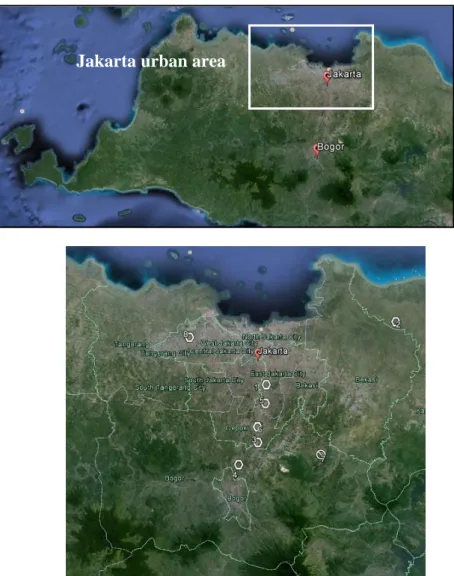
Figure 3.1. Study area in Jakarta, Indonesia, urban area ... 22
Figure 3.2. Location of ground weather station in Bogor (suburban) and Jakarta (urban) .. 23
Figure 3.3. Time series of annual averaged daily minimum, maximum, and average temperature ... 24
Figure 3.4. Spatial distribution of surface temperature (TS) at Jakarta urban area ... 27
Figure 3.5. Relationship between land surface temperature (LST) derived from satellite data and from ground based measurements ... 27
Figure 3.6. Relationship between LST and air temperature observation (Ta) in ground based observation ... 28
Figure 3.7. Scatter plot of the relationship between Ta derived from satellite data and from ground based measurements ... 29
Figure 3.8. Spatial distribution of surface temperature (Ta) at Jakarta urban area ... 30
Figure 4.1. Study area in Jakarta, Indonesia, urban area ... 37
Figure 4.2. Relation between land surface temperature (LST) derived from MODIS satellite data and from ground based measurements ... 38
Figure 4.3. Comparison between LST and air temperature observation (Ta) in ground based observation ... 39
Figure 4.4. Relationship between LST – air temperature estimation and air temperature
estimation – air temperature observation using regression method in MODIS ... 42
Figure 4.5. Relationship between LST – air temperature estimation and air temperature estimation – air temperature observation using surface energy balance method in MODIS ... 43
Figure 4.6. Spatial distribution of air temperature (Ta) at Jakarta urban area using regression method ... 44
Figure 4.7. Spatial distribution of air temperature (Ta) at Jakarta urban area using surface energy balance (SEB) method... 46
Figure 5.1. Population distribution 2010 in Greater Jakarta... 51
Figure 5.2. Histogram distribution of temperature at 1 am and 3 pm ... 54
Figure 5.3. Histogram distribution of population and family using electricity ... 55
Figure 5.4. Histogram distribution of health insurance certificate for poor family and poor family certificate ... 56
Figure 5.5. Relationship between air temperature (Ta) and population in Jakarta within hours ... 56
Figure 5.6. Averaged air temperature (Ta) and population in Jakarta within hours ... 58
Figure 5.7. Environment index in 1 AM ... 58
Figure 5.8. Environment index in 3 PM ... 59
Figure 5.9. Socioeconomic index ... 61
Figure 5.10. Urban environment livelihood index in 1 AM ... 62
LIST OF TABLES
Table 1.1. Demographic in Jakarta ... 5
Table 2.1. Land cover classification ... 18
Table 2.2. Land cover area in DKI Jakarta and West Java Province by statistic bureau ... 18
Table 3.1. Characteristic of air temperature (Ta) at selected stations ... 24
Table 3.2. Minimum, maximum, and average of Ta and TS in satellite data ... 30
Table 3.3. Comparison of air temperature (°C) between field measurement and Landsat 2006 ... 31
Table 4.1. Coefficient Cg used to calculate ground heat flux G for different surface coverage types and seasons ... 40
Table 4.2. Roughness length for different surface coverage types ... 41
Table 4.3. Root mean square error (RMSE), and coefficient correlation (R2) in MODIS ... 45
Table 5.1. Parameter of urban environmental livelihood ... 53
Table 5.2. Environment index ... 60
Table 5.3 Environment index for poor status ... 60
Table 5.4. Socioeconomic index ... 61
Table 5.5. Socioeconomic index for fair status ... 62
Table 5.6. Urban livelihood index ... 63
LIST OF ABBREVIATIONS
DHF : Dengue hemorrhagic fever. DKI : Daerah khusus ibukota. EI : Environment index. JMA : Jakarta metropolitan area. LST : Land surface temperature.
MODIS : Moderate resolution imaging spectrometer. RMSE : Root mean square error.
SI : Socioeconomic index. Ta : Air temperature. TIR : Thermal infra red. TS : Surface temperature.
WHO : World Health Organization. UHI : Urban heat island.
1
CHAPTER I
INTRODUCTION
1. 1. Urban Development in Jakarta city
Urbanization has various impacts on the urban environment. The population of Jakarta, the capital of Indonesia, was approximately 12 million in 2000 while it was only 5 million in the 1970s. In 2010, 43% of the Asia-Pacific population lived in urban areas of Jakarta (UN-ESCAPE, 2011). With the rapid population increase, the urban area also expanded rapidly within the past several decades, which may have strongly affected the local climate of the area. Jakarta’s urban fringe is growing faster than the city itself. The present Jakarta and its extended surrounding zone (Jakarta special region, Bogor, Tangerang, Bekasi) cover total 7500 km2, namely Jakarta Metropolitan Area (JMA) or Jabodetabek (Jakarta, Bogor, Tangerang, and Bekasi). JMA covered 0.33% of the national land area, it accommodates as much as 12% of Indonesia`s total population (Goldblum et al, 2000; Firman, 2009). Urbanization has significantly influence on spatial and environment development in Indonesia, particularly in urban space. Urban development in Indonesia particularly in Java island can be recognized by rapid changes of the land use and its urban centers, as well as by conversion vegetation area to built-up area. These processes can be seen clearly in large cities were mostly standing on Java island, such as Jakarta Metropolitan Area (JMA), Surabaya, Bandung, and Semarang.
Jakarta as the main city in Indonesia has faced several environmental problems related to intensive urbanization there. Jakarta has experience of flood disaster that occurs almost in every year and inundating almost whole over Jakarta city. 40% area in Jakarta is in the lowlands and influenced by tidal, crossed by 13 rivers, flooding will frequently occur when heavy rainfall is coming (Kagabu et al, 2011; Steinberg, 2007). However, the flooding in Jakarta is not only caused by natural disaster, but also human interface. Lack of carrying capacity of flood control infrastructures, reduction of the capacity of existing systems in uncontrolled garbage dumping, reduction of rain water
2
absorption due to urbanization and deforestation is the main influenced by flooding in Jakarta (Steinberg, 2007).
1. 2. Literature review
Climatic risk relating urbanization
A climatic effect caused by the urbanization is to be paid attention recently for more than half of the world are living in the urban area which expect to increase. Urban heat island (UHI) is the common phenomena that can be found during the specific heat difference of urban and rural area. UHI effect has been linked to some disease caused by the urban heat environment and socio-demographic aspect. The UHI effect has proven to be deadly in heat waves in Chicago in 1995 and Paris in 2003, where thousands of people died of heat-related illness (Aboff et al, 2010). Heat stroke caused by extreme heat wave is a severe illness clinically defined as core body temperature ≥ 40.6°C (≥105 °F), accompanied by hot, dry skin and central nervous system abnormalities, such as delirium, convulsions, or coma (Luber and McGeehin, 2008). Urbanization can treat such as ecological safety regarding to the horizontal land expansion and reducing vegetation space. Lack of vegetation space means the impervious surfaces are increasing which is altering how solar radiation is reflected, emitted, and absorbed. The lost of vegetation space is causing soil moisture and evapotranspiration decrease, resulting air temperature increase.
Environmental damage related to climatic risk also happens in Jakarta city as the research area. Dengue hemorrhagic fever (DHF) is one of the vector-based disease which are very sensitive to the climate variation (number of rainy days, solar radiation, humidity) in tropical country such as Indonesia, Thailand, Philippines, and Bangladesh (Dulay et al, 2013; Zubaidah, 2013; Tipayamongkholgul and Lisakulruk, 2011, and Karim et al, 2012). World Health Organization (WHO) stated that social and environment factors including urbanization (lack of health services for poor families), climatic variation may affect transmission, as dengue mosquitoes reproduce more quickly and bite more frequently at higher temperatures (The World Health Organization, 2003).
3
Surface temperature (TS) in in remote sensing satellite
Urban areas which covered by impervious surfaces as anthropogenic features would lead to increase in the volume, duration, and intensity of urban runoff (Voogt and Oke, 2003; Weng et al, 2004). In addition, urban surfaces would modify sensible and latent heat flux within the urban canopy and boundary layer. There are three variables which were identified to be closely correlated to local temperature variation: Land Surface Temperature (LST; TS), vegetation cover, and impervious surface percentage. The impact of urbanization on the thermal environment is generally known as urban heat effect which generates near the ground surfaces and gives result in LST anomalies (Voogt and Oke, 2003; Kataoka et al, 2009; Lazzarini et al, 2013).
Thermal infra-red remote sensing data were commonly known as a source to determine the TS from space. TS originates from the balance between absorbed solar radiation and losses through sensible heat and latent heat fluxes as well as radiant emissions which governed by moisture content, surface type, wind velocity and emissivity. It was assumed that variability of TS affects Ta particularly in clear-sky days (Voogt and Oke, 2003). TS remote sensing can contribute to provide large scale earth surface distribution temperature data and also about isolated areas, meanwhile it has limitation to calculate detail information of temperature in earth surfaces.
The LST (TS) products that used in this research are derived from Moderate Resolution Imaging Spectroradiometer (MODIS) and Landsat images. The MODIS LST (TS)is derived from two thermal infra red (TIR) band channels, 31 (10.78 – 11.28 µm) and 31 (11.77 – 12.27 µm). The MODIS sensor is aboard the Terra and Aqua platform. LST Terra data is available during day and night time around 10.30 – 12.00 a.m and p.m local time and LST Aqua around 1.00 – 3.00 a.m and p.m. We used both data to cover the research in dry season period (July – October, 2012). Regarding the process to estimate air temperature from LST (TS)products, the latest MODIS LST version, v005, was downloaded from the MODIS website. This product aims at retrieving LST with an error lower than 1°C (±0.7°C standard deviation) in the range of - 10 to 50°C, assuming that surface emmisivity is known (Benali et al, 2012). To quantitatively measure LST (TS) and estimate air temperature in the past (1989 and 2006), we selected Landsat 7 thermal data. It has spatial resolution of 30 m in bands 1–
4
5 and 7 have a spatial resolution of 30 m, and the thermal infrared band (band6) has a 60 m for Landsat 7 images.
Air temperature (Ta)
Traditionally, Ta measured at standard meteorological station in 1.5 – 2 m height above the ground and it is a key to describe energy and water cycles of the earth-atmosphere system. The spatiotemporal patterns of near- surface air temperature are complex because Ta is strongly determined by surface properties that vary in both space and time (Prihodko, and Goward, 1997). The earth-atmosphere system is balanced by the absorption of incoming solar radiation, in the shortwave part of the light spectrum, and the emission of infrared long wave radiation and the sensible and latent heat loss fluxes (Prihodko and Goward, 1997; Jin and Dickinson, 2010.; Benali et al, 2012). These processes are the main component of the Ta daily cycle. The landscape changing in urban area affects the environment and it can have a significant impact in the air temperature (Ta) as shown by both long-term analyses of ground-based measurements and analysis of satellite data.
LST (TS)and air temperature (Ta) have close correlation, but both of them have different physical meanings, magnitudes, measurement technique, response to atmospheric condition and diurnal phase (Jin and Dickinson, 2010; Benali et al, 2012). Ta information is not provided by satellite because the gap between LST (TS) and Ta rate can very greatly different in diurnal cycle, and patterns are influenced seasonally through variation in the day and night time lengths (Benali et al, 2012). During daytime Ta is lower than LST (TS)and at night time is opposite. In daytime, the energy of outgoing long wave-radiation driven by solar insolation is dominant, so LST (TS) can be detected by satellite. On the other hand, during nighttime, lack of solar insolation effect on outgoing thermal infrared and reduce the signal of LST (TS) compared with Ta.
Current Research on urban thermal environment
Previous studies have revealed many research on urban remote sensing particularly using LST (TS)as an indicator of heat island (Tursilowati et al, 2012; Rizwan et al,
5
2008; Hung et al, 2006). Other study are investigate the relationship between LST (TS) and vegetation cover (Weng et al, 2004; Chen et al, 2006), and impervious surfaces in urban area (Yuan and Bauer, 2007; Xu, 2010; Weng, 2012). However, not much study investigate LST (TS) product to calculate air temperature to detect urbanization. Commonly, moderate and low spatial scale of LST (TS) satellite products are used to reveal Ta from satellite approach, however, the effectiveness and sensitivity of each type is unclear.
1. 3. Study area
Indonesia capital city, Jakarta, become the study area of this research. Daerah Khusus Ibukota (DKI) Jakarta or Special Capital Territory of Jakarta, as known as Jakarta is the biggest city in Indonesia as an area of 662 km2. The Jakarta urban area with the core is in Jakarta city, now become extended in surrounding cities. In 2011, the world counted 23 megacities of at least 10 million inhabitants accounting for 9.9% cent of the world urban population. In 2006, the population density in the capital of Indonesia, Jakarta, is 13,526 inhabitants/km2, which is comparable with several other major cities in the world, such as Tokyo (13,333 inhabitants/km2) and New York (10,292 inhabitants/km2), respectively.
Table 1.1 Demographic in Jakarta
Jakarta Metropolitan Area Republic of Indonesia Land area (km2) 662 7,297 1,919,440 Population 9,588,198 28,019,545 238,000,000 Population density/km² 14,464 4,383.53 134
6
Figure 1. 1 The Greater Jakarta
Jakarta expanded from 180 square kilometers in 1960 to a fully urbanized megapolis in the 2000s. Today, as mega city, Jakarta`s nucleus area has spatially and economically expanded beyond its original fringes and has been integrated with four other proximate cities, namely Jakarta Metropolitan Area (JMA). In Jakarta there are existence of some 1.3 million private cars, 2.6 million motorcycles and 800,000 buses and lorries (2002 data representing a 10-fold increase since 1985) on Jakarta’s roads illustrate the amount of traffic that is circulating in Jakarta, a city which has a rather limited road space available (Steinberg, 2007).
1. 4. Objectives
The main goal of this research is detecting urbanization effect in Jakarta city from surface temperature approach. The specific objectives are as follows:
1. To assess land use distribution as an impact of urban extension in Jakarta city. 2. To assess the thermal environment during 1990s – 2000s in order to obtain land
7
3. Air temperature estimation in urban area by combining ground base meteorological data and surface temperature from remote sensing data to detect urbanization effect in Jakarta city.
4. To investigate urban development in urban area based on thermal environment condition in Jakarta city.
1. 5. Dissertation structure
Figure. 1.2 Dissertation structure
Urban thermal observation and land cover classification. Chapter 1
Chapter 2
Chapter 3
Chapter 4
Introduction
Air temperature estimation to detect the effect of urbanization using Landsat data.
Air temperature estimation using simple regression and surface energy balance method in MODIS data.
Chapter 5 Comparison between urban thermal environment and socio economic condition.
8 References
UN-ESCAPE. 2011. Statistical Yearbook for Asia and The Pacific. pp. 7–8.
National Aeronautics and Space Administration. 2011. Landsat 7 Science Data Users Handbook. p. 120.
Aboff, Amelia., et al. 2010. Trees and the urban heat island effect : a case study for providence rhode island. Center for Environmental Studies, Brown University.
Benali, A., Carvalho, A.C., Nunes, J.P., Carvalhais, N., and Santos, A. Estimating air surface temperature in Portugal using MODIS LST data. Remote Sensing of
Environment, 124 (2012), pp. 108–121.
Chen, Ling-Xiao, Zhao, Mei-Hong, Li, Xiang-Ping, Yin, Yong-Zhi. Remote sensing image-based analysis of the relationship between urban heat island and land use/cover changes. Remote Sensing of Environment 104 (2006) 133–146.
Dulay, S. Velora, Aubrey., Bautista, R. Jing., and Teves, G. Franco. Climate Change and Incidence of Dengue Fever (DF) and Dengue Hemorrhagic Fever (DHF) in Iligan City, Lanao del Norte, Philippines . International Research Journal of
Biological Sciences Vol. 2(7), 37-41, July (2013).
Firman, Tommy. The continuity and change in mega-urbanization in Indonesia: A survey of Jakarta–Bandung Region (JBR) development. Habitat International 33 (2009) 327–339.
Goldblum, C., and Wong, T.. Growth, crisis and spatial change: a study of haphazard urbanization in Jakarta, Indonesia. Land Use Policy, 17 (2000), pp. 29–37. Jin, M., and Dickinson, E.R. Land surface skin temperature climatology: benefitting
from the strengths of satellite observations. Environmental Research Letters, 5 (2010) 044004 (13 pp).
Kagabu, Makoto; Shimada, Jun; Delinom, Robert; Tsijimura, Maki; and Taniguchi, Makoto. Groundwater flow system under a rapidly urbanizing coastal city as determined by hydrogeochemistry. Journal of Asian Earth Sciences 40 (2011) 226–239.
Kataoka, K., Matsumoto, F., Ichinose, T., and Taniguchi, M. Urban warming trends in several large Asian cities over the last 100 years. Science of the Total
Environment, 407 (2009), pp. 3112– 3119.
Karim, Nazmul., Munsi, Ullah, Saif., Anwar, Nazneen, and Alam, Shah. Climatic factors influencing dengue cases in Dhaka city: a model for dengue prediction.
Indian J Med Res 136, July 2012, pp 32-39.
Lazzarini, Michele., Marpu, P.R., and Ghedira, Hosni. Temperature-land cover interactions: The inversion of urban heat islandphenomenon in desert city areas.
Remote Sensing Environment 130 (2013) 136 – 152.
Luber, George, and McGeehin, Michael. Climate Change and Extreme Heat Events.
American Journal of Preventive Medicine 2008;35(5):429 –435.
Prihodko, Lara., and Goward, N. Samuel. Estimation of air temperature from remotely sensed surface observations. Remote Sensing and Environment 60: 335 – 346 (1997).
Steinberg, Florian. Jakarta: Environmental problems and sustainability. Habitat
International 31 (2007) 354–365.
Tipayamongkholgul, Mathuros, and Lisakulruk, Sunisa. Socio-geographical factors in vulnerability to dengue in Thai villages: a spatial regression analysis.
9
The World Health Organization, 2003. Climate Change and Human Health : Risks and Responses.
Tursilowati, Laras., Tetuko, Josaphat., Kuze, Hiroaki., and Adiningsih, S. E. Relationship between Urban Heat Island Phenomenon and Land Use/Land Cover Changes in Jakarta – Indonesia. Journal of Emerging Trends in
Engineering and Applied Sciences, 3 (4): 645 – 653 (2012).
Voogt, J.A, and Oke, T.R. Thermal remote sensing of urban climates. Remote Sensing
of Environment, 86 (2003) 370–384.
Weng, Qihao. Remote sensing of impervious surfaces in the urban areas: Requirements, methods, and trends. Remote Sensing of Environment 117 (2012) 34–49.
Weng, Qiahao., Lu, Dangsheng, and Schubring, Jacqelyn. Estimation of land surface temperature–vegetation abundance relationship for urban heat island studies.
Remote Sensing of Environment 89 (2004) 467–483.
Xu, Hanqiu. Analysis of impervious surface and its impact on urban heat environment using the normalized difference impervious surface index (NDSI).
Photogrametric Engineering and Remote Sensing Vol. 76, No. 5, May 2010, pp.
557-565.
Yuan, Fei, and Bauer, E. marvin. Comparison of impervious surface area and normalized difference vegetation index as indicators of surface urban heat island effects in Landsat imagery. Remote Sensing of Environment 106 (2007) 375–386.
Zubaidah, Tien. Impacts of Climate Change on Dengue Haemorrhagic Fever Cases in Banjarbaru Municipal, South Kalimantan During the Year 2005-2010.
Indonesian Journal of Wetlands Environmental Management Volume 1,
11
CHAPTER 2
URBAN THERMAL OBSERVATION AND LAND COVER
CLASSIFICATION
2. 1. Introduction
The development activities in the fringe of JMA have been dominated by low density, non–contiguous and land intensive residential area. They have scattered across the regions and consumed large area of vegetation space including agricultural land. As a result the predominantly agricultural activities in the fringe area were transformed into industrial and service based activities (Firman, 1997). In term of its spatial pattern, based on some urban spatial indicators defines the development practice in the fringe of Jakarta as sprawl (Bertaud, 2001). Rapid development will affect the landscape, which, if it occurs in rural areas will change from vegetation area (non built up area) to built up area. The number of megacities has been increasing in Asia. A megacity is defined as a city with a population larger than 10 million. With the rapid population increase, the urban area also expanded rapidly within the past several decades, which may have strongly affected the urban land features. Jakarta’s urban fringe is growing much faster than the city itself. The change of land cover is suspected as the one which influence of thermal increases. In order to understand the distribution and present condition of those parameters, field observation was carried on in Jakarta city in September – October, 2012.
2. 2. Observation in Jakarta
There were two kinds measurement during observation period. In fix point measurement, we install the equipment in eight locations. Two equipments is in inside Jakarta (Kramatjati and Cijantung), and six equipments is in Jakarta fringe area (Bekasi, Bogor, Depok, and Tangerang). To measure the thermal environment in Jakarta urban area, we used OPTEX MI-710 as infrared thermometer, HOBO Pro v2 U23-002 as thermo hygrometer was set in 1.5 m height, and Mistral Instruments WDL-01 as aerovane was set in 2 m height in each point locations.
12
Figure 2. 1 Fix point equipments installation. is not use.
Figure 2. 2 Observation equipments at fix point
Jakarta urban area
Thermo-hygrometer
Aerovene Infrared thermometer
13
Mobile measurement was conducted to validate the surface temperature from remote sensing satellite and verify the land cover in Jakarta urban area. We selected 10 a.m – 12 a.m at local time as the same period with satellite overpass to carry out the mobile measurement. We used Fluke 568 as the portable infrared thermometer and T&D Corporation TR-77Ui as Portable thermo-hygrometer.
Figure 2. 3 Mobile measurement equipments
2. 3. Land cover classification
The objective of image classification is to categorize pixels in an image into land cover classes or themes (Lillesand., Kiefer., and Chipman, 2007). To classify the land cover in study area, Landsat TM in 1989 and Landsat ETM+ in 2006 was used. To execute the land cover classification process, supervised classification technique is chosen. There are three steps to proceed supervise classification in remote sensing image, (1) identify representative training area for each land cover types, (2) categorize
Portable infrared thermometer Portable thermo-hygrometer
14
each pixel into land cover class, (3) digitalize the result as thematic map (Lillesand., Kiefer., and Chipman, 2007).
Figure 2. 4 Land cover classification step using MultiSpec software. is the training area in image scene.
We choose maximum likelihood classifier to proceed this step. Four land cover types were classed and in each type we made 14-30 training areas depend on the land cover large area. The overall class performance is 75% and Kappa statistic for this step is 85% which that mean this result is representative enough for present land cover distribution.
15 2. 4. Result and discussion
Figure 2. 5 Air temperature in fix observation point in Jakarta city and suburban area
Figure 2. 5 shows the 24 hours air temperature and relative in Jakarta as the core city and its fringe area (Bogor, Tangerang, and Bekasi) on 29 - 30 September 2012 (dry season). As the urbanized area, Jakarta relatively has high temperature compare to other cities. At the midnight, whole cities have low temperature, and the lowest is Bogor. Bogor is located in the southern part of Jakarta and gets less influence of sea breeze from the Java seas (northern Jakarta). Opposite with Bogor site, Tangerang which is located relatively close to the sea get more influence in sea breeze. In the daytime, the temperature reached the peak level and cooling down in around 15 p.m. Here, Jakarta and Tangerang (urban) are kept on their higher temperature than Bogor and Bekasi (suburban). Urban area much slower in cooling and has stronger heat than suburban area at the nighttime, this can be identified as heat island effect.
Figure 2. 6 Relative humidity in fix observation point in Jakarta city and suburban area.
16
Lower relative humidity (RH) was occurred during the night time to early morning in the high urbanized area caused by the low vegetation evapotranspiration; while in the suburban area is higher. In the daytime, the relative humidity in whole area was decreasing caused by the high intensity of solar radiation and the sea breeze (Java sea) which carried water vapor is penetrate to the urban center. In the early evening to the midnight RH was generally increase because the solar radiation and sea breeze is become weak, but in some specific area which sited in coastal area (Tangerang and Bekasi) it seems to be high than the others. At the midnight time, RH was high in the suburban (Bogor) caused by the mountain breeze which carried water vapor was penetrate this area.
Figure 2.7 Scatter diagram between air temperature (Ta) – surface temperature (LST;TS ) in Jakarta.
Figure 2.7 shows the comparison between Ta and LST (TS)in Jakarta`s observation site. High coefficient correlation (R2) was produced in two surface types, brush and asphalt. To understand urbanization in Jakarta city and the spatial distribution of land use types, we were classifying it by using Landsat time series data which downloaded from http://glcf.umd.edu/data/. Land- use maps were governed using supervised classification based on the Maximum Likehood algorithm in Multyspec software. Land-use types were classified including vegetation, urban/built-up, brush, and water body. Landsat TM in 1989 and Landsat 7 ETM+ in 2006 were selected to produce time series land-use maps.
17
Figure 2. 8 Land cover classification in 1989 and 2006 1989
18 Table 2.1 Land cover classification
Figure 2.1 shows the land cover classification in Jakarta urbanized area in 1989 and 2006. The urbanized area was detected and recognized by the distribution of urban/built-up area surfaces in 2006. Table 2.1 shown that urban/built-up area was double increased in 2006 and it was distributed spread over from the center urban areas.
Table 2.2 Land cover area in DKI Jakarta and West Java Province by Statistic Bureau
Table 2.2 shows the land cover classification in Jakarta city in 1989 and 2006 from DKI Jakarta and West Java province statistic bureau. During a decade, built up area has increasing while non-built up area has been decreased. This result is similar as detected in satellite remote sensing classification.
2. 5. Summary
To understand the thermal environment in the Jakarta urban area, we observed and installed fixed-point temperature equipments from dry to pre-monsoon season (16 September to 18 October) in 2012. Strong thermal environment was created in urban centers where high concentration urban/built-up area was governed. At the night time, urban and suburban area have large difference in Ta, while in the early morning it become smaller. This observation data indicated that the temperature was followed by
1989 2006 Brush 1463 646 Vegetation 1536 676 Urban/Built-Up 1692 3369 Water body 85 85 Total 4776
Land cover Area (sq. km)
1989 2006 1989 2006
Built up 509 528 7,384 12,220
Non built up 141 122 27,080 22,244
Jakarta West Java
Land cover
Area (sq. km)
19
the change of surface feature. The urbanized area (northern part) faced low relative humidity during the day caused by low vegetation evapotranspiration and sea breeze penetration, while in the midnight; suburban area (southern part) has a higher relative humidity caused by the water vapor from the mountain breeze.
The high urbanized area is detected from the land cover distribution in 1989 and 2006 from the satellite image. The built-up area is not only concentrated in the urban center, but also in the southern part area. These results indicate that urbanization in Jakarta city is become wider. Through the thermal observation data, briefly urban thermal condition in Jakarta urban area was defined. These observation data also can be used to validate to validate physically based meteorological models and satellite remote sensing, and finally to analyze sustainable urban development in Jakarta.
20 References
Bertaud, Alain. The Spatial Organization of Cities: Deliberate Outcome or Unforeseen Consequence? Working Paper 2004-01. Institute of Urban and Regional Development University of California at Berkeley.
Firman, Tommy. The continuity and change in mega-urbanization in Indonesia: A survey of Jakarta–Bandung Region (JBR) development. Habitat International 33 (2009) 327–339.
Firman, T. Land Conversion and Urban Development in the Northern Region of West Java, Indonesia. Urban Studies 34(7): 1027-1046 (1997).
Lillesand, M. Thomas., Kiefer, W. Ralph., and Chipman, W. Jonathan. Remote Sensing and Image Interpretation (6th edition). John Wiley & Sons, 2007.
Steinberg, Florian. Jakarta: Environmental problems and sustainability. Habitat
International 31 (2007) 354–365.
Tokairin, Takayuki., Sofyan, Asep., and Kitada, Toshihiro. Effect of land use changes on local meteorological conditions in Jakarta, Indonesia: toward the evaluation of the thermal environment of megacities in Asia. International Journal of
Climatology 30: 1931–1941 (2010).
Tursilowati, Laras., Tetuko, Josaphat., Kuze, Hiroaki., and Adiningsih, S. E. Relationship between Urban Heat Island Phenomenon and Land Use/Land Cover Changes in Jakarta – Indonesia. Journal of Emerging Trends in
22
CHAPTER 3
AIR
TEMPERATURE
ESTIMATION
FROM
SATELLITE
REMOTE
SENSING
TO
DETECT
THE
EFFECT
OF
URBANIZATION USING LANDSAT DATA
3. 1. IntroductionUrbanization is defined as higher proportion of urban population, is growing rapidly in Indonesia, particularly in large cities such as Jakarta. Java, overwhelmingly the most populated island, is 65% urbanized with an urban population of 78 million. In 2025, the country is expected to be 61% urbanized with an urban population of 167 million people (The World Bank, 2002). Jakarta is the dominant city, capital, and an extended urban region of approximately 17 million people.
Numerous studies have indicated that urban expansion has caused localized increases in the air temperature (Ta) as shown by both long-term analysis of ground-based measurements (Goldblum and Wong, 2000; Kataoka et al, 2000) and analysis of satellite data (Jiang, and Tian, 2007; Rizwan, Leung, and Liu, 2008; Tursilowati et al., 2012). Heat islands degrade residential environments and increase the risk of heat-related illnesses and dengue; thus, temperature monitoring is an important issue. However, monitoring heat-island temperatures has proven to be difficult, requiring a dense network of observation sites to record Ta in various locales. As such, several studies have investigated the use of the land surface temperature (LST; TS) readings derived from satellite data as an indicator of heat islands.
23
Thermal infra-red remote sensing data was commonly known as a source to determine the TS from space. TS originates from the balance between absorbed solar radiation and losses through sensible heat and latent heat fluxes as well as radiant emissions which governed by moisture content, surface type, wind velocity and emissivity. It was assumed that variability of the TS affects Ta particularly in clear-sky days (Voogt and Oke, 2003). The objective of our study is to demonstrate the feasibility of Landsat TS product as a source for calculating spatial distribution of Ta to detect urbanization effect in Jakarta city.
3. 2. Air temperature (Ta) trends from the 1950s to 2010 in Jakarta
The daily average Ta time series was provided by the National Climatic Data Center (NCDC). Two stations were selected for the comparison of urban (Jakarta) and suburban (Bogor) areas. Ta, the near-surface air temperature, was measured 1.5–2 m above the ground, coinciding with weather station readings. Halim Perdanakusuma Airport or Jakarta Airport (the urban site) is located at S6°15'0", E106°54'0"; Atang Sanjaya (the suburban site) is located at S6°54'0", E106°32'60".
Figure 3. 2. Location of ground weather station in Bogor (suburban) and Jakarta (urban)
24
Figure 3. 3. Time series of annual averaged daily minimum, maximum, and average temperature in (a) Jakarta (the urban area near Halim Perdanakusuma Airport) and (b) Bogor (the suburban area of Atang Sanjaya).
Figure 2. 2 shows the time series of 1-year averaged daily minimum, maximum, and average Ta in Jakarta (Halim Perdanakusuma Airport) and Bogor (Atang Sanjaya) during 1980–2010. The trend shows that the average and minimum Ta during the 1980s to 2000s increased in Jakarta, while the maximum Ta decreased. In comparison, the Bogor station showed a decreasing average, minimum, and maximum Ta over the same period. Table 3. 1 shows the 10-year average daily Ta obtained from the Jakarta and Bogor stations. The daily average Ta increased over the 10-year period in Jakarta, and remained unchanged over the same time period for Bogor.
Table 3. 1. Characteristics of air temperature (Ta) at selected stations.
3. 3. Method
3. 3. 1. Land surface temperature (LST) retrieval method
Changes in the urban thermal environment resulting from urbanization should influence the LST, which is governed by land surface–atmosphere interactions and energy fluctuations between the atmosphere and the ground (Benali et al, 2012; Jim and Dickinson, 2010; Mildrexler, Zhao, and Running, 2005). LST can be used for remote-sensing thermal radiance measurements (Mildrexler, Zhao, and Running, 2005).
b a
Jakarta observation Citeko Bogor
1991 - 2000 28.02 21.82
2001 - 2010 28.13 21.66
Average (°C) Year
25
To determine the LST trends in Jakarta, daily Landsat time-series data were used. Ground-based measurements of LST were also obtained for comparison. Past Landsat data has thermal information offsets when it compared to present condition, then, to get actual absolute value ground-based LST measurement was needed.
Landsat thermal data using the thermal infrared (TIR) band can be used to determine the surface temperature (TS) because the daytime satellite provides LST values that are much closer to the maximum daily temperature of the land surface, where the diurnal highest thermal response reflection occurs with respect to vegetation and dry surfaces (Mildrexler, Zhao, and Running, 2005; Coops, Duro, Wulder, and Han, 2007). In this research, Landsat TM/ETM series data, acquired in May 1989 and July 2006, were used to investigate the urban thermal environment. This time series was chosen due to the absence of clouds over Jakarta. The procedure used to retrieve TS was based on the Landsat 7 Science Data Users Handbook (Landsat User Handbook, 2011).
The satellite image, DN, must first be converted to a spectral radiance value, L, as follows:
L = (LMAX - LMIN)/255 ×DN + LMIN, (1) where DN is the digital number reading, and LMAX, LMIN are derived from the gain status indicated by the satellite image header file. The spectral radiance value is then converted into a brightness temperature for the satellite sensor (Tb) using Eq. (2):
(2)
where Tb is the effective satellite temperature in absolute temperature, K1 and K2 are
calibration constants for the Landsat TM/ETM+ system, and L is the spectral radiance in W m−2 sr−1µm. K1 was set to 607.76, and K2 was set to 1260.56 (Landsat User
Handbook, 2011). The brightness temperature was determined by applying blackbody principles. Surface emissivity was considered in the estimation of TS for the targets
Tb =
𝐾2 ln(𝐾1
26
(Sobrino, Jimenez-Munoz, and Leonardo, 2003; Voogt and Oke, 2003; Tursilowati et al., 2012).
𝑇𝑆 = 𝑇𝑏
1 + 𝜆 × 𝑇𝑏/𝜌 𝑙𝑛𝜀
(3) where TS indicates the LST in absolute temperature, λ is the wavelength of the radiance emitted (λ = 11.5 µm), ρ = (h × c) / σ = 1.438 ×10⁻² (m K) , h is Planck`s constant (6.626 × 10- 34 Js), c is the velocity of light (2.998 × 10⁸ m/s), σ is the Boltzmann constant (1.38 ×10⁻²³ J/K), and ε is the composite emissivity. In this study, ε = 0.97 was used for the soil and vegetation (Sobrino, Jimenez-Munoz, and Leonardo, 2003).
3. 3. 2. Variations in LST data
Figures 3. 4 (a) and (b) show the spatial distribution of the LST in the Jakarta urban area, derived from Landsat TM data obtained on 3 May 1989 and from TM data on 5 July 2006. A comparison with ground-based measurements was used to validate the estimated TS values. The observation was carried out during 18–26 September 2012 at the same local standard time (10:00) at 35 sample points and with one point for the ground control measurement, located in the central urban site.
(b) LST in 1989
28.54 degC
27
Figure 3. 4. Spatial distribution of surface temperature (TS) a Jakarta urban area in (a) 1989 and (b) 2006.
Figure 3. 5. Relationship between land-surface temperatures (LSTs) derived from satellite data and from ground-based measurements.
Strong correlation was observed between the estimated LST using Landsat data and ground measurements. The determination coefficient (R2) was 0.8; thus, the LST
(a) LST in 2006
31.78 degC
15.04 degC : Cloud
28
estimated by Landsat data provided a good representation of the actual LST in Jakarta (Mao, Qin, and Gong, 2005; Tursilowati et al., 2012). The LST was corrected based on regression relationships between the LST estimated by Landsat data and ground-based observations. The corrected LST distributions are shown in Fig 3.4. The comparison of results for 1989 and 2006 shows that the high-LST area had clearly expanded beyond the city center, as indicated by the 2006 data.
3. 4. Result and Discussion
3. 4. 1 Observed relationship between air temperature (Ta) and land surface
temperature (LST)
To confirm the relationship between near-surface Ta and LST, ground-based measurements were carried out in Jakarta from 18 to 26 September 2012 at the same local standard time as that satellite images (10:00-12.00).
Figure 3. 6. Relationship between LST and air temperature (Ta) in ground-based observations.
Figure 3. 6 shows a scatter plot of the relationship between ground-based measurements of Ta and LST. The regression relationship was obtained by comparing Ta and LST. The determination coefficient (R2) was 0.74, and it was also confirmed that the LST can be used as an indicator of Ta.
29
Figure 3. 7. Scatter plot of the relationship between Ta derived from satellite data and from ground-based measurements.
(b) Ta in 1989
35.62 degC
30
Figure 3. 8. Spatial distribution of air temperature (Ta) at Jakarta urban area in (a) 1989 and (b) 2006.
Figure 3.7 shows the relationship between Ta in ground-based measurements and that estimated by satellite-derived LST in 2006 to each corresponding pixel. The values show the deviations after being reduced from their initial values. A high R2 coefficient (R2 = 0.80) was determined in regression between Ta observation - Ta estimation 2006 with the RMSE is 1.80°C. To understand the Ta spatial distribution in 1989, the equation was applied on 1989`s satellite. Figure 3.8 shows the Ta spatial distribution in both years. On 1989 satellite, the minimum is 20.11 °C, maximum is 35.62 °C, and standard deviation is 5.93 °C. On 2006 satellite, the minimum is 31.8 °C, maximum is 37.6 °C, and standard deviation is 6.35 °C.
Table 3. 2. Minimum, maximum, and average of Ta and TS in satellite data (a) Ta in 2006
37.6 degC
31.8 degC : Cloud
Minimum
Maximum
Minimum
Maximum
1989
20.11
35.62
16.39
28.54
2006
31.8
37.6
15.04
31.78
31
Nearly, all TS were lower temperature in each data than the Ta. Differences between TS and Ta tended to be larger in lower temperature. The large difference of average air temperature is also detected in each data satellite, it can be caused of air temperature is created in near surface of the earth and get large influence from surrounding area.
Table 3. 3. Comparison of air temperature (°C) between field measurement and Landsat 2006
Table 2. 3 is the comparison of air temperature between field measurement and Landsat 2006 in some corresponding pixels. 2006 data were chosen because those data is relatively close to the observation time. The difference between observation and satellite based varied locally by 2 – 6°C around noon. Our study is emphasizing on the affectivity of Landsat TS to estimate Ta and neglected the land use or topographic aspects.
In this study, the application of Landsat imagery for estimating LST and Ta in Jakarta, Indonesia, using the observed relationship between TS and Ta, was investigated. The results showed a strong correlation between Landsat TS and ground-based TS measurements in both years indicating that the Landsat TS value provides a reliable representation of the actual LST. The range of determination coefficient (R2) between Ta and LST in ground-based measurements was 0.74. Therefore, LST can be used as an indicator of Ta.
3. 5. Summary
LST product from Landsat 1989 and 2006 satellite was used in this research. Ta estimated from satellites tended to be higher than ground-based measurements, the use of satellite remote-sensing data can be used to overcome the spatial problem of
Latitude Longitude Urban land cover Landsat 2006 (°C) Observation 2012 (°C) Difference
6°22'07.7" 106°49'40.7" Built up area 26.41 31.9 5.49 6°19'51.7" 106°49'46" Built up area 26.41 31.6 5.19 6°21'18.6" 106°50'05.4" Asphalt 25.99 29.7 3.71 6°27'46.5" 106°51'22.3" Asphalt 25.14 27.6 2.46 6°12'31.7" 106°48'32.6" Vegetation 26.83 32.9 6.07 6°10'46.4" 106°49'32.0" Vegetation 26.83 32.1 5.27
32
estimating Ta, particularly in areas with low station density, using satellite-based LST estimations and the ground-based relationship between LST and Ta.
33 References
Benali, A., Carvalho, A.C., Nunes, J.P., Carvalhais, N., and Santos, A. Estimating air surface temperature in Portugal using MODIS LST data. Remote Sensing of
Environment, 124 (2012), pp. 108–121.
Coops, C.N., Duro, C.D., Wulder, A.M., and Han, T. Estimating afternoon MODIS land surface temperatures (LST) based on morning MODIS overpass, location, and elevation information for Canada. International Journal of Remote Sensing, 28 (2007), pp. 2391–2396.
Goldblum, C., and Wong, T.. Growth, crisis and spatial change: a study of haphazard urbanization in Jakarta, Indonesia. Land Use Policy, 17 (2000), pp. 29–37. Jiang, J. and Tian, G. Analysis of the impact of land use/land cover change on land
surface temperature with remote sensing. Procedia Environmental Sciences, 2
(2010), pp. 571–575.
Jin, M., and Dickinson, E.R. Land surface skin temperature climatology: benefitting
from the strengths of satellite observations. Environmental Research Letters, 5 (2010) 044004 (13 pp).
Kataoka, K., Matsumoto, F., Ichinose, T., and Taniguchi, M. Urban warming trends in several large Asian cities over the last 100 years. Science of the Total
Environment, 407 (2009), pp. 3112– 3119.
Mao, K., Qin, Z., and Gong, P. A practical split-window algorithm for retrieving land-surface temperature from MODIS data. International Journal of Remote
Sensing, Vol. 26 (2005) No. 15, pp. 3181–3204.
Landsat 7 Science DataUsers Handbook. 2011. National Aeronautics and Space Administration. pp 53 – 120.
Mildrexler, J.D., Zhao, M., and Running, W.S. A global comparison between station air temperatures and MODIS land surface temperatures reveals the cooling role of forests. Journal of Geophysical Research, 116 (2011) GO3025.
Rizwan, A. Memon, D., Leung Y.C., and Liu, C. A review on the generation, determination and mitigation of urban heat island. Journal of Environmental
Sciences, 20 (2008), pp. 120–128.
Sobrino, A.J., Jimenez-Munoz, C.J., and Leonardo, P. Surface temperature and water vapour retrieval from MODIS data. International Journal of Remote Sensing, Vol. 24 (2003), No. 24, 5161-5182.
The World Bank, 2002. Urbanization Dynamics and Policy Frameworks in Developing East Asia East Asia Infrastructure Department.
http://siteresources.worldbank.org/INTEAPREGTOPURBDEV/Resources/Phil ippines-Urbanisation.pdfDownloaded, 25 March 2014.
Tursilowati, Laras., Tetuko, Josaphat., Kuze, Hiroaki., and Adiningsih, S. E. Relationship between Urban Heat Island Phenomenon and Land Use/Land Cover Changes in Jakarta – Indonesia. Journal of Emerging Trends in
Engineering and Applied Sciences, 3 (4) 2012: 645 – 653.
Voogt, J.A, and Oke, T.R. Thermal remote sensing of urban climates. Remote Sensing
of Environment, 86 (2003) 370–384.
Weng, Qiahao., Lu, Dangsheng, and Schubring, Jacqelyn. Estimation of land surface temperature–vegetation abundance relationship for urban heat island studies.
34
Wubet, Tsehaye, Michael. Estimation of absolute surface temperature by satellite remote sensing. Thesis of International Institute for Geo-information and Earth