Influence of Cations and Concentrations on the
Morphology of Gypsum Crystals
著者
TOMITA Katsutoshi, KUWAHARA Aki, KAWANO
Motoharu
journal or
publication title
鹿児島大学理学部紀要=Reports of the Faculty of
Science, Kagoshima University
volume
31
page range
57-65
Influence of Cations and Concentrations on the
Morphology of Gypsum Crystals
著者
TOMITA Katsutoshi, KUWAHARA Aki, KAWANO
Motoharu
journal or
publication title
鹿児島大学理学部紀要=Reports of the Faculty of
Science, Kagoshima University
volume
31
page range
57-65
Rep. Fac. Sci., Kagoshima Univ. No. 31, 57-65, 1998.
Influence of Cations and Concentrations on the
Morphology of Gypsum Crystals
Katsutoshi TOMITAO, Aki KuwAHARA- and Motoharu KAWANO2
(Received August 21, 1998)
Keywords : Gypsum, Cation, Concentration, Morphology.
Abstract
Influences of various cations and concentrations of solutions on morphology changes of formed gypsum crystals in the solution were investigated.
Noting the influence of cations under equable concentration condition, the following evidences were clarified: ( 1 ) formed crystal sizes and aggregation conditions displayed dependence on cations, and (2) lengths of edges and angles of apexes also depicted dependency on cations. Noting the influence of concentrations, the following results were observed with increasing the concentrations: ( 1 ) crystal sizes decreased, (2) crystals having ( 1 1 1 ) plane increased, (3) crystal aggregates changed, and (4) plate-like crystals (including twin crystals) decreased.
Introduction
When crystals grow, the morphology is affected
by the conditions of forming crystals. With regard to
gypsum, several papers have been published (Kastner, 1970; Lindberg and Smith, 1973; Grattan-Bellow, 1975; Rodgers and Courtney, 1988; Rinaudo and Franchini-Angela, 1989). With regard to the morphology of gypsum, Rinaudo and Franchmi-Angela ( 1989) reported that gypsum crystals form mechanical twins due to the existence of cations during the crystal growth. Gypsum is often found on the surfaces of wet volcanic ashes spewed from the Sakurauma volcano, and the shapes of the gypsum crystals assume many varieties. Tomita et al. ( 1985) showed the formation of different morphology of gypsum after wetting volcanic ashes from Sakurajima volcano. The morphology change is due to the different amount of SO2 and/or H2S and different cations contained in the volcanic ashes. The
purpose of this paper is to estimate the kinds of cations attached on the surface of volcanic ashes by checking the shape of gypsum crystals formed on the surface of volcanic ashes.
Experimental Method
Each lOml of solution containing chemical rea-gents of Na2S04, MgS04, K2S04, FeS04, and Al2 (SO4)3 were respectively mixed with 50ml of CaCl2 solution, and left the mixed solution for a certain period of times after stirring. After the reaction took place, the reaction products were washed with distilled water several times, then dried in air. The dried samples were observed with scan-ning electron microscope. Some samples were investigated by X-ray diffraction method (XRD), differential thermal analyser (DTA), scanning elec-tron microscope (SEM) and energy dispersive X-ray (EDX). For EDX, a HITACHI S-4000 FESEM scan-ning electron microscope equipped EDX facilities
Department of Earth and Environmental Sciences, Faculty of Science, Kagoshima University,ト2ト35 Korimoto, Kagoshima
890-0065, Japan.
Department of Environmental Sciences and Technology, Faculty of Agriculture, Kagoshima University,ト2ト24 Konmoto, Kagoshima 890-0065, Japan.
58 Katsutoshi Tomita, Aki Kuwahara and Motoharu Kawano
was used.
Results
Influence of kind of cations concentration
Experimental conditions and products for Na2S04,
Table 1. Experimental conditions and products
R un N o. N a2SO 4 C a C L R ea ctio n P rod u cts M o l M o l T im e 0 50 5 N a 0●5 0■5 30 m G 0 5 10 N a 1●0 0●5 30 m G 0 5 15 N a 1●5 0●5 30 m G 0 5 20 N a 2●0 0●5 30 m G 0 5 25 N a 2●5 0●5 30 m G 0 5 30 N a 3●0 0 ●5 30 m G 10 05 N a 0●5 1●0 30 m G lO lO N a 1■0 1●0 30 m G 10 15 N a 1●5 1●0 30 m G 10 20 N a 2●0 1●0 30 m G 10 25 N a 2 ●5 1●0 30 m G 10 30 N a 3 ●0 1●0 30 m G 15 05 N a 0 ●5 1●5 30 m G 15 10 N a 1■0 1■5 30 m G 15 15 N a 1●5 1●5 3 0m G 15 20 N a 2 ●0 1●5 3 0m G 15 25 N a 2 ●5 1●5 3 0m G 15 30 N a 3 ●0 1●5 3 0m G 20 05 N a 0 ●5 2 ●0 3 0m G 20 10 N a 1●0 2 ●0 3 0m G 20 15 N a 1●5 2 ■0 3 0m G 20 20 N a 2 ●0 2 ■0 3 0m G 20 2 5N a 2 ●5 2 ●0 3 0m G 20 30 N a 3 ■0 2 ●0 3 0m G 25 05 N a 0 ●5 2 ■5 3 0m G 25 10 N a 1■0 2 ●5 3 0m G 25 15 N a 1●5 2 ●5 3 0m G 25 2 0N a 2 ●0 2 ●5 3 0m G 25 25 N a 2 ●5 2 ●5 3 0m G 25 3 0N a 3 ●0 2●5 3 0m G 30 0 5N a 0 ■5 3 ●0 3 0m G 30 10N a 1●0 3■0 3 0m G 30 15N a 1●5 3 ●0 3 0m G 30 2 0N a 2●0 3●0 3 0m G 30 2 5N a 2 ●5 3●0 3 0m G 30 3 0N a 3●0 3■0 3 0m G O lO lN a 0 ●1 0 ■1 4 3 h G 0 20 2N a 0●2 0■2 4 3 h G 03 0 3N a 0 ●3 0■3 4 3 h G 04 04 N a 0■4 0●4 4 3 h G 05 0 5N a -4 3 0●5 0●5 4 3 h G 0 52 0N a -4 3 2●0 0●5 43 h G 10 0 5N a -4 3 0■5 1■0 4 3 h G 1 02 0N a -4 3 2●0 1●0 43 h G 15 0 5N a -4 3 0●5 1●5 4 3 h G 15 2 0N a -4 3 2●0 2●0 43 h G
m:minutes, h:hours, Grgypsum
MgS04, K2S04, FeS04, and A12SO4 are listed in Table
1, 2, 3, 4 and 5 respectively. Gypsum is always
formed from the mixed solutions except from mixed
solutions of low concentrations of Na2S04 and
CaCl2, and of MgSO4 and CaCl2. X-ray diffraction
patterns of the representative products are shown in
Table 2. Experimental conditions and products
R u n N o. M g S O 4 C aC L R eactio n P ro d u cts (M o l (M ol T im e 05 0 5M s 0●5 0 ●5 3 0 m G 05 10M g 1●0 0 ●5 3 0 m G 05 15M e 1●5 0 ■5 3 0m G 05 2 0M g 2●0 0 ■5 3 0m G 05 2 5M g 2●5 0 ●5 3 0m G 0 53 0M s 3●0 0 ■5 3 0m G 10 0 5M s 0●5 1●0 3 0m G lO lOM g 1●0 1●0 3 0m G 10 15M g 1●5 1●0 3 0m G 10 2 0M g 2●0 1■0 3 0m G 10 2 5M g 2●5 1●0 3 0m G 10 3 0M s 3●0 1●0 3 0m G 1 50 5M g 0●5 1●5 3 0m G 15 1OM s 1■0 1●5 3 0m G 1 5 15M s 1■5 1●5 3 0m G 15 2 OM s 2●0 1●5 3 0m G 152 5M g 2●5 1●5 3 0m G 15 3 0M g 3■0 1●5 3 0m G 2 00 5M g 0●5 2■0 3 0m G 20 10M e 1■0 2●0 3 0m G 20 15M e 1■5 2●0 3 0m G 20 2 0M e 2●0 2●0 3 0m G 20 2 5M s 2●5 2●0 3 0m G 20 3 0M g 3 ■0 2●0 3 0m G 25 0 5M g 0 ●5 2●5 30 m G 25 10M g 1●0 2●5 3 0m G 25 15M g 1●5 2●5 30 m G 25 2 0M g 2 ■0 2●5 3 0m G 25 2 5M e 2 ●5 2●5 30 m G 25 3 OM s 3 ●0 2●5 30 m G 30 0 5M g 0 ■5 3●0 30 m G 30 10M g 1●0 3■0 30 m G 30 15M e 1■5 3●0 30 m G 30 2 0M e 2 ●0 3●0 30 m G 30 2 5M s 2 ●5 3 ●0 30 m G 30 3 0M e 3 ■0 3■0 30 m G O lO lM e 0 ●1 0 ■1 43 h G 02 0 2M fi 0 ●2 0 ●2 4 3h G 03 0 3M e 0 ●3 0 ●3 43 h G 04 04 M g 0 ■4 0 ●4 43 h G 05 0 5M S -4 3 0 ●5 0 ●5 43 h G 05 2 0M s -4 3 2 ■0 0 ●5 43 h G 10 0 5M g ●4 3 0 ■5 1●0 4 3 h G 10 2 0M g -4 3 2 ■0 1●0 43 h G 15 05 M S -4 3 0●5 1●5 4 3 h G 15 2 0M & -4 3 2 ■0 2 ●0 4 3 h G
Influence of Cations and Concentrations on the Morphology of Gypsum Crystals 59
Table 3. Experimental conditions and products
R u n N o . K 2SO 4 C aC L R eaction P rod u c ts (M o l M o l) T im e 05 05 K 0●5 0 ●5 3 0m G 05 10 K 1●0 0 ●5 3 0m G 10 05 K 0●5 1●0 3 0 m G 10 10 K 1●0 1■0 3 0m G 15 05 K 0●5 1●5 3 0 m G 15 10 K 1●0 1●5 3 0 m G 20 05 K 0 ●5 2●0 30 m G 20 10 K 1●0 2●0 30 m G 25 05 K 0 ●5 2●5 30 m G 25 10 K 1■0 2●5 30 m G 30 0 5K 0 ●5 3●0 30 m G 30 10K 1●0 3●0 30 m G O IO IK 0 ●1 0■1 4 3h G 0 20 2K 0 ●2 0●2 4 3h G 0 30 3K 0 ●3 0●3 4 3h G 04 04 K 0 ■4 0●4 4 3h G 0 50 5K -4 3 0 ●5 0●5 4 3h G 100 5K -4 3 0 ●5 1●0 4 3h G 150 5K -4 3 0 ●5 1●5 4 3h G
m:minutes, h:hours, G:gypsum
Table 5. Experimental conditions and products
R u n N o. A l2 S0 4 3 C aC l2 R e actio n P rod u cts (M ol) (M o l) T im e 0 50 5 A 1 0●5 0●5 30 m G 0 5 10 A 1●0 0●5 30 m G 100 5 A 1 0●5 1●0 30 m G 10 10 A 1 1●0 1●0 30 m G 150 5 A 1 0●5 1●5 30 m G 15 10A 1 1●0 1.5 30 m G 2 00 5 A 0●5 2■0 30 m G 2 0 10 A 1●0 2■0 30 m G 2 50 5 A 1 0●5 2●5 30 m G 3 00 5 A 0●5 3●0 30 m G O lO lA l 0●1 0●1 4 3h G 0 20 2 A 0●2 0.2 4 3h G 0 30 3 A 1 0●3 0■3 4 3h G 0 40 4 A 0●4 0■4 4 3h G 0 50 5A 1-4 3 0●5 0●5 4 3h G 100 5 A 1-4 3 0●5 1●0 4 3h G 150 5A 1-4 3 0●5 1●5 4 3h G
m:minutes, h:hours, Gigypsum
Table 4. Experimental conditions and products
R u n N o . F eS O 4 C aC L R e actio n P ro d u cts M o l M ol T im e 0 5 05 F e 0■5 0 ●5 30 m G 0 5 10 F e 1■0 0 ■5 30 m G 0 5 15 F e 1●5 0 ●5 30 m G 0 5 20 F e 2●0 0 ●5 30 m G 0 5 25 F e 2●5 0 ●5 30 m G 0 5 30 F e 3●0 0 ●5 30 m G lO OB F e 0●5 1●0 30 m G lO lO F e 1●0 1■0 30 m G 10 15 F e 1■5 1■0 30 m G 10 20 F e 2●0 1●0 30 m G 10 25 F e 2 ●5 1●0 30 m G 10 30 F e 3 ■0 1●0 30 m G 15 05 F e 0 ■5 1●5 30 m G 15 10 F e 1●0 1●5 30 m G 15 15 F e 1●5 1■5 30 m G 15 20 F e 2 ●0 1■5 30 m G 15 25 F e 2 ●5 1●5 30 m G 15 30 F e 3 ●0 1●5 30 m G 2 0 05 F e 0 ●5 2■0 30 m G 2 0 10 F e 1●0 2■0 30 m G 2 0 15 F e 1●5 2●0 30 m G 2 0 20 F e 2 ●0 2■0 30 m G 2 0 25 F e 2 ●5 2■0 30 m G 2 0 30 F e 3 ●0 2●0 30 m G 2 5 05 F e 0 ●5 2■5 30 m G 2 5 10 F e 1●0 2●5 30 m G 2 5 15 F e 1●5 2●5 30 m G 2 5 20 F e 2 .0 2●5 30 m G 2 5 25 F e 2 ●5 2●5 30 m G 2 53 0 F e 3 ●0 2●5 3 0 m G 3 00 5 F e 0 ■5 3●0 3 0 m G 3 0 10 F e 1●0 3●0 3 0 m G 3 0 15 F e 1●5 3■0 3 0 m G 3 02 0 F e 2 ●0 3●0 3 0 m G 3 02 5 F e 2 ●5 3●0 3 0 m G 3 03 0 F e 3 ●0 3●0 3 0 m G O lO lF e 0 ■1 0 ●1 4 3 h G 0 20 2 F e 0 ●2 0 ●2 4 3 h G 0 30 3 F e 0 ●3 0 ■3 4 3 h G 0 40 4F e 0●4 0 ●4 4 3 h G 0 50 5F e -4 3 0●5 0 ■5 4 3 h G 0 52 0F e -4 3 2■0 0 ●5 4 3 h G 100 5F e -4 3 0●5 1●0 4 3 h G 102 0F e -4 3 2●0 1●0 4 3 h G 150 5F e -4 3 0●5 1●5 4 3 h G 152 0F e -4 3 2●0 2 ■0 4 3 h G
60 Katsutoshi Tomita, Aki Kuwahara and Motoharu Kawano
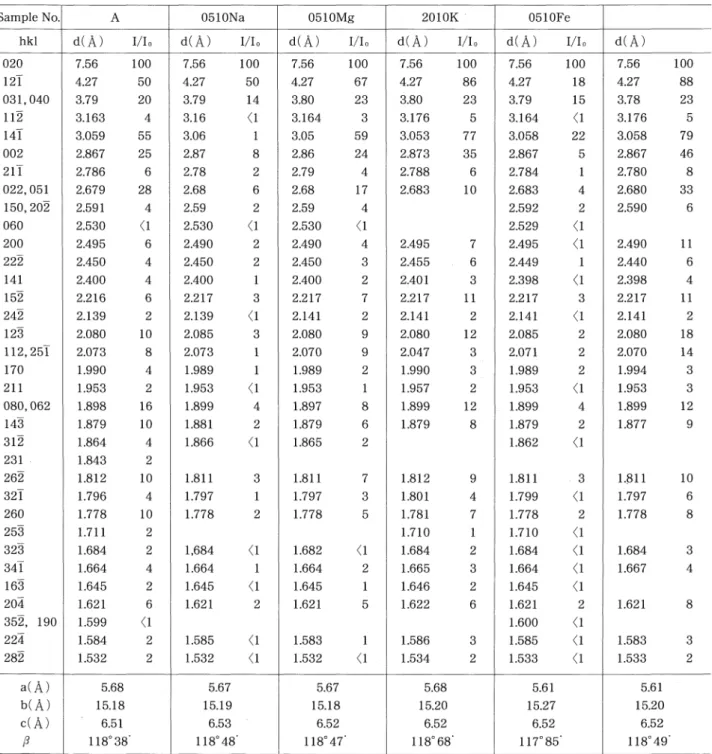
Table 6. X-ray powder diffraction data for gypsums
S am p le N o. A 0 5 10 N a 0 5 10M e 20 10K 0 5 10 F e
h kl d (A I/Ic d (Å I/Io d (A I/Ic d (Å I/Io d (A I/Io d (A ) 02 0 7 .5 6 10 0 7 .5 6 10 0 7.56 10 0 7 .5 6 1 00 7 .5 6 10 0 7.56 100 127 4 .2 7 5 0 4 .2 7 5 0 4.27 67 4 .2 7 8 6 4 .2 7 18 4 .27 03 1,0 4 0 3 .79 2 0 3 .79 14 3.8 0 2 3 3 .8 0 2 3 3 .7 9 15 3.78 2 3 1 1豆 3 .16 3 3 .16 〈1 3.164 3 .17 6 3 .164 〈1 3.17 6 147 3 .05 9 5 5 3 .0 6 3.0 5 5 9 3 .0 5 3 7 7 3.0 58 2 2 3 .05 8 7 9 00 2 2.86 7 2 5 2 .87 2.8 6 24 2 .8 7 3 3 5 2 .8 6 7 2.86 7 4 6 2 1了■ 2.78 6 2 .78 2.7 9 2 .78 8 2 .7 84 2.78 0 02 2 ,0 5 1 2.67 9 2 8 2 .68 2.6 8 17 2 .68 3 10 2 .4 9 5 2.6 83 2 .68 0 3 3 150 ,20 2 2.59 1 2.59 2.5 9 2 .5 9 2 2.59 0 2.49 0 1 1 0 60 2.53 0 〈1 2.53 0 〈1 2.5 30 〈1 2.5 2 9 〈1 2 00 2.49 5 2.49 0 2 .4 90 2 .4 95 〈1 2 2ラ 2.4 50 2.45 0 2 .4 5 0 2 .4 5 5 2 .4 4 9 2.44 0 14 1 2.4 00 2.40 0 2 .4 0 0 2 .4 0 1 2.3 98 〈1 2 .39 8 15雪 2.2 16 2.2 17 2 .2 17 2 ○2 17 1 1 2 .2 17 2.2 17 1 1 2 4ラ 2.139 2.13 9 〈1 2 .14 1 2 .14 1 2.14 1 〈1 2 .14 1 12ラ 2.0 80 10 2.08 5 2 .0 8 0 2 .08 0 12 2.0 85 2 .08 0 18 112 ,2 5 1 2 .0 7 3 2.0 73 2 .0 7 0 2.04 7 2 .0 7 1 2 .07 0 14 170 1.9 90 1.9 89 1.98 9 1.99 0 1.9 8 9 1.99 4 2 1 1 1.9 53 1.9 53 〈1 1.95 3 1.95 7 1.9 53 〈1 1.95 3 0 80 ,0 62 1.8 9 8 16 1.8 99 1.89 7 1.89 9 12 1.8 99 1.89 9 12 14菖 1.8 7 9 10 1.8 8 1 1.87 9 1.87 9 1.8 12 1.8 79 1.87 7 1.8 1 1 10 3 1雪 2 3 1 2 6雪 1.8 64 1.8 4 3 1.8 12 10 1.8 66 〈1 1.8 1 1 1.86 5 1.8 11 1.8 62 〈1 1.8 11 3 27 1.79 6 1.7 9 7 1.79 7 1.80 1 1.7 99 〈1 1.79 7 2 6 0 1.77 8 10 1.7 78 1,6 84 〈1 1.77 8 1.68 2 〈1 1.78 1 1.7 78 1.77 8 1.68 4 25ラ 1.7 11 1.7 10 1.7 10 〈1 3 2ラ 1.68 4 1.68 4 1.6 84 〈1 34了 1.66 4 1.6 64 1.66 4 1.66 5 1.6 64 〈1 1.66 7 1.6 2 1 16ラ 1.64 5 1.6 4 5 〈1 1.64 5 1.64 6 1.6 45 〈1 20互 35 2 , 19 0 22互 1.62 1 1.59 9 〈1 1.58 4 1.6 2 1 1.62 1 1.62 2 1.6 2 1 1.6 00 〈1 1.58 5 〈1 1.5 8 5 〈1 1.58 3 1.58 6 1.5 8 3 28雪 1.53 2 1.5 3 2 〈1 1.53 2 〈1 1.53 4 1.5 33 〈1 1.5 3 3 a (A ) 5 .68 5 .6 7 5.67 5 .68 5.6 1 5 .6 1 b (A ) 15 .18 15.19 15 .18 15 .2 0 15 .2 7 15.2 0 C (A ) 6.5 1 6 .5 3 6.52 6 .52 6.5 2 6 .5 2 β 1 18ー3 8 1 18 ー4 8 1 18ー4 7 1 18ー6 8 1 17 8 5 118 ー4 9
A:ASTM card No.6-46.
Fig.l, and XRD data are listed in Table 6 together with their lattice constants. XRD data and lattice constants of these samples were observed to be not so different from each other.
Differential thermal analysis curves of these samples were almost the same. Five representative curves are shown in Fig.2. The curves show a
double low-temperature endothermic peak, corre-sponding to loss of water in two stages (i.e. loss of
¥y& molecules to give CaSO4*K, and then
dehydra-tion to anhydrite).
Observations gleaned from the scanning electron microscope, showed that morphological changes of the formed crystals under different solutions
Influence of Cations and Concentrations on the Morphology of Gypsum Crystals 61
0 5 1 0 N a 0 5 1 0M g山山JL
0 5 1 0 F e 20 30 40 45' 2 0 (CuKa)Fig. 1. X-ray diffraction patterns of formed gypsums under different conditions. 0510Na : 30 minutes reaction product from the solution of 0.5M Na2SO4+0.5M CaCl2 ; 0505Al : 30 minutes reaction product from
the solution of 0.5M AUSCUs+O.SM CaCl2 ; 2010K :
30 minutes reaction product from the solution of lM K2SO4+2M CaCl2 ; 0510Mg : 30 minutes reaction product from the solution of lM MgSO4+0.5M CaCl2 ; 0510Fe : 30 minutes reaction product from the solution of lM FeSO4+0.5M CaCl2.
600 800 ℃ Fig. 2. Differential thermal analysis curves of the formed
gypsums.
A:Sample No.: 1015Fe; B:Sample No∴ 1015Na;
C:SampleNo: 1015Mg;D:SampleNo.: 1015K;
E: Sample Nai 1015Al.
62 Katsutoshi Tomita, Aki Kuwahara and Motoharu Kawano
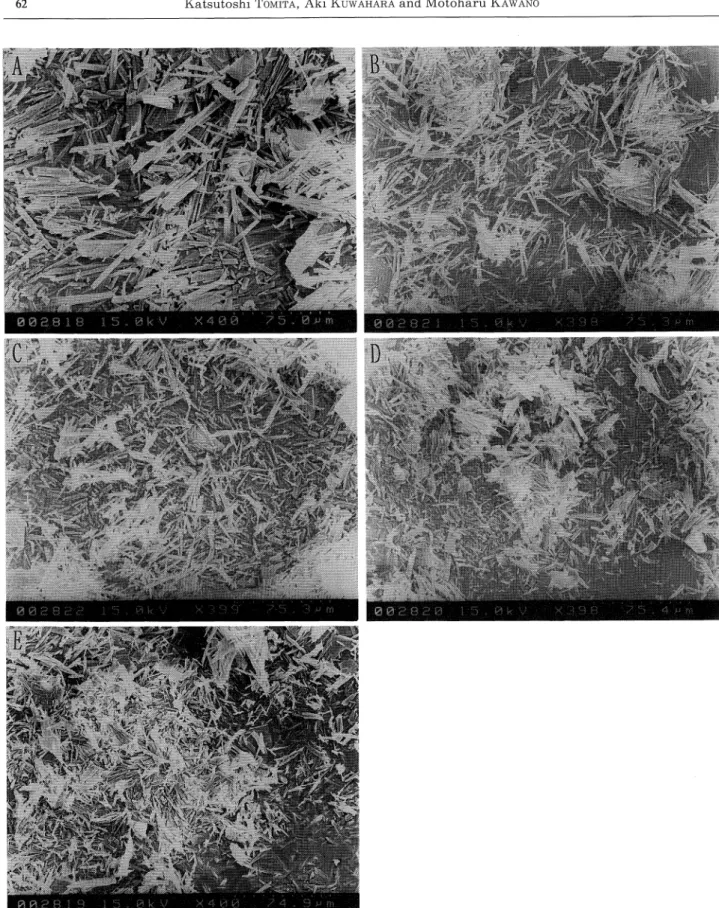
Fig. 4. Scanning electron micrographs of the formed gypsums. A : Sample No. : 1015Fe ; B : Sample No. : 1015Na ; C:Sample No : 1015Mg; D:Sample No∴ 1015K; E:Sample No.: 1015Al.
Influence of Cations and Concentrations on the Morphology of Gypsum Crystals 63
containing different cations were not so essentially different. The (010) plane of every crystals was clearly observed and its size appeared large (Fig. 3). Planes (110) and (111) were a bit different from each other. Products from mixed solution of
Na2SO4 and CaCl2, and of MgSO4 and CaCl2, showed
elongated thin plates, whereas crystals formed from
mixtures of MgSO4 and CaCl2, and AmSO^s, showed
thick elongated plates. Under the same
concentra-tions (1M of CaCl2 and lM of added solution),
crys-tals formed from mixed solutions such as MgSO4 and
CaCl2, FeSO4 and CaCl2, and AMSOJs and CaCl2
showed a long large (111) plane, while crystals formed from solutions of K2SO4 and CaCl2 also showed a long large (311) plane. Crystals formed from solutions of Na2SO4 and CaCl2 exhibited a long large (211) plane besides (111) plane.
The crystal length is also shown to be substan-tially influenced by the concentration of the solution. Under unvarying concentration of solutions (0.5M of CaCl2 and 0.5M of added solutions), crystals formed from a mixed solution of Na2SO4 and CaCl2 showed a long (411) plane, and those from a mixed solution of MgSO2 and CaGU defined a long (211) plane. Crys-tals developed from a mixed solution of K2SO4 and CaCl2 depicted a long (111) plane, while those from a mixed solution of A12(SO4)3 and CaCl2 typified a long (511) plane. Under high concentrations of the solutions, sizes of the formed crystals are a bit illus-trated slight dissimilarity from each other. Scan-rung electron micrographs of crystals formed under the same conditions are shown in Fig. 4. Crystal size and mode of aggregation were apparently influenced by the existing cations. Crystal size seemed to be larger when Fe2+ exists in the solution as compared with other cations.
Influence of concentration
In this paper concentration means the concentra-tion of mixed soluconcentra-tion. Crystals formed under low concentration of any solutions showed platy forms having cracks on the surface, and also showed twins (Fig. 5) and flower-like aggregates (Fig. 6). Conso-nant to the increase of concentration, aggregates of needle crystals were formed (Fig.7A). Under the
Fig.5. Scanning electron micrographs showing platy crystals and twins.
Fig. 6. Scanning electron micrograph showing flower-like crystal.
64 Katsutoshi Tomita, Aki Kuwahara and Motoharu Kawano
Fig. 7. Scanning electron micrographs showing aggregates of twin crystals (A) and leaves of Japanese cedars
B.
Fig. 8. Scanning electron micrograph showing stick-like crystals.
more concentrated condition, aggregates of short needle-like crystal resembling leaves of Japanese cedars were formed (Fig. 7B). Under higher concen-trations, platy crystals were not observed and stick-like crystals were formed (Fig. 8).
Conclusion and Discussion
Based on the influence of cations under equal concentration condition, the following evidences were clarified. Formed crystal sizes and aggregation conditions displayed significant dependence on cations, and under the existence of Fe , formed crystal sizes were apparently larger. Lengths of edges and planes and angles of apexes also showed strong dependency on cations. Under low concentra-tion of soluconcentra-tion, growth of plane (511) was remark-able with the existence of Al . In the case of Na+ that of plane (411) was prominent, while for Mg2+ that of plane (211) was distinctive, and for K+ that of plane (31 1) was well-defined.
Regarding the influence of concentrations, results revealed that under low concentrations, many plate-like crystals and twin crystals were formed. Conversely, the increase in concentration brought diagnostic changes on crystal aggregation. The plate-like crystals and twin crystals notably creased. The crystal sizes also recognizably de-creased. Under high concentrations, radiated stick-like crystals were dominant.
Under low concentrations, crystals were ob-served to have formed slowly, and the resulting crystals were large, whereas, under high concentra-tions, crystal growth rate is high, and consequently crystals formed were many but comparatively smaller. Under low concentrations, vent crystals were also observed. It is said that vent crystals are due to the impurities included in the crystals. The authors analysed such impurities of the formed gypsum crystals using EDX, and it was confirmed that impurities were not included in the crystals. Twin crystals and platy crystals were observed only in low concentrations. Why those crystals formed
under low concentration conditions are not yet fully understood, and therefore further study is still necessary.
Influence of Cations and Concentrations on the Morphology of Gypsum Crystals 65
Acknowledgments
The authors are indebted to T. Kakoi of Kagoshima University for his technical assistance.
References
Bottrell, S. H. ( 1991 ) Sulphur isotope evidence for the origin of cave evaporates in Ogofy Daren Cilau, south Wales. Miner. Mag., 55, 209-210.
Grattan-Bellow, P. E. ( 1975) Effects of preferred orientation on X-ray diffraction patterns of gypsum. Amer. Miner.,
60, 1127-1129.
LindBerg, J. D. and Smith, M. S. (1973) Reflectance spectra of gypsum sand from the white sands national
monument and basalt from a nearby lava flaw. Amer. Miner., 58, 1062-1064.
Kastner, M. (1970) An inclusion hourglass pattern in synthetic gypsum. Amer. Miner., 55, 2128-2130. Rinaudo, C. and FranchinトAngela, M. ( 1989) Curvature of
gypsum crystals induced by growth in the presence of impurities. Miner. Mag., 53, 479-482.
Rodgers, K. A. and Courtney, S. F. (1988) Mineral records from Funafuti, Tuvalu: gypsum, brucite, ettrmgite. Miner. Mag., 52, 41ト414
Tomita, K., Kanai, T., Kobayashi, T. and Oba, N. (1985) Accretionary lapilli formed by the eruption of Sakurajima volcano. J. Japan. Assoc. Miner. Pet Econ. GeoL 80, 49-54.