Product Mix Strategies and Pricing of
Japanese Wild Grape Wine
By
Masayuki Hirao*
(Received August 22, 2013/Accepted October 18, 2013)
Summary:In recent years, it has become increasingly popular in the wine business around Japan to
re-examine resources of wild grape varieties that are indigenous to Japan and produce wine. This paper, while reviewing the realities of such wine production, examines product mix strategies employed in various forms of wine business as well as the factors determining the pricing of products. In the examination of product mix strategies, principal component analysis and cluster analysis are applied by using the data on the width, depth, and pricing of product lines in the wine business in order to classify the product mix strategies in the business. As a result, it is clarified that there are six types of product mix strategies relating to wild grape wine and they are determined by the business strategies of the wine business. In the examination of pricing, formative factors of wild grape wine prices are analyzed by estimating hedonic price functions with the use of property data on production methods and combinations of ingredient varieties in producing wild grape wine as well as the data on production regions and types of product mix strategies. Consequently, it is revealed that the pricing of wild grape wine is greatly influenced not only by production methods or combinations of ingredient varieties but also by regions and the types of product mix strategies in the wine business.
Key words:Wild grape, Wine, Product mix, Pricing, Principal component analysis, Cluster analysis,
Hedonic price
Introduction
Wine production in Japan spread nationwide after the Meiji period, as part of an integrated industrial develop- ment policy. At that time, wild grape species (from the hill) were used as the ingredient for experiments of proper wine brewing1). However, large numbers of
seedlings of European and American grape species were introduced and raised to adulthood, and once these grapes could be harvested the use of domestic species of wild grapes for winemaking disappeared almost entirely. The development of suitable species and improvement of cultivation techniques has been continued for many years, as the intoroduced foreign grape species were not all suited for Japan's climate and natural features. Thus, the grape species currently cultivated in Japan for wine production, with the exception of some Koshu species, are composed entirely of European species, American species, and their crossbreeds. However, in recent years, there is increasing demand from consumers for organic
produce, and local food movements are expanding nationwide. In this environment, various areas through- out Japan are taking another look at wild grapes as a local resource. One part of these initiatives is the revival of winemaking using these wild grapes, which can be seen in many parts of Japan today.
Because the character of a finished wine is heavily influenced by the type of grapes used in its production, wines are made not only from single varieties of grapes, but also from a mixture of different varieties, in order to make use of each grape’s special characteristics. There- fore, with the inclusion of products such as rose wines and sparkling wines, which are made through different processes, product lines are becoming increasingly wide-ranging. Also, large-capacity 1.8 l bottles for family consumption and half bottles for restaurant use and for tourists add a uniform depth to the variety of these product lines. In the midst of this extensive lineup of wine products, how best to add new wines made from wild grapes is a challenge for existing wine businesses.
Also, for organizations beginning to conduct wine business using these wild grape varieties, how to build a product line focusing on these wild grape wines is a major issue for consideration. In addition, pricing these wines in order to strategically construct a product line is a major factor influencing the success or failure of businesses. Furthermore, due to the limited yield of wild grape breeds, the prices of the wines are naturally set rather high. Wild grape wines generally compete with wines made from domestic materials in quality, but since wild grape breeds are mostly cultivated in the Tohoku area, the competition among wild grape wines in the niche market is also an issue.
Wine business is typically handled by wineries themselves. However, in the case of wild grape wines, in some cases grape production and wine sales are the main constituents of the business, and in some cases consist of wine sales alone. There are various forms of business aside from wineries. Therefore, in this paper, these variegated forms of wine-related business are all included in the term“wine business.”
In this paper, the term“wild grape”is used, and the Japanese term“Yamabudo”refers to one wild grape species native to Japan, Yamabudo. The term“wild grape wine”below is a general term that refers to wines made from wild grape varieties, as well as products made from grapes that are the product of crossbreeding other species with these wild grapes.
The structure of this paper is as follows. First of all, the characteristics of wild grape production have been clarified by examining the official statistics related to their use as a winemaking material. Next, multivariate analysis of data have been used related to the width and depth of the wild grape wine product lines of Japan’s wild grape wine businesses to classify these businesses into different types, and uncover the strategies used for product line construction by each type of business. In this paper,“product line”means types (brands) of wild grape wine. And the“width”of product line is the number of product lines while the“depth”means the number of products per line. Finally, using data related to the pricing and characteristics of each business’s core wild grape wine products, I will estimate the hedonic function of wild grape wines, and clarify the conside- rations that go into their pricing. Quantitative analysis using statistical method was applied because there is a wide variety of wild grape wine businesses and it is difficult to categorize them with qualitative analysis. A qualitative analysis allows us a detailed evaluation on various factors in the pricing.
Past economic research relating to the use of wild grapes in the wine business in Japan includes Iba’s
discussion of the Hiruzen Winery’s diversification and local stimulus initiatives2)and Kobayashi’s examination of
the development of family-farm wineries which focus their business on wines made from wild grapes3), but
both of these were case studies, and did not touch on the marketing strategies of the wine business from a nationwide perspective, as this paper does. Kawasaki4)
discussed the product line of a regional small winery, but it was a case study. Also, the hedonic approach used to analyze pricing has been used in numerous research projects. Lin5)applied it to beef carcasses price at the
wholesale market, Kajikawa6)to the apple price at the
wholesale market, Hosono7)to the retail pricing of milk
and dairy products, Takeshita8)to the retail pricing of
tofu, and Kurihara9), applied it to the retail pricing of
green tea. Saito10)applied it to wheat bidding prices, and
Oishi11)to the retail pricing of seafood paste products.
Although no research has been conducted applying the hedonic approach to Japanese wine, Nerlove12)applied it
to wine overseas in Sweden, and Combris13)to Bordeaux
wine in France. None of these research projects have been related to the product-mix strategy and pricing. This means that there is no preceding research handling the same issues as this paper regarding either wild grape wine or any other domestic wine in Japan.
Characteristics of Wild Grape Production
There are 7 species and 8 varieties of wild grapes native to Japan. Of these, the ones with the widest dispersion are Yamabudo (Vitis coignetiae Pulliat), Ebizuru (Vitis ficiforlia Bunge var. lobata (Regel) Nakai), and Sankakuzuru (Vitis flexuosa Thunb) varieties14). Of
these three varieties, Yamabudo is the most suited for cultivation and use in winemaking, and its development is the most advanced. In Japan, almost all wild grape wine is made from either this grape or some crossbreed of it.
Fig. 1 Comparison of wild grapes yield per ha
Source : Ministry of Agriculture, Forestry, and Fisheries ; Special fruits production survey, 2010
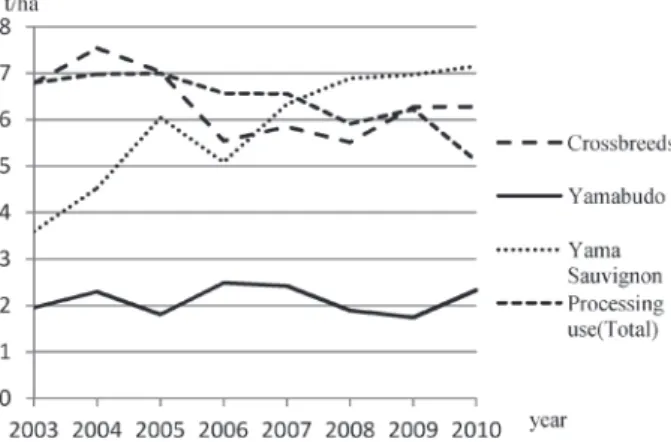
According to statistics from the Ministry of Agricul- ture, Forestry, and Fisheries, of the total area of breeds cultivated for manufacturing in 2010 (985 ha), the area used for cultivation of Yamabudo was 247 ha (and crossbreeds 72 ha), comprising 25.1% (and 7.3%) of the total area. The total yield was 4,624 t, with Yamabudo harvests of 831 t (and crossbreed harvests of 422 t) comprising 18.0% (and 9.1%) of the total. These statistics show that of the total grapes cultivated for manufactu- ring use, the ratio of Yamabudo varieties is not insignifi- cant, but the ratio of the total land used is high when compared to the ratio of the yield, indicating that the yield per ha for Yamabudo is low. Figure 1 is a comparison of yield per ha, and it shows that among the various wild grape varieties, Yamabudo have approxi- mately 1/3 of the yield volume of crossbreeds and other varieties cultivated for manufacturing use. These estimated Yamabudo yield figures are approximately 1 t lower than the results of my survey conducted in Iwate prefecture, but since other winemaking varieties also have slightly lower estimates, the relative size of the yield of Yamabudo is unchanged.
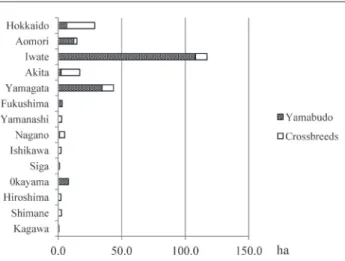
Figure 2 shows the cultivation area of each prefectural area in Japan. The vast majority of the wild grape breed cultivation is in either the Tohoku area or Hokkaido, and Iwate, Yamagata, and Hokkaido are the main production areas. The cultivation area in Iwate is far beyond that seen in any other prefecture, and almost all of the area is planted with Yamabudo. A major contributing factor to this development is the seedling development structure for the Suzumimurasaki No. 1-5 varieties newly bred by the Iwate Prefectural Forestry Technology Center and registered in 2005, which was prepared by the prefectural authorities to promote diffusion of these grapes in all areas within Iwate. Also, Figure 3 shows the yield for each breed of wild grapes grown for each type of manufacturing purpose. Although Yamabudo has
the largest yield of the wild grape varieties, half of this harvest was grown for purposes other than winemaking. The wild grapes have been used in many ways other than winemaking because of their applications as an ingredient for traditional juices and confectionary. Another reason for the wide uses of grapes is that wild grape production for winemaking in Iwate Prefecture, a main producing area, has been excessive in recent years. Yama Sauvignon developed in 1990 by the University of Yamanashi is the most widely cultivated crossbreed today. Amurensis is one of the wild grape species grown in the Korean peninsula, north- eastern China and Russia. Yamasachi, Kiyomai, Furano2, Kitanoyume are the original crossbreeds of the wineries. Black Pegase, Wine Grand, Syokoshi, White Pegase are the crossbreeds bred by a famous breeder, Haruo Sawanobori.
There are no production statistics on wild grape wines, so it is hard to obtain an accurate market size. However, since the wild grape yield is limited and many domestic wineries use imported materials as well, it can be said that wild grape wines create a special niche market.
Data and Methods
DataThe data used in this paper for analysis of wild grape wine’s product mix strategy are from those published on the internet by wine business. The examination period was from May to June of 2013. The breakdown by region and organizational forms of the 59 organizations that were examined is as shown in Table 1. Of those exam- ined, 42 are wineries that ferment their own wines, and 17 are organizations that produce wine using custom crush (consigned fermentation). The actual organizational forms of those that use custom crush are made up of municipality-sponsored semi-public sector (third sector)
Fig. 2 Cultivtion area of wild grapes
Source : Ministry of Agriculture, Forestry, and Fisheries ; Special fruits production survey, 2010
Fig. 3 Yield for each breed of wild grapes
Source : Ministry of Agriculture, Forestry, and Fisheries ; Special fruits production survey, 2010
entities, farmers and their groups, and alcohol retailers. A relatively large part of the subject organizations are from Hokkaido, Tohoku and Tosan region, but they are spread throughout the country, as far south as Miyazaki prefecture.
From websites of the examined subject organizations, number of wild grape and other wine product lines and number of product items were obtained. The reason that numbers of product line and product item differ is because if the same wines are distributed in 350 ml bottle and 720 ml bottle, this was counted as 1 line 2 items. In addition, a database was created after examination to categorize each item as white or not, rose or not, sparkling or not, barrel storage or not, product volume and price, for wild grape wines. 188 wild grape wines were used as source for the database.
Method
In order to examine the product mix strategy types of wild grape wines, the following data needed for examin- ing differences in product mix were generated : (1) num- ber of lines for wild grape wines in each organization ; (2) percentage of wild grape wine within the total number of lines ; (3) number of wild grape wine items ; (4) percentage of wild grape wine within the total number
of items ; (5) number of items per each wild grape wine line ; (6) number of wild grape breeds ; (7) percentage of wild grape breeds within the total number of breeds ; (8) highest price for wild grape wine ; (9) lowest price; and (10) range. (1) and (2) are the data related to the width of the product line, and (3), (4) and (5) are the data related to the depth of the product line. Next, using these data, principal component analysis was done, and scores corresponding to the principal components were calcu- lated for each organization, then cluster analysis was carried out using this data. Based on the result of this cluster analysis, product mix strategies for the 59 organizations were categorized from their similarities. In product mix strategy of a corporation, generally products ranging over multiple categories are also included15), not just limited to products with a single
category. Within a winery, products from other cate- gories that are not wine, such as grapes, grape juices and brandies are also produced. However, for this examination, the product mix strategy review was restricted to the wine category only.
After categorization, measurement of Hedonic price function was carried out to assess how characteristics of wine influence the price setting of wild grape wines. Hedonic price function can be estimated using subjective characteristics data such as sensory evaluation, or using objective characteristics data such as those displayed on the product. However, since results of prior researches such as one by Combris13)on wine, and another on tea
by Kurihara9)have resulted in a judgment that the
model is more appropriate to use for objective chara- cteristics, only the objective data were used here. It should be kept in mind that since the source of data was the internet, it is not necessarily the information displayed on the back of a bottle that a consumer picks up at a shop.
Data used for measurement were from 188 wild grape wines. Price of the wine was used as explained variable for the Hedonic price function. For explanatory variables, quantity (volume), price, type (white, rose), production method (sparkling, barrel), mixture of breeds (Yamabudo + other breeds, crossbreed, crossbreed + Yamabudo, crossbreed + other breeds, other breeds + Yamabudo, other breeds + crossbreed), consigned fermentation, region (Tohoku, Hokuriku, Kanto/Tosan/Tokai, Kinki and westward) and product mix strategy type (type 2, type 3, type 4, type 5, type 6) were used. For mixture of breeds, the left side of + is the main material and the other side is the sub material. For product mix strategy type, results from cluster analysis were used. Other than the quantity in the explanatory variables, the variables are all dummy variables. The final analysis model is as
Table 1 Region and organizational forms of
below, but for price and quantity, measurements were also taken where prices were converted to logarithm, and where prices and quantities were converted to logarithm, on top of the real numbers.
20
logP=α+β 1logX1+ΣβiXi +ε ⑴
i=2
For the above principal component analysis, cluster analysis and least squared method (OLS) analysis, SPSS15.0 j software was used. In addition, for clustering of cluster analysis, Ward method was applied, while for the estimate from Hedonic Price function, variable selection method for the most fitting model was utilized.
Results
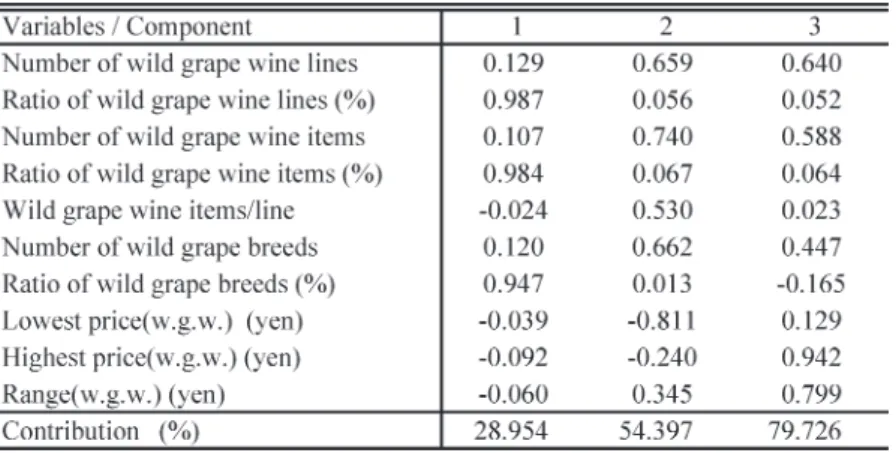
Product mix strategy of wild grape wine business The result of principal component analysis using data relating to product mix of wild grape wine is shown in Table 2. For the first principal component, percentage of wild grape lines within the total lines, percentage of wild grape wine items within the total items, and percentage of number of breeds of wild grape within total breeds
showed high factor loading, indicating that this is the main factor influencing the degree of specialization to wild grape wine. For the second principal component, number of wild grape lines, number of wild grape wine items and number of wild grape breeds and absolute value of lowest price have high factor loading, indicating that this is the main factor influencing the degree of completeness for wild grape wine. For the third principal component, the highest price and range have largest factor loading, indicating this to be the main factor relating to the degree of high quality (premium) of wild grape wine.
Using the scores from principal component analysis, a cluster analysis was carried out. The result showed that the product mix strategies of wild grape wine business can be categorized to six groups as displayed in Table 3. Taking the average from each principal component score, the characteristics of each type are as follows. Type 1 has the highest score in the first principal component, indicating that this group is business special- izing in wild grape wine. Type 2 has a high score for the second principal component, similar to type 5, and is
Table 3 Characteristics of each product mix strategy type Table 2 Result of the principal component analysis (Factor loading)
business with substantial wild grape wine selections. While the number of lines and items of this type are smaller compared to type 5, items per line is the biggest, indicating that this is a product line strategy with emphasis on depth for product line. Type 3 and 4 do not have any particular characteristic for principal compo- nent scores, but type 3 has a greater number of lines and items compared to type 4, showing that wild grape product lines play an important role in the overall wine product lines. By contrast, the role of wild grape is quite low within wine product lines for type 4, indicating that this is a type where wild grape wine product lines were introduced as a way to widen product selection. Type 5 is quite small and only has two applicable business, but it has high scores for each principal component, with a high degree of both specialization and completeness regarding wild grape wine, even offering premium wild grape wine, a full line product mix strategy. Type 6 is also quite small, the number of business applicable being only 5. It can be seen that this group highlights the rarity of wild grape wines, selling to those who under- stand the value, at a price that goes with the rarity, setting the product lines and prices along this strategy. Looking at the result of categorization on main Japanese wild grape winery strategy types, it can be seen that the birthplace of wild grape wine in Japan, Ikedacho winery (Hokkaido), falls under category 4. For the second generation that followed Ikedacho’s success
and which had been producing wine mainly with wild grape, Kuzumaki winery (Iwate) is type 5 while Gassan winery (Yamagata) is type 2, falling under different categories. Among the third generation wild grape wineries, Hakusan winery (Fukui) is targeting the same product mix strategy as Kuzumaki winery, while Okuizumo winery (Shimane) and Hiruzen winery (Okayama) in Chugoku region come under type 3 cate- gory. There is no space to discuss here the strategy type of individual corporations, but a further examination should be carried out with regards to corporate strate- gies and regional conditions.
Pricing of wild grape wine
The Hedonic Price function results from data of 188 wild grape wines currently distributed by 59 organi- zations are shown in Table 4. Looking at linear, partial- logarithmic, and dual-logarithmic estimate results from all variables, it can be seen that the dual-logarithmic model has the highest adjusted coefficient of determi- nation of 0.606. Ultimately, the function from variable selected estimate result had the highest coefficient of 0.609. For variable selection, estimate based on three methodologies, step-wise, step-down and step-up procedures were carried out, and the result from step down procedure that had the highest coefficient was adopted.
With regard to the types of wine, there was no signifi-
cant difference in price between white and red wines. For regional comparison, Tohoku and Hokuriku had no significant price difference to Hokkaido. As regards product mix strategy type, type 2 and 4 had no significant price difference to type 1. As can be seen from the fact that logarithmic model was selected for price, rather than linear price increase with volume, there appears to be a tendency for greater discount at higher price. Table 5 is a simulation result of change in price where 720 ml red wine was used as the base to make the impact from each variable easier to see. The prices are set as rose with 602 yen minus, barrel storage 456 yen plus. From combination of breeds, because Yamabudo is used as the base, all combinations resulted in negative impact. Crossbreed by itself had the smallest price drop, followed by combinations of Yamabudo + other breeds, crossbreed + Yamabudo, crossbreed + other breeds then other breeds + crossbreed in that order. However, the variance between the cheapest and most expensive combination is quite small, only 292 yen. With regard to regions, there is a tendency for the price to go higher as one goes further west in Japan. However, on top of the matter of rarity, one must consider the fact that because of ambient temperature, the more westward the location, the higher in altitude the suitable land is for vineyard, with limited choice and impact on harvest quantity. Type 3 and type 5 have slightly higher than average price setting, but for type 6, the price setting is singularly different in that wild grape wines over 5000 yen in price were actually being distributed. So it has become clear that for price setting of wild grape wines, not only the region, but the product mix strategy of the winery organization also has influence.
Discussion
This paper presented an overview of the actual con- ditions of wild grape production, demonstrating that wild grape production accounts for a certain fraction of the domestic production of grapes for processing use, and that production of wine from wild grapes has recently been expanding as a result of breed development using wild grapes other than Yamabudo, such as Ebizuru and Sankakuzuru, as raw materials. In view of these con- ditions, we discussed mainly what product mix strategies each wine business, the key entity in wine development, had adopted and what factors underlay their setting of product prices.
In the discussion on product mix strategies, principal component and cluster analyses were performed using data on the width and extent of product lines and price setting at 59 wine businesses across Japan to classify the product mix strategies of these wine businesses. The results showed that product mix strategies for wild grape wine were classified into six types and underlain by the business strategies of these wine business. In the discussion on price setting, the hedonic price function was calculated using characteristic data on methods for manufacturing wine from wild grapes and combinations of raw material breeds for such wine and data from 188 items of wild grape wine on their production regions and types of product mix strategies, in order to analyze factors in price setting for wild grape wine. The results revealed that not only the manufacturing methods and combinations of raw material breeds but the production regions and types of product mix strategies of wine businesses also significantly affected price setting for wild grape wine.
While production of wild grape wine is currently undertaken by various business entities with different business strategies as described above, an appropriate product mix strategy is required in the course of busi- ness development. At Type 5 wineries, the number of wild grape wine items has greatly increased with all product lines used for wild grape wine. However, as suggested by the hedonic price function estimates, price differences among products may be limited depending on the combination of wild grape wine breeds, which, in turn, might lead to the problem of so-called product cannibalization. Although several estimation methods are available as indicated by Ono16)in terms of reviewing
cannibalization in the course of product diversification, it was impossible to deal with those methods in this paper. However, as pointed out by Terahata17), a product line
strategy requires not only responding to existing market segments but also considering transition of segments as
a result of consumers’ learning. In view of such a per- spective, it is necessary to reevaluate the product line strate- gies of wineries of each type. Although the majority of Type 1 businesses primarily provide 720 ml regular-sized bottle wine at present, they should consider providing a deeper product line that includes half and 1.8 l bottle wine as Type 2 businesses do.
From the estimates, price differences among regions were also identified. These differences indicate that product competition is more likely to occur in regions such as Hokkaido, Tohoku and Hokuriku, where wild grapes grow naturally. These results indicate that supply of wild grape wine products in a region is rather in excess of demand. For the purpose of adjusting the supply-demand balance in a region, it is also a solution to distribute raw materials to other regions. Considering the product characteristics of wild grape wine, however, not a few wineries are careful in accepting raw materials from other regions. Therefore, it is necessary in develop- ing a production plan of raw materials to exploit their uses in food products other than wine as well as to conduct accurate predictions of supply and demand. In conclusion, we look to certain tasks in the future. The first is data collection. The data used for this study were obtained mainly from the Internet, where busi- nesses producing wild grape wine were selected. How- ever, since wild grape wine is often produced for a limited time only, some products may have been sold out and deleted from their homepages before the research period; a review of the time for research is therefore necessary. Meanwhile, it was impossible to include any indicator of taste such as sweetness, which is one of the important properties of wine, as a variable for the price analysis, because the notation differs from winery to winery and a number of wineries state nothing. Given the importance of this property, a method to digitize it in an appropriate form should be developed.
The second is a study on the relationship between product mix strategies and business development. The six types of product mix strategies illustrated in this paper are expected to change over the course of business develop- ment. Wineries in the town of Ikeda, Hokkaido, though currently classified as Type 4, originally started with the production of wild grape wine ; it is therefore necessary to study how their product mix strategies have changed over the course of business development.
The third concerns management perspective. On the back of product mix strategies and price setting in those strategies, the cost structure of wild grape wine and the
distribution structure of sales channels exert a great effect. Addressing these issues requires a case study that targets individual companies, which should also be car- ried out for further understanding of product mix strate- gies.
References
1) Katsuta A (2003) Masazo Fujimura, first winemaker in Japan. J.ASEV jpn. 14 (3) : 159-160.
2) Iba H, Oda S (2005) Winery management and social vitaliza- tion in Japan : From the viewpoint of Business Diversification of a Small winery in a rural area. J.ASEV Jpn 16, 60-67. 3) Kobayashi Y, Iba H, Ociai K, Ueda N, Oda S (2008)
Attributes and issues of viticulture and wine making business primarily utilizing wild grape. J.ASEV Jpn 19. 96-97.
4) Kawasaki N, Nagatani T, Yamakawa R, Nakamura Y, Iba H, Ueda N, Ochiai K, Oda S (2011) An empirical analysis on the sustainable business of regional small winery : From the viewpoint of Product Potential Sources of grape. J.ASEV Jpn 22. 22-30.
5) Lin B H, Mori H (1992) Evaluations of the New Beef Carcass Grade : A hedonic price approach. Journal of Rural Economics 63. 227-238.
6) Kajikawa C (1997) Quality level and price in the Japanese apple market : Analysis of Japanese and imported apples. Journal of Rural Economics 68 (4). 199-206.
7) Hosono H (2003) Availability of the label in the selection of milk and dairy products. Tyokikinnyu 88 : 79-92.
8) Takeshita H (2003) Hedonic price for non-GM tofu and consumers’ risk perception of GM technology.Japanese Journal of Risk Analysis 14 (2) : 79-84.
9) Kurihara Y, Tanaka H. (2004) An estimation of the hedonic price function for green tea. Japanese Journal of Farm management. 42 (3). 1-11.
10) Saito Y, Saito H (2009) Hedonic Price Analysis of Japanese Wheat Quality. Agricultural Information Rearch
18 (1). 52-59
11) Oishi T, Ariji M, Takahara A, Ominami J, Kitayama M, Honda J, Arai S (2012) The impact of food additives on the price of fish paste products : An analysis based on the hedonic price approach. Journal of Food System Research
51. 2-11.
12) Nerlove M. (1995) Hedonic price functions and the measurement of preferences : The case of Swedish wine consumers. European Economic Review 39, 1 698-1716 13) Combris P, Lecocq S, Visser M (1997) Estimation of a
hedonic price equation for Bordeux wine : Does quality matter?, The Economic Journal 107. 390-402.
14) Matsui H (1996) Japan Grape Science, Yokendo, Tokyo, pp. 58-62.
15) Kotler P (1999) Marketing Management. Prentice Hall, Upper Saddle River, pp. 398-399.
16) Terahara M (1998) Product line strategy and consumers’ learning. Organizational Science. 32 (2) : 41-53.
17) Ono K, Joh H (1990) Product diversification and cannibali- zation. Keio Business Forum. 8 (3) : 19-45.