The genetic diversity and population
history of indigenous peoples in Asia
Timothy Adrian anak Joseph Jinam
DOCTOR OF PHILOSOPHY
Department of Genetics,
School of Life Science,
The Graduate University for Advanced Studies (SOKENDAI)
2011
i
Acknowledgements
First and foremost I would like to thank my academic supervisor, Naruya Saitou for his expert advice and support throughout the duration of my time in Japan. I would also like to thank members of my progress committee: Toshiyuki Takano, Takashi Gojobori, Hiroshi Akashi, Nori Kurata and Ituro Inoue for their useful advice and constructive criticisms. I am also grateful to Katsushi Tokunaga and Nao Nishida from the University of Tokyo for their assistance and collaboration for this project.
I would also take this opportunity to thank Mark Stoneking and members of his group at the Max Planck Institute for Evolutionary Anthropology in Leipzig for being such graceful hosts and for their valuable input to my research. Thanks also to SOKENDAI for making it all happen and also to members of the Educational Support Team in NIG for your patience and support. I also thank friends and collaborators in Malaysia, especially Maude Phipps, Mahmood Ameen, Juli Edo and Hong Lih Chun.
I would also like to acknowledge the Ministry of Education, Culture, Sports, Science & Technology in Japan (MEXT) for giving me the opportunity to pursue my doctorate degree in Japan. I also extend my gratitude to SOKENDAI for providing the research grant (SOKENDAI Strategic Research Project) for me to conduct my research smoothly.
Thanks also to all members of Saitou Lab, past and present, for all your valuable support and friendship. Finally I wish to thank my family and friends (wherever they may be) for their endless support and encouragement. Thank you and terima kasih.
ii
TABLE OF CONTENTS
List of Figures………...iv
List of Tables……….vi
Abbreviations………...vii
Abstract...viii
Chapter 1: General Introduction……….1
1.1 Human population diversity in Asia………1
1.2 Human migrations into Asia: from archaeology, linguistics to genetics……….6
1.3 General goals & organization of dissertation………..9
Chapter 2: Genetic substructure in Malaysian populations and relationships with other Southeast Asians estimated from genome-wide SNP data………….10
2.1 Introduction………10
2.2 Materials & Methods……….11
2.2.1 Ethical approval & data retrieval……….11
2.2.2 Data filtering and quality control of SNP genotypes………...12
2.2.3 Data analysis………17
2.3 Results………17
2.3.1 Genetic substructure in Malaysian populations………...17
2.3.2 Relationships between Southeast Asian populations………...27
2.4 Discussion………..29
Chapter 3: Complete mitochondrial DNA analysis in indigenous Malaysian populations………...32
3.1 Introduction………32
3.2 Material & methods………...35
3.2.1 Sample collection and ethical approval……….35
iii
3.2.2 Complete mitochondrial DNA sequencing………39
3.2.3 Data analysis………..39
3.3 Results………40
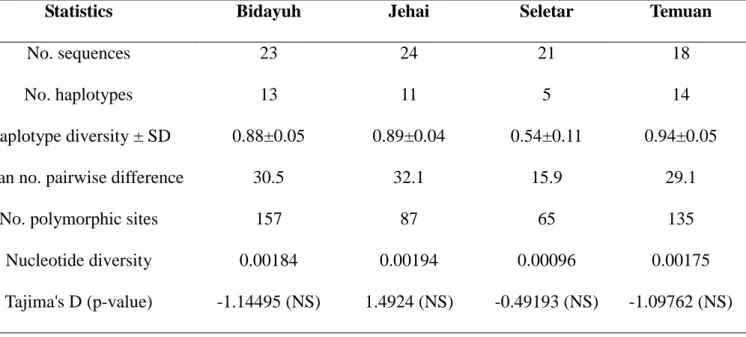
3.3.1 Summary statistics………...40
3.3.2 Haplogroup nomenclature and frequencies………...41
3.3.3 Principal Component Analysis based on haplogroup frequencies...46
3.3.4 Phylogenetic analysis and age estimates of haplogroups...47
3.3.5 Bayesian Skyline Plot analysis...56
3.4 Discussion...58
Chapter 4: Population history and genetic affinities of Japanese populations based on genome-wide SNP data...63
4.1 Introduction...63
4.2 Materials and methods...66
4.2.1 Sample data, ethical approval & SNP genotyping...66
4.2.2 Data filtering & quality checks...67
4.2.3 Merging with other population data...69
4.2.4 Data analysis...69
4.3 Results...71
4.3.1 Genetic substructure within Japanese populations...71
4.3.2 Phylogenetic analysis and relationships between populations...78
4.4 Discussion...84
Chapter 5: General Discussions and Conclusions...87
References...93
Appendices...100
iv
List of figures
Figure 1.1: Migration routes into Southeast Asia based on archaeological data...2
Figure 1.2: Geographical map showing the main islands in the Japanese archipelago circa 20,000 YBP...5
Figure 2.1: Overview of the experimental procedures for the GeneChip Mapping 50K Xba Assay...13
Figure 2.2: Geographical locations of PASNP populations from Southeast Asia...16
Figure 2.3: The first two Principal component (PC) analysis plots of individuals...23
Figure 2.4: Principal component plots of individuals from Bidayuh, Temuan, Malay and Chinese...24
Figure 2.5: STRUCTURE and frappe output from k=2 to k=6...25
Figure 2.6: Correlation between Principal component values and STRUCTURE ancestry proportions...26
Figure 2.7: PCA plot of Southeast Asians...28
Figure 3.1: Phylogenetic tree of human mtDNA...34
Figure 3.2: A map of Southeast Asia indicating geographical positions of populations used for analysis...38
Figure 3.3: Haplogroup classification of complete mtDNA sequences from macrohaplogroup M...43
Figure 3.4: Haplogroup classification of complete mtDNA sequences from macrohaplogroup N...44
Figure 3.5: Principal Component Analysis (PCA) plot based on mtDNA haplogroup frequencies...48
Figure 3.6: Neighbor-joining tree of mtDNA lineages...53
Figure 3.7: Maximum-likelihood tree showing age estimates of haplogroups...54
Figure 3.8: Bayesian Skyline Plots...57
v
Figure 4.1: PCA plots of Japanese and HapMap individuals...73 Figure 4.2: PCA plots of only Japanese and HapMap Han Chinese...74 Figure 4.3: Separate PCA plots of Japanese groups...75 Figure 4.4: Correlation between allele sharing distance with Principal Component 1 coordinates between the Ainu and Kanto Japanese...76 Figure 4.5: Neighbor-Joining tree of Japanese and Han Chinese based on allele sharing distances between individuals...78 Figure 4.6: Results of frappe analysis from k=2 to k=5...79 Figure 4.7: Neighbor-Joining tree showing topology of Japanese and HGDP-CEPH populations...81 Figure 4.8: Neighbor-Joining tree showing topology of Japanese and PASNP populations...82 Figure 4.9: Unrooted Neighbor-Joining tree depicting the relationships between the Japanese and other East Asian populations...83 Figure 5.1: Plausible migration routes to Southeast Asia based on genetic data...90
vi
List of tables
Table 2.1: Pan-Asian SNP (PASNP) population information...14
Table 2.2: Pairwise Fst distances between populations using all individuals...18
Table 2.3: Pairwise Fst distances between populations after removing admixed individuals...19
Table 3.1: Population information used for mtDNA analyses...36
Table 3.2: Summary statistics for complete mtDNA sequences in four Malaysian groups...42
Table 3.3: mtDNA haplogroup frequencies (%) in five indigenous Malaysian groups...45
Table 3.4: Age estimates of selected haplogroups based on mtDNA coding-region sequences using Maximum-Likelihood (ML) and Bayesian MCMC methods...55
Table 4.1: SNP filtering applied to the Japanese and HapMap dataset...68
Table 4.2: East Asian populations from HDGP-CEPH and PASNP datasets which were merged with the Japanese-HapMap datasets...70
vii
Abbreviations
bp: Base pairs
BSP: Bayesian Skyline Plot
ML: Maximum-Likelihood
mtDNA: Mitochondrial DNA
NJ: Neighbor-Joining
PCA: Principal Component Analysis PCR: Polymerase Chain Reaction SNP: Single Nucleotide Polymorhism
TMRCA: Time to the Most Recent Common Ancestor YBP: Years Before Present
viii ABSTRACT
Asia is home to many diverse human populations and has been of much interest to
anthropologists and geneticists alike. The focus of this thesis is the genetic diversity and
migration histories of indigenous populations from Southeast Asia and the Japanese Archipelago.
Based on archaeological and linguistic data, the origins of Southeast Asians can be traced back to two major migrations; the ancient „Out of Africa‟ migration circa 50,000 years before present
(YBP) and the relatively recent „Out of Taiwan‟ expansion of Austronesian agriculturalists
approximately 5,000 YBP. In Malaysia and the Philippines, there are indigenous groups called
Negritos whose physical appearance is distinct from their neighboring populations and are
thought to have originated from the „Out of Africa‟ migration. The majority of other Southeast
Asian groups are thought to have originated from the „Out of Taiwan‟ migration. As for the
peopling of the Japanese archipelago, it is characterized by two important periods: the Jomon
period from 15,000 to 3,000 YBP; and the Yayoi period from 3,000 to 1,700 YBP. According to
the dual-structure model, the current Japanese population was the result of admixture between
Jomon populations who originated from Southeast Asia and the incoming Yayoi migrants from
mainland Asia. Some minority groups in Hokkaido and the Ryukyu islands may be direct
descendants of the Jomon peoples.
By analyzing approximately 50,000 genome-wide SNP data generated by me and other
Pan-Asian SNP Consortium (PASNP) members, I investigated the genetic structure that may
ix
exist within indigenous groups of Malaysia and elucidated their relationship with other Southeast
Asians. Using Principal Component Analysis (PCA) and STRUCTURE analysis, I found traces
of recent and sustained admixture within the Negrito, Indian and Austronesian (Temuan,
Bidayuh, Malay) groups. Comparisons with other Southeast Asians revealed that the Malaysian
Negritos are distinct from the Philippine Negritos, putting doubt into their common origins as
proposed by the „Out of Africa‟ model. A closer look at the relationship between Austronesian
populations revealed genetic substructure which mirrors geographical affinities, which may be
explained by geographical isolation following the „Out of Taiwan‟ expansion or alternatively
there may be separate population movements involving other Austronesian groups. These
observations demonstrate the impact of admixture on the genetic substructure of indigenous
Southeast Asian groups and hints at a more complex migration history of the Negritos and
Austronesians than the simple „Out of Africa‟ and „Out of Taiwan‟ models would suggest.
Next I conducted an analysis of complete mitochondrial DNA (mtDNA) sequences to
test the plausibility, impact and timing of the migration models in indigenous Malaysian
populations. I generated complete mtDNA sequences in 86 individuals from four indigenous
Malaysian groups. In the Jehai (Negrito), one of the frequent haplogroups was R21 which is
indigenous to West Malaysia and dates back to the Pleistocene (~40,000 YBP). The three
Austronesian groups (Bidayuh, Selatar and Temuan) showed high frequencies of haplogroups
N9a6, N9a6a, F1a‟c, N21 and N22 which have mainland Asian origins around 30,000 to 10,000
x
YBP. Haplogroups associated with the „Out of Taiwan‟ expansion were either found at very low
frequencies or not detected at all in those three Austronesian groups. Principal Component
Analysis distinguishes the Malaysian Negritos from the Austronesians and also shows a
dichotomy between Austronesians from Sumatra and Java and those from Taiwan and
Philippines. As with the SNP analysis, results from mtDNA showed no apparent link between the
Negritos of West Malaysia and those from Andaman and Philippines, again putting in question
their common origins from the „Out of Africa‟ migration. Regarding the origin of Austronesians, our results show support for an „early train‟ migration originating from Indochina or South China
around 30,000 to 10,000 YBP which predates but does not rule out the subsequent „Out of
Taiwan‟ expansion.
Finally I conducted a study to find out the genetic structure in Japanese populations and
to answer questions regarding which model of Japanese origins would be best supported by the
genome-wide SNP data. I performed data analysis of close to 1 million genome-wide SNP
genotypes generated using the Affymetrix 6.0 genechip in three Japanese populations:
Hondo-Japanese, Ryukyuan and Ainu. Principal Component Analysis (PCA) plots showed that
these three populations formed three distinct clusters, with greater genetic variation within
individuals of the Ainu group, brought about by admixture with the mainland Japanese and
possibly another population from Northeast Asia. Phylogenetic analysis revealed that the
Ryukyuans and Ainu form a cluster with 100% bootstrap probability and comparisons with other
xi
global populations showed that all three Japanese populations cluster with other North East
Asians. Current results appear to support the common ancestry of Ainu & Ryukyuans, which is
compatible with the dual-structure model. However, the close affinity of all three Japanese
populations with other North East Asians put the idea of Jomon origins from Southeast Asia in
doubt although not entirely ruled out.
In summary, my results demonstrate the influence of surrounding populations to the
genetic diversity in indigenous Malaysian and Japanese populations which also contributes to the
genetic substructure in these indigenous groups. The presence of admixed individuals has to be
considered when designing sampling strategies for future population genetic studies as well as
when conducting and interpreting results of association studies. Regarding the history and
origins of Austronesians in Southeast Asia, results suggest an earlier movement originating from
Indochina around 30,000 to 10,000 YBP which has more impact on the mtDNA diversity of
indigenous Austronesians in West Malaysia and Borneo than the proposed „Out of Taiwan‟
expansion around 5,000 YBP. As for the origins of the Japanese population, my data supports
some aspects of the dual-structure model in that the Ainu and Ryukyuans have shared genetic
ancestry and that the mainland Japanese are the result of admixture between ancestral Yayoi and
Jomon peoples. However, our data does not indicate a Southeast Asian origin of Jomon peoples
but shows a closer affinity to Northeast Asian populations.
1
CHAPTER 1
General introduction
1.1 Human population diversity in Asia
Asia is the world‟s largest and most populous continent, spanning 44 million square kilometers and includes countries from Turkey in the west to the Pacific Islands in the east. Such a vast continent naturally houses a multitude of human populations, each with their own language and culture. The scope of this thesis is narrowed down to the human populations in two areas of interest, namely Southeast Asia and East Asia.
Southeast Asia currently consists of 11 countries and can be classified geographically into mainland Southeast Asia (Thailand, Vietnam, Laos, Cambodia, Myanmar, West Malaysia) and island Southeast Asia (Indonesia, East Malaysia, Brunei, Singapore, Philippines, East Timor). Mainland Southeast Asia is also sometimes referred to as Indochina but in this thesis, Indochina will be used to refer to more limited region encompassing only Cambodia, Laos and Vietnam. The division between mainland and island Southeast Asia did not become apparent until after the Last Glacial Maximum around 20,000 years before present (YBP). Up to the Last Glacial Maximum, the current islands of Borneo, Sumatra and Java were joined with the Asian mainland in what is called Sundaland (Figure 1.1). It was separated from the Sahul landmass which was made up of Papua New Guinea and the continent of Australia, by a boundary called the Wallace line, named after Sir Alfred Russel Wallace (Glover and Bellwood 2004).
2
Figure 1.1: Migration routes into Southeast Asia based on archaeological data. Thick grey lines indicate the boundaries of the Sundaland and Sahul landmasses up to the Last Glacial Maximum (~20,000 YBP). Black arrows indicate proposed human movements during the Pleistocene period (>20,000 YBP) according to archaeological data. Image source: Glover and Bellwood, 2004.
3
The languages spoken in Southeast Asia can be classified into Tibeto-Burman, Tai-Kadai, Hmong-Mien, Austro-Asiatic and Austronesian. Of those, Austro-Asiatic and Austronesian are the two largest and most-spoken linguistic families in Southeast Asia. Austro-Asiatic languages are spoken mostly in Indochina and by some populations in India and West Malaysia whereas Austronesian languages are spoken not only in island Southeast Asia but also in Madagascar and the Pacific islands, making it the most widespread ethnolinguistic group in the world prior to the spread of the English language (Adelaar and Himmelmann 2005).
The populations in Southeast Asia are still dominated by groups who have a long association with the region despite a long history of contact with various civilizations and kingdoms from Arabia, India, China and even Europe. These majority groups such as the Thais, Khmers, Malays, Filipinos and Javanese traditionally practice agriculture (Bellwood 2005). Living amongst them are several indigenous minority groups such as the Orang Asli of West Malaysia, the Mlabri of Thailand or the Penan from Borneo who still practice hunter-gathering lifestyles even to this day. These minority groups are generally regarded to have been present in the region prior to the arrival of the agriculturalist societies. Of considerable interest to physical and cultural anthropologists are a group of hunter-gatherers collectively called Negritos. The term owes much to the fact that they exhibit physical features such as darker skin and frizzy hair that are distinct from the general surrounding population. Included in this blanket term are Negritos from Andaman Islands, West Malaysia and the Philippines (Carey 1976).
The Negritos in West Malaysia (also referred to as Semang) are included in a broader category called Orang Asli. The term Orang Asli translates to „Original Peoples‟ in the Malay language and refers to about 18 distinct cultural-linguistic groups which are scattered throughout the rural and coastal regions of West Malaysia. Other subgroups include the Senoi and Proto-Malay (also referred to as Aboriginal Malay). The ancestors of the Senoi are thought to have originated from Indochina some 4,000 YBP and brought with them Neolithic cultures and
4
introduced Austro-Asiatic languages to the Negritos (Bellwood 2005). The Proto-Malays and the various tribes from East Malaysia who speak Austronesian languages are generally associated with the Austronesian expansion from Taiwan (Blust 1995; Bellwood 2007).
East Asia is another subregion in Asia and includes China, Korea, Japan, Mongolia and Taiwan. In this thesis, I will mostly focus on the populations from the Japanese Archipelago. The Japanese Archipelago consists of the four main islands of Hokkaido, Honshu, Shikoku and Kyushu as well as the smaller cluster of Ryukyu Islands. During the glacial period (up to
~20,000 YBP) the three main islands of Honshu, Shikoku and Kyushu were connected by land bridges (Figure 1.2) whereas the gap between Hokkaido and Honshu was not deemed enough of an impediment to prevent movements of fauna or humans (Imamura 1996). The majority of the current Japanese (referred to as mainland Japanese or Hondo Japanese) are believed to be descendants of agriculturalists from the mainland but there also exists indigenous minority groups known as the Ryukyuans from the Ryukyu Islands and the Ainu from Hokkaido. The Ainu in particular exhibit physical features that are unique from the Hondo Japanese or even the Ryukyuans, leading to various theories and speculation regarding their origins. Unlike the Hondo Japanese who mainly practice agriculture, the Ainu have until recently maintained their traditional hunter-gathering lifestyles.
It is evident that even in these two sub regions of Asia there exists a rich diversity of human populations and naturally one would be curious regarding their origins and history. The following sections will attempt to make a brief introduction to the human histories in Asia from archaeological, linguistic and genetic perspectives.
5
Figure 1.2: Geographical map showing the main islands in the Japanese Archipelago circa 20,000 YBP. Not shown are the Ryukyu Islands further south of the main islands. Thick black lines show the shoreline boundaries up to the Last Glacial Maximum (~20,000 YBP). Image modified from (Davison et al. 2005)
6
1.2 Human migrations into Asia: from archaeology, linguistics to genetics
With regards to the origins of anatomically modern humans, the generally accepted opinion is the Out of Africa model which posits the origin of Homo sapiens in Africa some 200,000 YBP and an eventual dispersal to other parts of the world, replacing the indigenous archaic humans. The earliest dispersal around 60,000 YBP was thought to have taken a southern, coastal route via India and Southeast Asia before eventually reaching Sahul. Dating of various archaeological specimens from Australia, New Guinea (Leavesley and Chappell 2004; O’ Connell and Allen 2004) as well as from Borneo (Barker et al. 2007) was taken as supporting evidence for this early southern dispersal. This initial migration wave was thought to be responsible for the origins of the Negritos as well as Melanesians and Australian Aboriginals.
For the majority of Southeast Asian populations, their ancestry can be traced back to the so-called Austronesian migration, which was named as such because it accounts for the origins of most, if not all, populations who speak the Austronesian family of languages. As mentioned previously, the spread of Austronesian speakers ranged from Madagascar off the coast of Africa to the Asia Pacific islands. Such an expansive migration was driven by a great innovation at the time, which was agriculture, thought to have been developed in China (Bellwood 2005). The origin of this Austronesian migration was pinpointed back to Taiwan, based on language phylogenies which placed Austronesian languages spoken by the Taiwanese aboriginals at the root and all other subgroups are derived from this ancestral form (Diamond 1988; Gray and Jordan 2000; Adelaar and Himmelmann 2005). Archaeological and anthropological observations estimate the timing of this diaspora to the Neolithic or mid-Holocene period, approximately 5,000 to 7,000 YBP (Glover and Bellwood 2004; Bellwood 2007). Starting from Taiwan, these Neolithic agriculturalists spread south via the Philippines and forked westwards to island Southeast Asia and eastwards to the Asia Pacific islands.
7
Regarding the migration history of East Asia, in particular Japan, archaeological evidence points to the presence of anatomically modern humans around 40,000 YBP based on dating of the earliest stone tools found. The oldest human remains found in Japan were dated back to 30,000 YBP, corresponding to the upper Paleolithic period (Imamura 1996; Hudson 2006; Yoneda M, personal communication). The time period starting from 15,000 YBP marks the start of the Jomon period. The origins of the Jomon people are still debatable, but early archaeological studies suggest an origin in Southeast Asia based on similarities in cranial and dental morphologies from Jomon archaeological samples and extant Ainu/Ryukyuu with Southeast Asian populations (Hanihara 1991). The Jomon people settled most parts of the Japanese Archipelago until the emergence of agriculturalists during the Yayoi period approximately 3,000 YBP (Haruhari and Imamura 2004). Although the exact origins of the Yayoi people are still unknown, they are believed to have migrated to the Japanese Archipelago from the mainland via the Korean peninsula. Their interactions with the extant Jomon people formed the basis of several proposed models for the origins of the current Japanese population.
In general, population histories put forward by archaeological and linguistic data have been supported by genetic data, though in some cases some ambiguities remain. Early studies using „classical‟ protein markers were consistent with the archaeological point of view regarding the origins of modern humans in Africa and the early southern route taken by the ancestors of Australian Aboriginals and Melanesians (Ruiz-Linarez et al. 1995; Cavalli-Sforza and Feldman 2003). The maternally inherited mitochondrial DNA (mtDNA) has also been used in support of this opinion, in which all human mtDNA lineages coalesce back to Africa 170,000 YBP (Ingman et al. 2000). The early southern dispersal via the coast was supported by mtDNA analysis whereby the basal M and N lineages found in India and indigenous populations in Southeast Asia date back to around 60,000 YBP (Macaulay et al. 2005; Majumder 2010). Recent advancements in Single Nucleotide Polymorphism (SNP) genotyping technology allows for the generation of
8
up to hundreds of thousands of genome-wide SNP to be used for population genetics analysis, among other applications. One such study by Li et al. (2008) provided further support for the Out of Africa model by showing a serial reduction in SNP haplotype diversity with increasing distance from Africa. Another study by the Pan-Asian SNP Consortium (Abdulla et al. 2009) suggested a single entry into Asia followed by a south to north migration in a model which unites the histories of Southeast and East Asian populations. With regards to the Austronesian expansion, genetic data has been equivocal in the support of archaeological and linguistic studies. While some mtDNA analyses provided support for the Austronesian expansion from Taiwan (Trejaut et al. 2005; Tabbada et al. 2009), others proposed an origin in island Southeast Asia (Oppenheimer and Richards 2001). Although several Southeast Asian populations were included in the Pan-Asian SNP paper, no explicit inference was made regarding the Austronesian expansion.
As for the origins of the Japanese populations from a genetic standpoint, analyses using classical protein and blood group markers pointed to close affiliations between the Ainu and Ryukyuans suggesting a common origin during the Jomon period (Omoto 1983, 1995; Nei 1995; Omoto and Saitou 1997). However, none of those studies demonstrated any links between the Ainu and Ryukyuans with Southeast Asian populations, contradicting the idea proposed by archaeological and anthropological data. While the uniparentally inherited mtDNA and Y-chromosome markers were rather ambiguous regarding the origins of the Jomon people, they all conclude that the Hondo Japanese experienced considerable influence from the mainland, in line with the emergence of Yayoi agriculturalists. Recent analysis of genome-wide SNP mostly involved the Ryukyuans and Hondo Japanese (Yamaguchi-Kabata et al. 2008; Abdulla et al. 2009) but no such data was available for the Ainu.
9
1.3 General goals & organization of dissertation
Previous studies into the origins and genetic diversity of Asian populations have yielded equivocal results, with some conclusions supporting the earlier models proposed by archaeological and linguistic data while others offered differing views and possible alternative models regarding the topic. This thesis will focus on the indigenous populations from two subregions in Asia, namely Southeast Asia and East Asia and will attempt to provide insights to the migration histories and genetic diversities using genome-wide SNP and complete mtDNA sequence data.
Chapter 2 will focus on the analysis of 50,000 genome-wide SNP in the Malaysian population and other Southeast Asians with the aim to investigate in further detail the substructure that may exist within indigenous groups of Malaysia and to elucidate their relationship with other Southeast Asian populations. Chapter 3 will report the in-depth analysis of complete mtDNA sequences from four indigenous groups in Malaysia. By exploring the diversity of the maternally inherited mtDNA in these groups and comparing them with other populations within the Southeast Asian region, I hope to shed light on some questions regarding the timing and impact of the proposed human migrations in the region. Chapter 4 will reveal in closer detail the genetic substructure within Japanese populations using more than 500,000 genome-wide SNP with the aim to answer questions regarding which model of Japanese origins would be best supported by the genome-wide SNP data.
10
CHAPTER 2
Genetic substructure in Malaysian populations and relationships
with other Southeast Asians estimated from genome-wide SNP data
2.1 Introduction
The populations in Malaysia typify the diversity found in the Southeast Asian region, with a mix of indigenous groups and those with ancestry tracing back to China and India. The majority of the Malaysian population consists of the indigenous Malay, Chinese and Indian populations and is also the case for Singapore. Although contact with traders from India and China dates back to at least the 15th century, it was only during the British colonial period, the late 19th century, which saw a massive influx of migrants predominantly from South India and South China (Andaya and Andaya 1984). Indigenous minority groups in Malaysia consist of the Orang Asli in the Malay Peninsula and various ethnic tribes in Borneo. Within this major group of Orang Asli, there exist some subgroups that are identified as Negritos who are thought to be descendants of the earliest migrants to the Southeast Asian region (Macaulay 2005; Hill et al. 2006). Other subgroups of the Orang Asli, the various tribes in Borneo as well as the Malays may have originated from the Austronesian expansion during the Neolithic period (Glover and Bellwood 2004; Bellwood 2005; Bellwood 2007).
Until recently, not much was known regarding the population genetic structure and diversity of these various indigenous groups, given their fairly reclusive nature. However, that trend has been changing with studies reported using mitochondrial DNA (Macaulay 2005; Hill et al. 2006; Hill et al. 2007), Y-chromosomal markers (Chang et al. 2009) and autosomal genetic markers(Dhaliwal et al. 2010; Jinam et al. 2010). Most recently, genome-wide SNP analyses on Asian populations, including several indigenous Malaysian groups have been reported (Abdulla
11
et al. 2009). However, detailed analysis of Southeast Asian populations was not reported explicitly in that study.
Thus, the aims of this chapter are to elucidate the detailed substructure that may exist within indigenous groups of Malaysia which include the Negritos and Austronesians in this study and to infer their relationships with other Southeast Asian populations.
2.2 Materials & Methods
2.2.1 Ethical approval & data retrieval
DNA samples from four indigenous Malaysian populations (Jehai, Kensiu, Temuan and Bidayuh) were collected as part of my Master‟s project (Jinam 2007). I performed the SNP genotyping experiments for those samples at the Genome Institute of Singapore under the guidance of Professor Mark Seielstad as part of the Pan-Asian SNP (PASNP) project (Abdulla et al. 2009). All samples were genotyped using the Affymetrix Xba 50k Genechip microarray and the workflow is shown in Figure 2.1. Briefly, 50ng of DNA for each sample was digested using Xba I restriction enzyme. The digested DNA fragments were then ligated with adapter molecules which would act as annealing sites for the primers in the subsequent PCR step. The PCR products were then pooled, purified and then fragmented to yield ~50bp fragments. The fragments were then labeled and hybridized onto the genechip array which contains oligonucleotide probes. Following hybridization, the genechip was then washed, stained and finally scanned to obtain the raw intensity files which were then converted to 58,960 genotype calls per sample.
Genotype data from other Southeast Asian populations were also retrieved from the PASNP database (http://www4a.biotec.or.th/PASNP). Those samples were also genotyped using the same Affymetrix Xba 50k Genechip microarray. Initial filtering of the data yielded 54,794
12
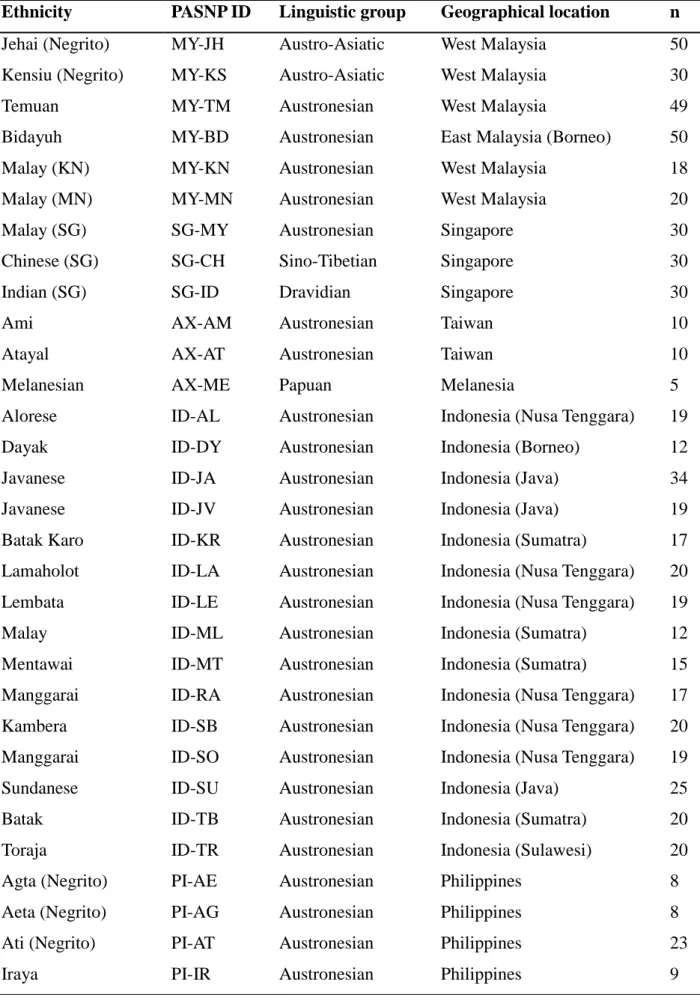
SNP genotypes. The list of the populations used in this analysis and their corresponding linguistic and geographical information are shown in Table 2.1 and Figure 2.1. This study involves the use of digital genotype data which was generated by me and other PASNP collaborators. It has been approved by the ethical committee board of the National Institute of Genetics, Mishima.
2.2.2 Data filtering and quality control of SNP genotypes
From an initial number of 54,794 SNP, further filtering was performed to exclude SNP with call rates of less than 95% and minor allele frequencies less than 0.1% loci using PLINK software (Purcell et al. 2007), resulting in a final tally of SNP used for subsequent analysis to be 51,585.
13
Figure 2.1: Overview of the experimental procedures for the GeneChip Mapping 50K Xba Assay (Image sourced from the Affymetrix product brochure).
14
Table 2.1: Pan-Asian SNP (PASNP) population information used in this study
Ethnicity PASNP ID Linguistic group Geographical location n
Jehai (Negrito) MY-JH Austro-Asiatic West Malaysia 50
Kensiu (Negrito) MY-KS Austro-Asiatic West Malaysia 30
Temuan MY-TM Austronesian West Malaysia 49
Bidayuh MY-BD Austronesian East Malaysia (Borneo) 50
Malay (KN) MY-KN Austronesian West Malaysia 18
Malay (MN) MY-MN Austronesian West Malaysia 20
Malay (SG) SG-MY Austronesian Singapore 30
Chinese (SG) SG-CH Sino-Tibetian Singapore 30
Indian (SG) SG-ID Dravidian Singapore 30
Ami AX-AM Austronesian Taiwan 10
Atayal AX-AT Austronesian Taiwan 10
Melanesian AX-ME Papuan Melanesia 5
Alorese ID-AL Austronesian Indonesia (Nusa Tenggara) 19
Dayak ID-DY Austronesian Indonesia (Borneo) 12
Javanese ID-JA Austronesian Indonesia (Java) 34
Javanese ID-JV Austronesian Indonesia (Java) 19
Batak Karo ID-KR Austronesian Indonesia (Sumatra) 17
Lamaholot ID-LA Austronesian Indonesia (Nusa Tenggara) 20
Lembata ID-LE Austronesian Indonesia (Nusa Tenggara) 19
Malay ID-ML Austronesian Indonesia (Sumatra) 12
Mentawai ID-MT Austronesian Indonesia (Sumatra) 15
Manggarai ID-RA Austronesian Indonesia (Nusa Tenggara) 17
Kambera ID-SB Austronesian Indonesia (Nusa Tenggara) 20
Manggarai ID-SO Austronesian Indonesia (Nusa Tenggara) 19
Sundanese ID-SU Austronesian Indonesia (Java) 25
Batak ID-TB Austronesian Indonesia (Sumatra) 20
Toraja ID-TR Austronesian Indonesia (Sulawesi) 20
Agta (Negrito) PI-AE Austronesian Philippines 8
Aeta (Negrito) PI-AG Austronesian Philippines 8
Ati (Negrito) PI-AT Austronesian Philippines 23
Iraya PI-IR Austronesian Philippines 9
15
Manobo PI-MA Austronesian Philippines 18
Mamanwa (Negrito) PI-MW Austronesian Philippines 19
Urban PI-UB Austronesian Philippines 20
Urban PI-UI Austronesian Philippines 20
Urban PI-UN Austronesian Philippines 19
Hmong TH-HM Hmong-Mien Thailand 20
Karen TH-KA Sino-Tibetian Thailand 20
Lawa TH-LW Austro-Asiatic Thailand 19
Mlabri TH-MA Austro-Asiatic Thailand 18
Mon TH-MO Austro-Asiatic Thailand 19
Palong TH-PL Austro-Asiatic Thailand 18
Plang TH-PP Austro-Asiatic Thailand 18
Tai-Kern TH-TK Tai-Kadai Thailand 18
Tai-Lue TH-TL Tai-Kadai Thailand 20
H'Tin TH-TN Tai-Kadai Thailand 18
Tai-Yuan TH-TU Tai-Kadai Thailand 20
Tai-Yong TH-TY Tai-Kadai Thailand 18
Yao TH-YA Hmong-Mien Thailand 19
16
Figure 2.2: Geographical locations of PASNP populations from Southeast Asia (from Abdulla et al. 2009, supplementary material)
17 2.2.3 Data analysis
Genetic distances (Fst) between Malaysian populations were calculated for each SNP according to Weir and Cockerham (1984). Pairwise Fst distances between pairs of populations were obtained by averaging the Fst values for all SNPs. Principal Component Analysis (PCA) was done to assess relatedness between individuals using the smartpca program from the EIGENSOFT software package (Patterson, Price, and Reich 2006). In order to identify population structure and levels of admixture within individuals, a Bayesian clustering method implemented in the STRUCTURE software was used (Pritchard, Stephens, and Donnelly 2000). STRUCTURE assigns individuals based on their genotypes into a user-defined number of ancestral populations, denoted as k. Under the admixture model, individuals who are jointly assigned to two or more ancestry components are considered to be admixed. Burn-in length and number of repeats were both set to 10,000. A maximum-likelihood approach to identifying admixture and population structure as implemented in the frappe software (Tang et al. 2005) was also used.
2.3 Results
2.3.1 Genetic substructure in Malaysian populations
Pairwise Fst distances between populations are shown in Table 2.2. The greatest genetic distances were between the Negritos and Indians (0.06) whereas the distance among the three Malay groups was the lowest (0.01). The three Malay groups also had the lowest distance from the Indians (0.03) compared to an average 0.05 for other populations, and this may reflect their Indian ancestry as suggested in STRUCTURE analysis. Omitting recently admixed individuals from the Indian-SG, Malay-SG, Bidayuh and Negritos resulted in higher Fst distance measures (Table 2.3).
18
Table 2.2: Pairwise Fst distances between populations averaged over all SNP and using all individuals
Jehai Kensiu Temuan Bidayuh Malay (KN) Malay (MN) Malay (SG) Chinese (SG)
Kensiu 0.0264
Temuan 0.0384 0.0498
Bidayuh 0.0466 0.0599 0.0260
Malay (KN) 0.0423 0.0503 0.0217 0.0274
Malay (MN) 0.0460 0.0544 0.0248 0.0293 0.0167
Malay (SG) 0.0371 0.0467 0.0164 0.0201 0.0111 0.0136
Chinese (SG) 0.0480 0.0585 0.0243 0.0266 0.0202 0.0226 0.0153
Indian (SG) 0.0620 0.0622 0.0497 0.0610 0.0313 0.0369 0.0340 0.0494
18 66 66
19
Table 2.3: Pairwise Fst distances between populations after removing admixed individuals from Jehai, Kensiu, Malay (SG), Bidayuh and Indian (SG) populations. Values that differ from Table 2.2 are indicated in red.
Jehai Kensiu Temuan Bidayuh Malay (KN) Malay (MN) Malay (SG) Chinese (SG)
Kensiu 0.0297
Temuan 0.0490 0.0510
Bidayuh 0.0585 0.0617 0.0264
Malay (KN) 0.0509 0.0518 0.0217 0.0279
Malay (MN) 0.0544 0.0558 0.0248 0.0298 0.0167
Malay (SG) 0.0471 0.0492 0.0164 0.0200 0.0120 0.0144
Chinese (SG) 0.0575 0.0599 0.0243 0.0272 0.0202 0.0226 0.0152
Indian (SG) 0.0738 0.0712 0.0601 0.0730 0.0394 0.0452 0.0474 0.0607
19 66
20
The results of PCA for the first two principal components (PC) are shown in Figure 2.2, whereby the first principal component (x-axis) and the second principal component (y-axis) describe 2.6% and 2.3% of the variation between individuals, respectively. PC1 separates the Indians from the other populations whereas PC2 separates the two Negrito populations from others. As a result, three broad groupings were observed corresponding to the Negritos, Indians and the rest which consist of the Bidayuh, Temuan, Malays, indigenous Taiwanese and Chinese. Several Indian and Malay individuals in Singapore were observed to be in intermediate positions between their respective population clusters. This suggests that these individuals are hybrids of the two populations (Indians and Malays) and may be the result of fairly recent admixture. The Negritos also appeared to experience some varying degree of admixture, as seen by the way some individuals, especially in the Jehai, seem to form a gradient along PC2 heading towards the Malay/Temuan/Bidayuh/Chinese cluster in Figure 2.2. This „comet-like‟ pattern could also be observed in the Temuan, Bidayuh, and Malay-MN when PCA was rerun after omitting the Negrito, Indian and indigenous Taiwanese individuals. PC1 in Figure 2.3(A) separates the Temuan and Bidayuh populations from the others while PC2 separates the Temuan and Bidayuh from the Malays and Chinese. The third PC (Fig. 2.3(B) shows some substructure within the Temuan population, whereas PC4 displays the „comet-like‟ pattern in the Malay-MN.
To further investigate admixture and population structure in these populations, we performed Bayesian clustering implemented in the STRUCTURE software in which individuals were assigned into k number of clusters. Starting from k=2, the number of k is increased until the k value showing the greatest posterior probability was reached, in this case k=6. The results of STRUCTURE analysis from k=2 to k=6 is shown in Figure 2.4. Each individual is represented by a vertical bar and their respective ancestry components are indicated by different colors. Multiple ancestry clusters within an individual (multiple colors in a single vertical bar) signifies an admixed individual. At k=2, the two population subdivision corresponds to the Negritos
21
(Jehai, Kensiu) and the rest of the populations. As k is increased to 3, the population clusters observed were the Indians, Negritos and the rest. At k=4, there appeared to be a component shared mostly among the Chinese and indigenous Taiwanese. The new population cluster at k=5 corresponds to the Temuan and at k=6, the previous Negrito component was further split into the Jehai and Kensiu. At k=6, the six ancestry components correspond to the Jehai, Kensiu, Indian, Temuan, Bidayuh and Chinese populations. Admixture seems to be a predominant feature based on the STRUCTURE results at k=6.
Similar results were obtained using the frappe software which utilizes maximum-likelihood methods (Fig. 2.4), although the order at which new clusters were formed at k=5 and 6 was different. The ancestry component observed in the Austronesian-speaking populations was highest in the Bidayuh (74%) followed by the Temuan, Malays and was even present in the Chinese at roughly 20%. The ancestry component corresponding to the Chinese and indigenous Taiwanese was also observed in all other Austronesian groups. The three Malay groups have fairly similar ancestry components, with major contributions from the Chinese (45%), Austronesian (25%) and Indian (15%) components. Admixed Indian and Singapore Malay individuals identified from the PCA plots were confirmed in the STRUCTURE analysis.
In order to analyze more closely the „comet-like‟ pattern observed in PCA analysis, the PC coordinates in the Negritos, Temuan and Bidayuh were plotted against ancestry components obtained from STRUCTURE analysis. For the Negritos, the PC2 coordinates from Figure 2.2 was plotted against the Negrito ancestry at k=5 from STRUCTURE analysis. For the Bidayuh and Temuan, the PC2 coordinates from Figure 2.3(A) was plotted against their respective Austronesian ancestry proportion at k=4 from the STRUCTURE analysis. All PC coordinates have been normalized to range from 0 to 1 so that 0 reflects coordinates closest to the Malay cluster and 1 reflects coordinates farthest from the Malay cluster in PCA plots. The results are shown in Figure 2.5. In all three cases, there was high correlation between the PC coordinates
22
and the amount of admixture from STRUCTURE analysis.
23
Figure 2.3: The first two Principal component (PC) analysis plots of individuals. Numbers in parentheses are percent of variation explained by the PC.
23 66
24
Figure 2.4: Principal component (PC) plots of individuals from Bidayuh, Temuan, Malay and Chinese groups. A) PC1 versus PC2 and B) PC3 versus PC4.
25
Figure 2.5: STRUCTURE and frappe output from k=2 to k=6. Each individual is represented by a vertical bar and the proportions of each cluster (k) are represented by different colors. Population labels are listed at the bottom. A) STRUCTURE results; B) frappe results
A
B
26
Figure 2.6: Correlation between Principal component values and STRUCTURE ancestry proportions. A) Negrito ancestry at k=5 vs. principal component (PC)2 coordinates in the Jehai and Kensiu. B) Austronesian ancestry at k=4 vs. PC2 coordinates in the Bidayuh from Figure 2.3. C) Austronesian ancestry at k=4 vs. PC2 coordinates in the Temuan from Figure 2.3. All PC coordinates have been normalized to range from 0 to 1 so that 0 reflects positions closest to the Malay cluster and 1 reflects positions farthest from the Malay cluster in PCA plots.
27
2.3.2 Relationships between Southeast Asian populations
To gauge the relationships between the indigenous populations in Malaysia with other Southeast Asian populations, PCA analysis was performed only on populations from Malaysia, Indonesia, Philippines and Thailand which are listed in Table 2.1. The resulting PCA plot is shown in Figure 2.6. In panel (A), the first PC separates the Malaysian Negritos from the rest while PC2 separates the Melanesians, Indonesians from Nusa Tenggara (Alor, Sumba, Flores islands) and Philippine Negritos from other populations. The majority of Austronesian-speakers with the exception of Indonesians from Nusa Tenggara and the Iraya and Manobo from the Philippines appeared to cluster closely with the Thai populations. Another exception was the Mlabri from Thailand, who appeared as an outlier and they are known to be a population isolate (Oota et al. 2005). To have a closer look at the relationship between Austronesians and Thai populations, PCA was performed after omitting the outlier populations mentioned above. The resulting PCA plot is shown in panel (B). PC1 appears to separate the populations according to an East-West division with the indigenous Taiwanese and Filipinos at one end (East) and the Thais, West Malaysians and Javanese at the other end (West). The second PC separates the Thais from the other Austronesians and the „comet-like‟ pattern in the Temuan and Bidayuh were again observed, similar to Figure 2.3(A).
28
Figure 2.7: PCA plot of Southeast Asians. A) All individuals included. B) After excluding the following individuals: Negritos (Malaysian & Philippines), Melanesian, Indonesians (Nusa Tenggara), Thai (Mlabri)
PC1 (1.3%)
PC2 (1.2%)
Austronesian Negrito (Ph) Negrito (My) Thai
Melanesian
PC1 (0.85%)
PC2 (0.71%)
Filipino
Indigenous Taiwanese Sumatran
Sulawesi Borneo West Malaysia Javanese Thai
A
B
Mlabri
Nusa Tenggara
Bidayuh Temuan
29
2.4 Discussion
This report describes the population substructure and admixture within several indigenous populations as well as the relatively recent migrant populations in Malaysia and Singapore. STRUCTURE and PCA results revealed the presence of admixed individuals in some populations, most notably the admixture between the Singapore Malay and Indians. In this case the admixed individuals from both sides were easily identified by their intermediate positions between parental clusters in PCA plots as well as their ancestral proportions in STRUCTURE analysis. The amount of admixture in these individuals is most likely the result of recent admixture, given their population history.
With regards to the Malays, all three groups appeared very closely related based on PCA, STRUCTURE and Fst distances, despite coming from three separate geographical locations. This observation is consistent with a recent report by Hatin et al. (2011), who showed a close relationship between Melayu Minang and Melayu Kelantan (Malay-MN and Malay-KN in this study, respectively) in a population-based multidimensional scaling plot (their Fig. 2). On average, STRUCTURE ancestry components in the three Malay groups mainly consisted of Chinese ancestry (46%), Austronesian ancestry (30%) and Indian ancestry (18%). In the report by The HUGO Pan-Asian SNP Consortium (Abdulla et al. 2009) which included analysis of 73 Asian populations, three other populations (Malay, Batak and Batak Karo) from Sumatra, Indonesia also had roughly the same proportion of Indian ancestry with the Malays from Malaysia and Singapore but not in other Austronesian populations from nearby islands. This suggests that the current Malay populations in the Malay Peninsula may have originated from Sumatra and admixture with Indians may have occurred before the split. Alternatively, both populations in Sumatra and Malay Peninsula received the same amount of admixture. Linguistic, archaeological and historical evidences seem to indicate that Malays originated from Sumatran populations who themselves originated from an earlier Austronesian migration from
30
South China or Taiwan (Vlieland 1934; Andaya 2001) and results from classical biochemical markers suggested sustained contact and gene flow between Indians and Malays (Teng and Tan 1979).
The „comet-like‟ pattern seen in the PCA plots of the Negritos, Bidayuh, Temuan and Malay-MN was also observed in other indigenous populations from Australia (McEvoy et al. 2010) and Latin America (Bryc et al. 2010). The observed pattern is likely to have been the result of continuous and sustained admixture with surrounding populations, stretching over several generations. While the source of admixture in those Australian aboriginals and Latin Americans included Caucasians, it does not seem the case for the Malaysian indigenous population, as the PCA plot did not reveal any admixture with Europeans (data not shown). Even though there has been continuous contact between Europeans and Malaysians since the 15th century, there has been no evidence of massive gene flow from Europeans to Malaysian populations such as those observed in some South American indigenous populations.
Although the indigenous populations in Malaysia have historically been isolated and had least contact with other groups, the admixture gradient implies that admixture has been an ongoing process. Although the source population for this admixture cannot be exactly determined, results suggest that it may be the Malay populations, given their continuous presence in the Malay Peninsula and neighboring islands. As for the Chinese and Indian populations in Singapore and by extension, Malaysia, they appeared to cluster closely with their respective ancestral populations from South India and South China, respectively, consistent with their recorded history (Vlieland 1934; Andaya and Andaya 1984).
PCA analysis of Southeast Asians using 50,000 genome-wide SNP reveals that the Malaysian Negritos are again unique compared to the rest of their surrounding populations. Interestingly, PC1 in Figure 2.6(A) clearly separates the two Negrito groups from West Malaysia and the Philippines and it appears that the Philippine Negritos are closer to their neighboring
31
Austronesian populations (Iraya and Manobo), probably as a result of more pronounced admixture compared to the Malaysian Negritos. A closer look at the relationship between Austronesian populations in Figure 2.6(B) implies a substructure akin to geographical division. Populations east of the Wallace line (Taiwan, Philippines, Sulawesi) appeared to have a closer genetic affinity to each other whereas populations from West Malaysia, Sumatra, Java and Borneo which formed the Sundaland landmass appeared closely related.
In summary, this chapter reveals in further detail the admixture and genetic substructure within Malaysian and their relationship with other Southeast Asian populations. It demonstrates that the indigenous groups have their own population substructure which is influenced by their surrounding populations. While categorizing individuals into an assumed panmictic population may still be practiced, the presence of admixed individuals should be considered, as their inclusion may affect genetic measures such as Fst as demonstrated here. The clustering patterns of individuals may shed some clues into their population migration histories, particularly in the indigenous groups whose origins have yet to unambiguously explained. More importantly, admixture and population structure within these populations should be taken into consideration, especially when conducting association studies as the presence of population stratification may lead to increased false positive results (Tian, Gregersen, and Seldin 2008; Yamaguchi-Kabata et al. 2008).
32
CHAPTER 3
Complete mitochondrial DNA analysis in indigenous Malaysian
populations
3.1 Introduction
The focus of this chapter is the genetic diversity and population history of Southeast Asians from the point of view of mitochondrial DNA (mtDNA). The use of mtDNA as a genetic marker for population studies was popular due to such features including high copy number, high substitution rate and lack of recombination. Furthermore, the maternal mode of inheritance makes it possible to trace back lineages and infer histories relating to female migration.
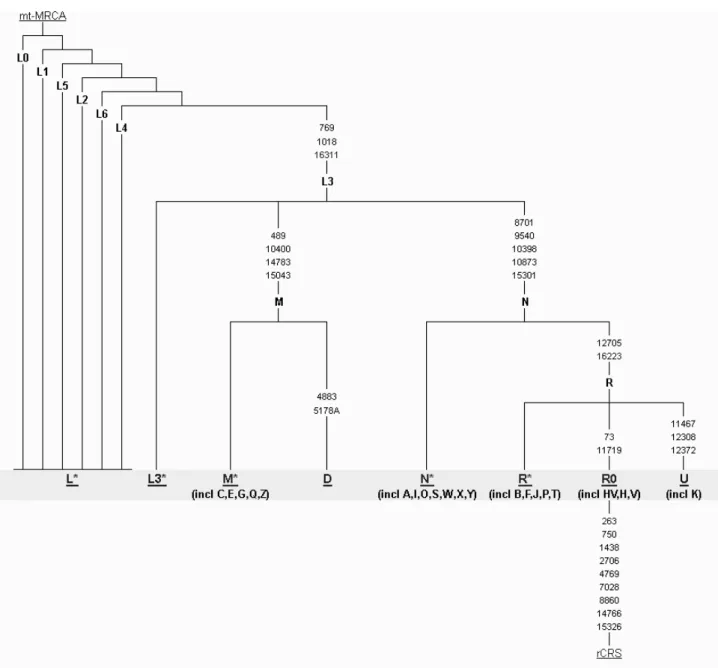
The mtDNA is a circular molecule 16,569 base pairs (bp) in length. The first complete human mtDNA sequence was published by researchers at Cambridge University (Anderson et al 1981) but was later revised by Andrews et al. (1999) to produce the revised Cambridge Reference Sequence (rCRS). Mitochondrial haplogroups are defined by specific nucleotide substitutions or other features such as a 9-bp deletion on the mtDNA molecule. Haplogroups are labeled with a series of alphanumeric characters as shown in Figure 3.1. The three major haplogroups or macrohaplogroups are L, M and N and they display a characteristic geographical distribution in human populations. Macrohaplogroup L is mostly restricted to African populations whereas M and N are found mostly, but not restricted to, Asians and Europeans, respectively. The 917 bp non-coding region of the molecule is often referred to as D-loop or HyperVariable Region (HVR) and is often used for population genetic studies or even in forensics. This is because it is relatively short and easier to sequence but more importantly, it has a higher substitution rate compared to the coding-region of the molecule. Therefore, there are more substitutions in the D-loop region, making it useful for defining haplogroups and
33
subsequently to discern populations and/or individuals. However, the variable rate of mutation in the D-loop region makes it not too suitable to infer the timing of evolutionary events.
There have been several previous studies using mtDNA sequences in Southeast Asian populations which attempted to address the Austronesian expansion. As mentioned in Chapter 1, the „Out of Taiwan‟ model was largely supported by archaeological data and the linguistic phylogeny of Austronesian languages. It assumes a recent and rapid expansion from Taiwan to Polynesia with little or no admixture between the expanding and extant populations in what was called the „express train‟ model (Diamond 1988; Gray and Jordan 2000). The model was later
expanded to involve a series of pulses and pauses but remains fundamentally similar (Gray, Drummond, and Greenhill 2009). On the other side of the discussion is the „slow boat‟ model, which posits an island Southeast Asian origin of Polynesians based on the age estimates of haplogroup B4a1a, also known as the Polynesian motif (Oppenheimer and Richards 2001). However, those previous studies mostly concentrated on the origins of the Austronesians from the Polynesian islands. In the Austronesians from island Southeast Asia, studies also came to inconsistent conclusions, with some reports supporting the „Out of Taiwan‟ model (Trejaut et al.
2005; Tabbada et al. 2009) while others proposed earlier migrations from the Asian mainland during the late-Pleistocene to early-Holocene period (Hill et al. 2006; 2007).
A more comprehensive look into the mtDNA diversity in the indigenous groups in Malaysia, who include descendants of the earliest settlers of the region, should provide more insight into the origins and migration of humans in Southeast Asia. Under this current backdrop, an in-depth analysis of complete mtDNA sequences from four indigenous groups in Malaysia who represent the ancient migrants (Negritos) and subsequent migrants (Austronesians) to the Southeast Asian region was conducted. By exploring the diversity of mtDNA in these four groups and comparing them with other populations within the Southeast Asian region, we hope to shed light on some questions regarding their demographic and migration histories.
34
Figure 3.1: Phylogenetic tree of human mtDNA. Mitochondrial DNA haplogroups are shown as alphanumeric letters in bold. The numbers on the branches indicate the position of substitutions that define the haplogroup. rCRS stands for revised Cambridge Reference Sequence. Image source: http://www.phylotree.org/
35
3.2 Material & methods
3.2.1 Sample collection and ethical approval
In addition to samples from the Jehai, Temuan and Bidayuh which were previously collected as part of my Master‟s thesis (Jinam 2007), samples from an Orang Asli group from West Malaysia called the Seletar were also included. The new samples from the Seletar were collected on a sampling trip in Johor, West Malaysia with collaborators from the Monash University Sunway Campus and University of Malaya in July 2009. The Jehai, Temuan and Seletar represent the Orang Asli groups from West Malaysia while the Bidayuh are one of the indigenous groups from Borneo. The Jehai are further grouped as Negritos while the Temuan and Seletar are classified as Proto-Malays. Linguistically, the Jehai speak Austro-Asiatic languages whereas the Temuan, Seletar and Bidayuh speak Austronesian languages.
Additionally, mtDNA haplogroup frequencies in the Kensiu, another Negrito group from West Malaysia, were kindly provided by a colleague, Miss Hong Lih Chun from the Department of Molecular Medicine, University of Malaya (Hong LC, unpublished data). Haplogroup frequencies and complete mtDNA sequences in other populations were obtained from available literature. The list of populations used in this study is in Table 3.1 whereas their geographical locations are depicted in Figure 3.2. This study has been approved by the respective ethical committee boards of the National Institute of Genetics Mishima, University of Malaya and Monash University Sunway Campus.
36
Table 3.1: Population information used for mtDNA analyses Population
label
Ethnicity Location Data
useda
References
1 Jehai West Malaysia 1,2 This study
2 Temuan West Malaysia 1,2 This study
3 Seletar West Malaysia 1,2 This study
4 Bidayuh Borneo 1,2 This study
5 Kensiu West Malaysia 2 Hong LC, unpublished data
6 Batek West Malaysia 1,2 Macaulay et al 2005; Hill et al 2006
7 Mendriq West Malaysia 2 Hill et al., 2006
8 Temiar West Malaysia 2 Hill et al., 2006
9 Semelai West Malaysia 1,2 Macaulay et al 2005; Hill et al 2006
10 Jakun West Malaysia 2 Hill et al., 2006
11 Malay West Malaysia 2 Hill et al., 2007
12 Iban Borneo 2 Simonson et al., 2011
13 Kadazan Borneo 1 Soares et al, 2008
14 Alor Indonesia 2 Hill et al., 2007
15 Ambon Indonesia 2 Hill et al., 2007
16 Banjarmasin Indonesia 2 Hill et al., 2007
17 Java Indonesia 2 Hill et al., 2007
18 Bali Indonesia 2 Hill et al., 2007
19 Lombok Indonesia 2 Hill et al., 2007
20 Sumba Indonesia 2 Hill et al., 2007
21 Sumatra Indonesia 2 Hill et al., 2007
22 Sulawesi Indonesia 2 Hill et al., 2007
23 Besemah Indonesia 1,2 Gunnarsdottir et al, 2011
24 Semende Indonesia 1,2 Gunnarsdottir et al, 2011
25 Manobo Philippines 1,2 Gunnarsdottir et al, 2010
26 Mamanwa Philippines 1,2 Gunnarsdottir et al, 2010
27 Surigaonon Philippines 1,2 Gunnarsdottir et al, 2010 28 Filipino Philippines 1,2 Hill et al., 2007; Tabada et al
2009
29 Indigenous
Taiwanese
Taiwan 1,2 Trejaut et al, 2005; Hill et al., 2007; Soares et al 2008
30 Thai Thailand 2 Hill et al, 2006
31 Vietnamese Vietnam 1,2 Jin et al, 2009; Hill et al, 2006
32 Cham Vietnam 1 Peng et al, 2010
33 South Chinese China 1,2 Ingman et al, 2000; Kong et
al., 2003; Kong et al., 2006; Hill et al., 2007; Kong et al., 2011
37
34 Great
Andamanese
Andaman Islands 1 Thangaraj et al 2005, Barik et al, 2003
35 Onge Andaman Islands 1 Thangaraj et al 2005, Barik et
al, 2003
36 Nicobarese Andaman Islands 1 Thangaraj et al 2005, Barik et al, 2003
37 Australian
Aboriginal
Australia 1 Ingman et al, 2000; Ingman et al 2003; van Host Pelikan 2006
38 Papuan Papua New
Guinea
1 Ingman et al, 2000; Macaulay et al 2005
39 Melanesian Melanesia 1 Freidlander et al 2007
40 Samoan Polynesia 1 Ingman et al, 2000
41 African Africa 1 Ingman et al, 2000
a- Data used: 1) Complete mtDNA sequences; 2) mtDNA haplogroup frequencies
38
Figure 3.2: A map of Southeast Asia indicating geographical positions of populations used for analysis. Numbers indicate the locations of populations listed in Table 3.1. Not shown on the map are Australian Aboriginals, Papuans, Melanesians, Samoans and Africans. Areas shaded light gray indicate the extent of the landmass up to the Last Glacial Maximum following Hill et al (2007).
39 3.2.2 Complete mitochondrial DNA sequencing
Complete mtDNA sequencing was performed in a total of 68 samples using 11 pairs of PCR primers and 32 sequencing primers from (Torroni et al. 2001). The list of primer sequences are shown in the Appendices. A slight modification to the protocol involved optimizing annealing temperatures for all PCR reactions to 60°C, instead of 55ºC as reported in their paper. For details of gradient PCR reactions used for optimization, refer to the Appendices. PCR products were purified using ExoSAP-IT reagent before being subjected to sequencing reactions using the BigDye Terminator kit (Applied Biosystems). Capillary separation was performed on the ABI3130xl Genetic Analyzer (Applied Biosystems). For each sample, the resulting 32 traces were aligned to the revised Cambridge Reference Sequence (Genbank ID NC_012920.1) to obtain the consensus sequence.
In addition, complete mtDNA sequences in a total of 18 samples from the Jehai (1), Temuan (10) and Bidayuh (7) were generated using the Illumina Genome Analyser at the Max Planck Institute for Evolutionary Anthropology in Leipzig, Germany under the guidance of Mark Stoneking. The details of the methodology were described previously (Gunnarsdottir et al. 2010). In total, complete mtDNA sequences were obtained from 86 individuals (24 Jehai, 18 Temuan, 21 Seletar and 23 Bidayuh).
3.2.3 Data analysis
Individuals were assigned to mtDNA haplogroups according to nomenclature found at http://www.phylotree.org (van Oven and Kayser 2009). Mitochondrial DNA haplogroup frequencies from the populations listed in Table 3.1 were used for Principal Component Analysis (PCA) using R software package (http://www.R-project.org).