Brown Dwarfs and Planetary Mass Objects
in Star Forming Regions:
Toward the Low Mass End of Initial Mass Function
Takuya Suenaga
Doctor of Philosophy
Department of Astronomical Science
School of Physical Sciences
The Graduate University for Advanced Studies
2013
Abstract
Brown dwarfs (BDs) and planetary mass objects (PMOs) are substellar mass objects between the planetary and stellar mass regimes (0.013 ≤ M/M⊙ ≤ 0.075 where M is an object’s mass and M⊙is the solar mass). Since their discovery in the 1990s, hundreds of examples have been reported, and NASA’s WISE mission has recently added another hundred BDs (Kirkpatrick et al., 2011). However, the typical thermal Jeans mass in molecular cloud cores is ∼ 1 M⊙(Larson, 1999, and references therein), which means that gravitational collapse of molecular clouds is expected to form stars and not BDs. Therefore, the formation mechanism of BDs and in particular that of PMOs, is still unclear.
Several theories for the formation of BDs have been suggested, including turbulent fragmentation (Padoan & Nordlund, 2004; Boyd & Whitworth, 2005), stellar embryo ejection through dynamical in- teractions (Reipurth & Clarke, 2001; Bate et al., 2002), disk fragmentation and scattering (Whitworth & Stamatellos, 2006a; Goodwin & Whitworth, 2007a) and photo-evaporation of embryos by nearby hot stars (Whitworth & Zinnecker, 2004). None of these theories have yet proven conclusive. Star forming theories also predict the existence of PMOs with a lowest mass limit of 0.001–0.010 M⊙related to the opacity of the contracting object, known as opacity-limited fragmentation (e.g., Low & Lynden-Bell, 1976; Rees, 1976; Boss, 2001; Whitworth & Stamatellos, 2006b).
Since they are not massive enough to sustain hydrogen burning and they become fainter with time, sub- stellar objects are very faint in the Galactic field. Therefore, only a few PMOs have been reported in the field (e.g., Cushing et al., 2011). In contrast, substellar objects in star forming regions have much higher luminosities because of their gravitational energy release and therefore many BDs as well as isolated PMOs and planetary mass companion candidates have been identified (Tamura et al., 1998; Oasa et al., 1999; Lu- cas & Roche, 2000; Zapatero Osorio et al., 2000; Neuh¨auser et al., 2008; Kuzuhara et al., 2011). Therefore, it is important for clarification of their formation processes to determine their properties, such as binarity, spatial distribution and especially initial mass function (IMF) in star forming regions.
In order to determine the low mass end of the IMF, we conducted a very deep large survey of BDs and PMOs in two well-known star forming regions, the Orion Nebular Cluster (ONC) and the Taurus Molecular Cloud (TMC). These regions are nearby rich, young stellar clusters and therefore are the most suitable for searching for BDs and PMOs.
We conducted a spectroscopic survey program in the ONC using MOIRCS mounted on the Subaru tele- scope and ISLE mounted on the Okayama 1.88-m telescope. We present 12 near-infrared spectra of BD candidates. We newly identify two BD candidates and a BD/planetary boundary mass object. We find that several young stellar candidates appear older in the HR diagram. The faintness can be explained by light
i
ii
scattering from the central star due to the circumstellar structure, or episodic accretion. Previous studies (Kumar & Schmeja, 2007; Andersen et al., 2011) suggested that the substellar IMF in Orion depends on the distance to the central region, which means that the IMF in Orion is not universal locally. However, since previous works have been based on the photometric data, the radial dependence of the IMF could be explained by contamination of the Galactic field stars. Based on the spectroscopic data, we first show that the substellar IMF in the outer region (r < 6′) is consistent with the central region. The universal IMF reported around the central OB stars in Orion means that the impact of OB star’s photo-evaporation process on the substellar formation is unimportant.
In the TMC, we obtained deep optical/infrared images using the Subaru/Suprime-Cam and the Okayama 1.88-m/ISLE. Since the Taurus region is widely spread in the sky, previous works have been incomplete and limited to sensitivities above 20 MJup(e.g., Brice˜no et al., 2002a; Guieu et al., 2006; Luhman, 2006; Luhman et al., 2009), where MJup is the mass of Jupiter. Combining our deep images with other infrared data, we achieved a sensitivity down to 6 MJupwith a visible absorption of AV <4, the best sensitivity to date. Based on several color selections and proper motion analysis, we selected two PMO candidates and obtained spec- tra using the Subaru/IRCS. As a result, we did not find any PMOs in our field-of-view (FOV; 1.85 deg2). In contrast to the abundance of PMOs of 10–20% in other star forming regions, our results suggest the abundance of low mass BDs and PMOs is quite low in the TMC. The lack of PMOs could be explained by PMOs being ejected out of the FOV, however it is unlikely that the low stellar density of Taurus promotes an ejection process from multiple stellar/planetary systems. Another explanation is that the minimum Jeans mass is higher in the TMC. However, since the previous theories predict the formation of 1–10 MJupobjects in star forming regions, a different formation mechanism is required to explain the abundance of PMOs in the TMC.
Acknowledgement
First of all, I would like to send my special thanks to Prof. Motohide Tamura for supervising me for 5 years. He has always encouraged me to challenge new things, and given me many opportunities to start new collaborative research, to attend his leading observational projects (SEEDS; IRSF; IRD) and to access a lot of data taken by several telescopes. Without his continuous encouragement and stimulating discussion, I could have never finished this thesis.
I also deeply thank Dr. Masayuki Kuzuhara for initiating me into observational astronomy and near- infrared spectroscopy. He has taught me a lot of things from general skills for research (e.g., presentation; writing paper; programming) to various knowledge of astronomy (e.g., observational technique; data reduc- tion; star/planet formation theories). Discussions with him are always exciting and large part of this thesis is based on discussion with him.
I would like to acknowledge Profs. Tomonori Usuda, Wako Aoki and Satoshi Mayama. They have also supervised me and supported my research. Their insightful comments have significantly improved this thesis and presentation for defense.
I would like to thank Dr. Miki Ishii for kindly providing me a chance of observing my targets using the Subaru telescope, whose spectroscopic data is absolutely necessary for discussion in this thesis. I’m also grateful to Dr. Tomoyuki Kudo for acquiring the spectroscopic data at the Subaru telescope instead of me.
I am indebted to Dr. Norio Narita who has kindly observed a lot of my targets using a part of his alloca- tion times of the Okayama 1.88m/ISLE. Dr. Akihiko Fukui has also observed many objects of our targets, and provided me the reduction pipeline developed by himself for ISLE data. I thank Dr. Kenshi Yanagisawa for support to use ISLE since it was a PI instrument.
I would like to thank Dr. Michael W. McElwain for collaborating to apply the proposals to the Gemini telescope. His great efforts have significantly improved my observational strategy. Dr. John P. Wisniewski has kindly provided me a chance of observation with the 3.5-m telescope at Apache Point Observatory. I also appreciate Dr. Philip W. Lucas who has given invaluable comments on my first paper and helpful advices in applying proposal for a telescope.
I’m thankful to referees, Profs. Nobuharu Ukita, Yoichi Takeda, Fumitaka Nakamura, Koji Sugitani, and Masahiro Machida. I also would like to express my gratitude to the PhD students of NAOJ, Mr. Yoshi- fumi Ishizaki, Mr. Keisuke Imase, Mr. Yasuhiro Takahashi, and all of colleagues of NAOJ/GUAS. I am deeply grateful to my best friend, Asuka Murata for her strong encouragement. Finally, my heartfelt appre- ciation goes to my family, my young brother, Kazuya, my dog, Punch, and especially my mother, Kayoko for continuous support.
iii
Contents
1 Introduction 1
1.1 Form of the Initial Mass Function . . . 1
1.2 Substellar IMF in Various Galactic Clusters . . . 2
1.3 Our Research Motivations and Focuses . . . 4
1.3.1 Universality of IMF . . . 4
1.3.2 IMF Bottom Limit . . . 7
1.3.3 Formation of BDs and PMOs . . . 7
1.4 Instruments Used and Star Forming Regions Considered in This Thesis . . . 9
1.4.1 Instruments . . . 9
1.4.2 Star Forming Region 1: Orion Nebular Cluster . . . 10
1.4.3 Star Forming Region 2: Taurus Molecular Cloud . . . 11
1.5 Originality and Outline of This Thesis . . . 13
2 Spectroscopy of Very Low Mass Brown Dwarfs in Orion Nebular Cluster 16 2.1 Observation and Data . . . 16
2.1.1 Target Selection . . . 16
2.1.2 Multi-Object Spectroscopy . . . 17
2.1.3 Long-Slit Spectroscopy . . . 17
2.2 Data Reduction . . . 20
2.2.1 Semi-Automatic Reduction Pipeline . . . 20
2.3 Analysis . . . 22
2.3.1 BT-Settl model . . . 22
2.3.2 χ2− f itting . . . . 22
2.4 Discussion . . . 26
2.4.1 HR diagram . . . 26
2.4.2 Stellar to substellar mass number ratio . . . 27
2.4.3 Sample completeness . . . 30
2.4.4 Implications on the star formation in the ONC: Comparison of the measured number ratio with other studies . . . 31
iv
CONTENTS v
3 Searching for Planetary Mass Objects in the Taurus Molecular Cloud 34
3.1 Observation and Data . . . 34
3.1.1 Optical Imaging . . . 34
3.1.2 Near-infrared Imaging . . . 35
3.1.3 UKIDSS Galactic Cluster Survey / Galactic Plane Survey . . . 35
3.1.4 Spitzer and WISE Catalogue . . . . 38
3.1.5 Near-Infrared Low Resolution Spectroscopy . . . 38
3.2 Data Reductions . . . 39
3.2.1 Optical Imaging Data . . . 39
3.2.2 Near-Infrared Imaging Data . . . 40
3.2.3 Near-Infrared Spectroscopic Data . . . 42
3.3 Analysis . . . 43
3.3.1 Sample Selection for Spectroscopy . . . 43
3.3.2 Estimate of Photometric Physical Parameters . . . 50
3.3.3 Estimated Spectroscopic Physical Parameters . . . 56
3.3.4 Proper Motion Analysis . . . 56
3.4 Discussion . . . 61
3.4.1 Survey Completeness . . . 61
3.4.2 Observational Features of Individual Objects . . . 65
3.4.3 Comparison with Luhman et al. (2009) . . . 73 3.4.4 Implications of the star formation in the TMC: Frequency of Planetary Mass Objects 73
4 Summary and Conclusions 77
List of Tables
2.1 Summary of observed objects . . . 19
2.2 The result of χ2−fitting . . . 29
2.3 Star to substellar number ratio in the ONC . . . 31
3.1 Summary of the Suprime-Cam observations . . . 35
3.2 Summary of the ISLE observations . . . 37
3.3 Summary of the IRCS observations . . . 39
3.4 Astrometry data . . . 45
3.5 Optical/near-infrared photometry data . . . 46
3.6 Selection status of previously known stellar and BD mass objects in our FOV . . . 47
3.7 Photometric physical parameters . . . 51
3.8 Spectroscopic physical parameters . . . 56
3.9 Astrometric properties in the catalogue used to derive proper motion . . . 58
3.10 Calculated AV from synthetic photometry given by the input AV . . . 65
3.11 Photometric physical parameters of the PMO candidates . . . 65
3.12 Typical absolute K-band magnitude of carbon stars and M-type giants and the correspond- ing distance of our candidates. . . 66
3.13 Photometric parameters of other substellar mass candidates . . . 68
3.14 Abundance of planetary mass objects in various star forming regions . . . 74
vi
List of Figures
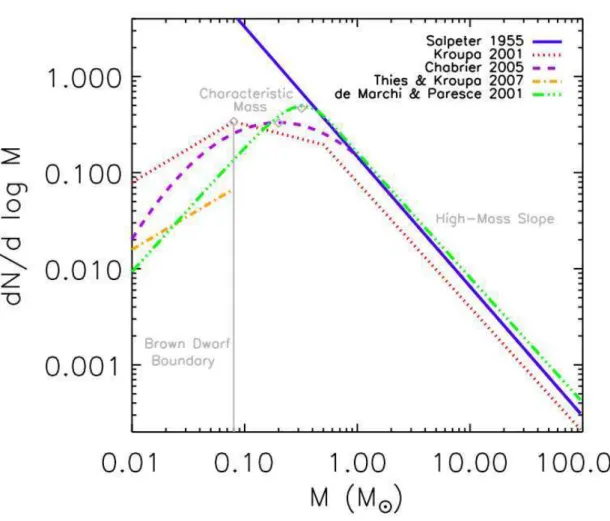
1.1 IMF functional forms proposed by various authors from fits to Galactic stellar data (Offner
et al., 2013) . . . 3
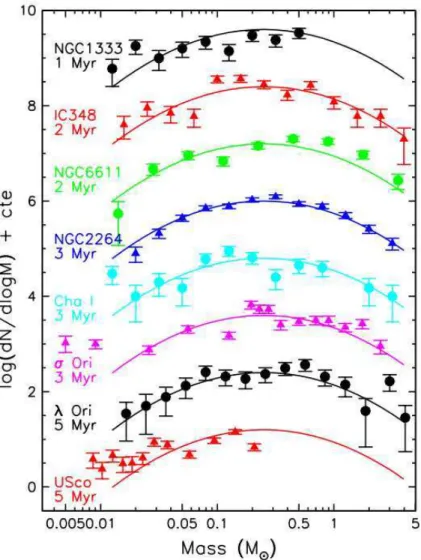
1.2 Recent IMF estimates for eight star forming regions (Offner et al., 2013) . . . 5
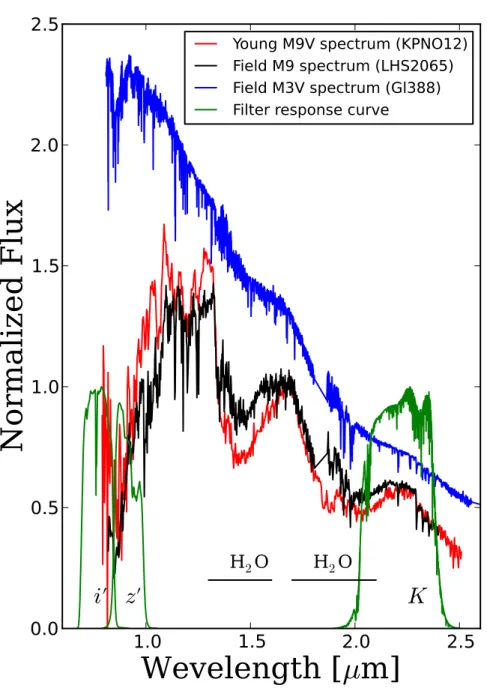
1.3 Comparison of spectra and the advantage of using optical wavelengths . . . 15
2.1 Our FOV overlaid with the dust continuum image of Lucas et al. (2005). . . 18
2.2 Near-infrared observed spectra . . . 23
2.3 Teff vs absolute H-band HR diagram for the 12 objects in our spectroscopic sample . . . . 28
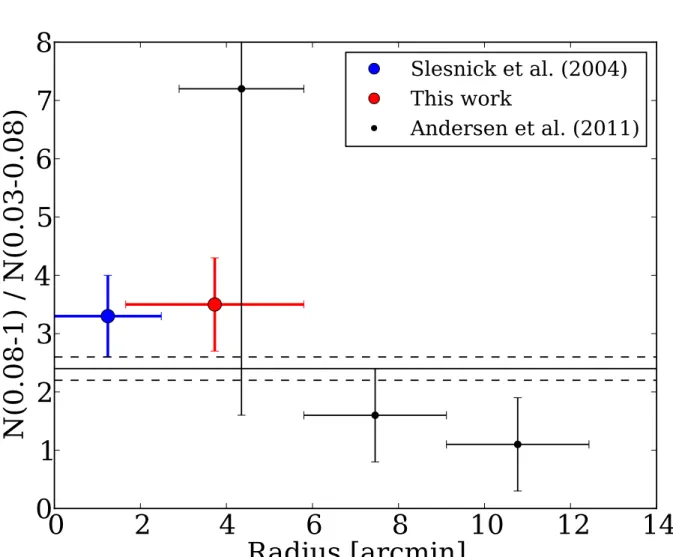
2.4 Ratio of low-mass stars to BDs as a function of radius . . . 33
3.1 Our FOV in Taurus. . . 36
3.2 Histogram of the objects in the TAUIII1 field. . . 41
3.3 Color–magnitude diagram . . . 48
3.4 Two color diagram of all observed objects . . . 49
3.5 Result of SED fitting with two free parameters (Teff, log(g)) . . . 52
3.5 . . . 53
3.5 . . . 54
3.6 Photometric Teff vs absolute J−band HR diagram. . . . 55
3.7 IRCS observed spectra and best-fit synthetic spectra. . . 57
3.8 Proper motion distributions of field stars, known members and substellar candidates in Taurus 60 3.9 Input AV vs calculated AV. . . 63
3.10 Input Teff vs calculated Teff. . . 64
3.11 Result of SED fitting with three free parameters (Teff, log(g), AV) . . . 69
3.11 . . . 70
3.11 . . . 71
3.12 Photometric Teff vs absolute J−band HR diagram. . . . 72
vii
Chapter 1
Introduction
The IMF (initial mass function) has been first introduced by Salpeter (1955) as a convenient way of parame- terizing the relative number of stars as a function of their mass. The IMF provides an essential observational input to many astrophysical studies, and various predictive theories of star formation have been proposed to explain its shape, as well as whether it is universal or is instead sensitive to environmental conditions. Nearly 60 years after being first proposed, Salpeter’s IMF is still considered the standard for stars above 1 M⊙, where M⊙is the solar mass. The development of observational instruments and techniques has enabled the substellar mass population below 1 M⊙to be revealed, and the analytical form of stellar IMF has been extended to explain the distributions of the substellar population. Recent deep observations have achieved a sensitivity below the mass of the hydrogen burning limit (0.075 M⊙) in several young stellar clusters. In order to reveal the shape of the substellar IMF, as well as the population in the planetary mass regime (< 0.013 M⊙), we have conducted a large deep survey in very young star forming regions. In this chap- ter, we introduce the definition of the IMF, discuss previous works from the substellar to planetary mass regimes, present the formation theory of brown dwarfs (BDs) and planetary mass objects (PMOs) , and consider previous studies of star forming regions.
1.1 Form of the Initial Mass Function
In 1955, Salpeter (1955) suggested a power-law IMF to explain the stellar number distribution in Galactic field regions:
Φ(log(m)) = dN/d log(m) ∝ m−Γ (1.1)
where m is the stellar mass, N is the number of stars and Γ ∼ 1.35. This single power law IMF is known as the Salpeter IMF.
In the period 1980–1990, observational technology developed significantly and the observable range of stellar masses was extended to below the solar mass. In order to explain the stellar distribution by the IMF of the extended mass range, Kroupa et al. (1993) suggested a multi-segment power law for the IMF:
1
1.2. SUBSTELLAR IMF IN VARIOUS GALACTIC CLUSTERS 2
χ(m) = dN/dm ∝ m−α (1.2)
where α = Γ + 1 is derived as follows:
χ(m) = 1/m(ln 10)Φ(log m) (1.3)
This type of IMF is known as the Kroupa IMF, and the slope of the Salpeter IMF is described by α = 2.35. The log-normal IMF was suggested by Miller & Scalo (1979):
Φ(m) ∼ exp((log m − log mc)2
2σ2 ) (1.4)
where mcis the mean mass and σ is the standard deviation of the mass distribution . Chabrier (2003, 2005) developed a form of the IMF to fit the substellar number distribution with a power-law tail above the solar mass. The log-normal IMF is called the Chabrier IMF. Another functional form was proposed by de Marchi
& Paresce (2001) as a truncated exponential where dN ∝ M−α(1 − exp[(−M/Mp)−β])dM .
Above ∼ 0.2 M⊙, the multi-segment power law and log-normal agree very well, as shown by Figure 1.1. However, the form of the IMF at low masses is still relatively uncertain and subject to ongoing debate. For instance, Chabrier IMF assumes that the stellar IMF smoothly connects to the substellar IMF. On the other hand, Thies & Kroupa (2007) have proposed a discontinuity in the IMF at the stellar/substellar boundary and suggested that the discontinuity implies a difference in the formation processes in the two mass ranges.
1.2 Substellar IMF in Various Galactic Clusters
From the early stages of IMF study, a power-law IMF with α = 2.35 is usually adopted to the Galactic field stellar population above 1 M⊙. Between 0.1 and 0.8 M⊙, the IMF is relatively well constrained due to recent studies based on local stars with Hipparcos parallax (Reid et al., 2002) and a much larger sample of field stars with less accurate photometric distances (Covey et al., 2008; Bochanski et al., 2010). The results of these studies suggest the single star IMF at low masses is well described by a power law with α ∼ 1.1.
Extending the study down to the BD mass regime requires observing these objects in young star forming regions, where these objects are young, since BDs and PMOs become fainter with time due to a lack of energy to burn hydrogen. The UKIDSS Galactic Cluster Survey is the deepest and largest survey covering nearby clusters with a wide range of age (1–600 Myr) using the WFCAM camera mounted on the 3.8-m UKIRT telescope. This survey has revealed the substellar IMF in several rich stellar clusters, including IC4665 (Lodieu et al., 2011a), Pleiades (Lodieu et al., 2007, 2012a), α Per (Lodieu et al., 2012b), Praesepe (Boudreault et al., 2012) and Upper Sco (Lodieu et al., 2007; Lodieu, 2013). The results are mainly based on infrared photometry and astrometric analysis, and agree well with previous studies of the Galactic field, indicating that the IMF is well represented by a power law with α ∼ 0.6 in the mass range 0.03–0.5 M⊙
1.2. SUBSTELLAR IMF IN VARIOUS GALACTIC CLUSTERS 3
Figure 1.1: IMF functional forms proposed by various authors from fits to Galactic stellar data (Figure 1 of Offner et al., 2013). With the exception of the Salpeter slope, the curves are normalized such that the integral over mass is unity. When comparing with observational data, the normalization is set by the total number of objects, as shown in Figure 1.2.
1.3. OUR RESEARCH MOTIVATIONS AND FOCUSES 4
or log-normal with a peak mass around 0.2–0.3 M⊙ and σ ∼ 0.5. Note, however, that in the lower mass range of Upper Sco below 0.03 M⊙, an excess of low-mass BDs has been reported, which may result from uncertainties in the mass–luminosity relation at very low masses and cluster ages (Lodieu, 2013). A large systematic survey, called the Substellar Objects in Nearby Young Clusters (SONYC) project, has been conducted in several star forming regions, including NGC1333 (Scholz et al., 2009, 2012b,b), ρ Oph (Geers et al., 2011) and Cha I (Muˇzi´c et al., 2011, 2012). This project was established to study a large low-mass population from the BD to planetary mass regimes in young star forming regions (< 10 Myr) using a wide FOV camera (Suprime-Cam) and a multi-object slit spectrograph (MOIRCS; FMOS) mounted on a large telescope (Subaru; VLT). The project has made a significant effort in studying NGC1333 to achieve completeness down to several Jupiter masses It has been shown that the IMF of α = 0.61 (0.015 ≤ M/M⊙< 0.7) is consistent with the Kroupa IMF. For σ Orionis, which is a well-studied field of PMOs (e.g., Caballero et al., 2007; Bihain et al., 2009), Pe˜na Ram´ırez et al. (2012) have conducted wide (∼ 0.78 deg2) and deep (translated masses down to ∼ 0.004 M⊙) optical/infrared imaging based on VISTA Orion survey data (Petr-Gotzens et al., 2011). They have reported that the σ Orionis cluster contains as many BDs (69 sources, 0.012−0.072 M⊙) and PMOs (37 sources, 0.004–0.012 M⊙) as low-mass stars (104 sources, 0.072– 0.25 M⊙), and the IMF in the cluster could be flatter than the Galactic field IMF , similar to the case for Upper Sco. A more comprehensive review has been presented in Bastian et al. (2010) and Jeffries (2012).
1.3 Our Research Motivations and Focuses
Our main goal is to provide new insights into the fields of low-mass star formation: the universality of IMF; the bottom of IMF; formation of BDs and PMOs. In this section, we introduce the recent studies related with theses topics.
1.3.1 Universality of IMF
It is critically important to reveal whether the IMF is universal or is instead sensitive to environmental con- ditions is of critical importance. Although the shape and universality of the IMF is still under investigation, studies of the Galactic field, star forming regions, young open clusters and old globular clusters suggest that the vast majority were drawn from a universal IMF, as seen in Figure 1.2. Andersen et al. (2008) have sug- gested that the ratio of stars to BDs (> 30 MJup) in seven young clusters can be explained by a log-normal IMF. Also, the characteristic mass of the IMF is very shallow (∼ 0.1–0.4 M⊙) in spite of the various initial conditions (Bastian et al., 2010), except for the Taurus Molecular Cloud (TMC) in which the characteristic mass is higher (∼ 0.8 M⊙) and a lack of substellar mass objects has been reported (e.g., Brice˜no et al., 2002a). Luhman et al. (2009) has updated the Taurus IMF based on Spitzer, X-ray data and follow-up spectroscopy, and found a 0.04% chance from a Kolmogorov–Smirnov test that the Taurus IMF could be drawn from the same parent distribution as the IC348 and Chameleon I IMFs. Previous explanations for the unusually high peak mass in Taurus have generally involved a higher average Jeans mass compared to other regions (Brice˜no et al., 2002a; Goodwin et al., 2004). A recent numerical simulation by Bonnell et al.
1.3. OUR RESEARCH MOTIVATIONS AND FOCUSES 5
Figure 1.2: Recent IMF estimates for eight star forming regions (Figure 2 of Offner et al., 2013): Scholz et al. (NGC1333, 2012a); Alves de Oliveira et al. (IC348, 2013), Oliveira et al. (NGC6611, 2009); Sung
& Bessell (NGC2264, 2010); Luhman (Cha I, 2007); Pe˜na Ram´ırez et al. (σ Ori, 2012); Bayo et al. (λ Ori, 2011); Lodieu (Upper Sco, 2013). The error bars represent the Poisson error for each data point. The solid lines are not a fit to the data, but are a log-normal form proposed by Chabrier (2005) for the IMF, normalized to best follow the data.
1.3. OUR RESEARCH MOTIVATIONS AND FOCUSES 6
(2011) has also reproduced the variations in the peak mass and shape of the IMF between Taurus and other clusters. They included gravitational fragmentation of infalling gas into a stellar cluster and therefore the gravitational potential, and thus the object density, in the cluster might also be a critical parameter for the formation of substellar mass objects.
To date, the substellar population has been determined for several young clusters. However, since many observations of substellar objects are still spatially limited, such studies are biased to the central regions or high stellar density regions in the clusters. Reipurth & Clarke (2001) suggested that proto-BDs ejected from multiple protostellar systems generate different velocity and spatial distributions from the massive stars. These predictions provide valuable motivation for a wide range of observational studies distinguish- ing the formation processes of star and substellar mass objects. Note that the typical ejection velocities are at most a few km/s, and therefore comparable with the velocity dispersion between neighboring cores and the velocity dispersion for more massive stars (Bate et al., 2003). However, there should be a high-velocity tail in the distribution of ejection velocities, yielding an extended halo of BDs. Therefore, in order to reveal the whole population and their formation , analyses based on the data with a wider FOV have been conducted for several young clusters. The Orion Nebular Cluster (ONC) is a rich and compact stellar cluster, which is expected to exhibit frequent ejection due to dynamical interactions. Andersen et al. (2011) have conducted wide FOV imaging using HST/NICMOS and revealed the spread in the population of the BD mass regime for massive stars. A different spatial distribution has been suggested by Kumar & Schmeja (2007), whose analysis generated distributed BD mass populations of both ONC and IC348. Their analysis indicated that the BDs appear slightly more centrally concentrated for the 1 Myr old ONC than for the 3 Myr old IC348, which implies that the ejected BDs spread away from their birth place with time. In σ Orionis, the radial profiles of stars and BDs are similar, but an underabundance of planetary mass candidates in the central region has been reported (Caballero et al., 2007; Pe˜na Ram´ırez et al., 2012). In contrast, Luhman (2006) observed the entire region and found no spread in the BD population to the massive stars . However, these results should be treated carefully due to observational incompleteness. Wide FOV surveys of ONC and IC348 have not yet been completed spectroscopically, and contamination from Galactic field stars could be dominant in the outer regions where the background nebulosities become faint. In the case of σ Orionis, previous works have probably missed planetary mass candidates at the center of the cluster since the bright OB stars at the cluster center could hide faint objects. Bouy et al. (2009) studied the core of σ Orionis using adaptive optics and found a relatively large number of planetary mass candidates. If confirmed to be true σ Orionis members, they would increase the central abundance of the planetary mass population. In the TMC, a recent spatial analysis (Parker et al., 2011) suggested a slightly different distribution of substellar mass objects to massive stars using the previous survey data. This result implies that the substellar objects are not spread to the massive stars , but the number of substellar mass samples is not statistically sufficient for a definitive conclusion. Thus, confirming the spatial universality of the substellar IMF has been controversial. In order to confirm whether the substellar IMF changes in different environments, a wider region must be studied to reveal the whole population in a cluster with a spectroscopic follow-up.
1.3. OUR RESEARCH MOTIVATIONS AND FOCUSES 7
1.3.2 IMF Bottom Limit
Subsequent to their discovery (e.g., Tamura et al., 1998; Oasa et al., 1999; Lucas & Roche, 2000; Zapatero Osorio et al., 2000), the existence of isolated PMOs of below 0.013 MJuphas been reported in young star forming regions. The largest survey of NGC1333 to date has determined the spectroscopic census of the IMF down to 6–8 MJup (Scholz et al., 2012b). This survey shows that the planetary mass population is largely consistent with a monotonic continuation of the power law with α = 0.61 (0.015 ≤ M/M⊙ < 0.7). The compiled results for other regions (σ Ori; Upper Sco; ρ Oph) demonstrate that the slope of the mass function for the planetary domain is α . 0.6 in star forming regions. The current census of star forming regions therefore supports the idea that PMOs are an extension of the population of stars and BDs and form through the same mechanism. Note however that spectroscopic studies in star forming regions other than NGC1333 have not yet been completed below 0.013 M⊙. In the lower mass regime, a microlensing survey has provided evidence of many objects of M . 0.005 M⊙(Sumi et al., 2011). These results imply that a few such Jupiter mass objects have a different origin to the star forming process. They may have formed in the protoplanetary disks like planets. However, no spectroscopic observations to date have achieved sufficient depth to detect objects of a few Jupiter masses.
Many theoretical studies have analytically and numerically predicted the bottom limit of the IMF to be 0.001–0.010 M⊙. Low & Lynden-Bell (1976) indicated that the minimum Jeans mass of a fragment de- pends strongly on the background radiation and weakly on the metallicity (Z−1/7). Considering the typical temperature in molecular clouds to be 10 K, they have shown that the minimum mass is 0.007 M⊙. Boss (2001) performed a hydrodynamical simulation including magnetic field effects, giving a central rebound and cooling that allows a multi-stellar system to form by fragmentation and an isolated PMO (≤ 1MJup) to be ejected from the system. Bate (2005) investigated the dependency of the IMF on the metallicity by setting the non-isothermal critical density to be a factor of 9 lower than the typical value, which is intended to mimic the thermal behavior of a molecular gas with a lower metallicity (log(Z/Z⊙) = −3.3). Their large- scale hydrodynamical simulation found that a low metallicity increases the minimum mass of a BD by a factor of 3 to 9 MJup. Whitworth & Stamatellos (2006b) calculated the minimum mass based on various star forming scenarios: hierarchical fragmentation of a 3D medium, 2D fragmentation of a shock-compressed layer, and fragmentation of a circumstellar disc. Although these scenarios are very different from each other, the authors showed that the minimum mass is in a narrow range of 0.001 to 0.004 M⊙. Therefore, at the limit of IMF, predicted to be 0.001–0.010 M⊙, if BDs and PMOs are born as stars, the IMF will be consistent with the extrapolation of the stellar IMF. On the other hand, if they born as planets, the IMF may differ from the extension of the stellar IMF. An observation that determines the abundance of BDs and PMOs in various regions will uncover their formation process.
1.3.3 Formation of BDs and PMOs
Several mechanisms have been proposed for the formation of low-mass stars and BDs. They can be sum- marized as follows:
1.3. OUR RESEARCH MOTIVATIONS AND FOCUSES 8
Turbulent fragmentation —
The turbulent flow in a molecular cloud triggers compression and frag- mentation of gas, which produces collapsing cores with a wide range of masses (Padoan & Nordlund, 2004; Boyd & Whitworth, 2005). The mass of each core determines the mass of the resulting star. Low-mass stars and BDs arise from the smallest cores. While this scenario predicts a large production of low mass stars and the lower typical mass of the IMF under conditions of higher turbulent velocity, it suggests that the general form of the IMF remains unchanged. Therefore, this scenario is consistent with the universality of the IMF observed in several star forming regions. However, high resolution is required to detect such small cores and they have a short dynamical timescale (∼ 104yr). In fact, although some studies have achieved sufficient sensitivity to detect such low-mass cores (e.g., Andr´e et al. 2010; M ∼ 0.01M⊙), it has been found that these cores cannot gravitationally contract, with the exception of a study by Andr´e et al. (2012) who detected a possible BD mass core using an interferometer.Dynamical ejection from proto-stellar or proto-planetary systems —
In this theory, the ex- istence of a few (. 3) objects is supposed in the proto-stellar or proto-planetary systems. As these objects dynamically interact with each other, the lowest mass object(s) will be ejected from the systems, which prematurely halts their accretion (Reipurth & Clarke, 2001; Bate et al., 2002). This process is a straightfor- ward mechanism in multi-stellar systems. In fact, most protostars are born as binaries or even multi-stellar systems (Ghez et al., 1993; Leinert et al., 1993; Reipurth, 2000) and the dynamical interaction and ejection is enhanced in such an environment. This scenario is amenable to observational studies that allow low-mass stars and BDs to be distinguished from massive stars by their spatial or velocity distribution. However, to date no studies have identified clear differences between stellar and BD properties (White & Basri, 2003).Fragmentation of infalling gas into a stellar cluster —
The gravitational potential of a forming stellar cluster provides a focus that attracts gas from the surrounding molecular cloud. Filament structures formed into cluster centers attain high gas densities due to the combination of the cluster potential and local self-gravity. The resultant Jeans masses are low, allowing the formation of very low mass fragments (Bon- nell et al., 2008). This theory predicts that the abundance of low mass populations like that of BDs depends on the stellar density in the cluster. Also, the dependency of the Jeans mass on the stellar density explains the variation of the IMF in Taurus (Bonnell et al., 2011).Fragmentation of massive circumstellar disks —
The gravitational fragmentation of massive cir- cumstellar disks around central stars produces low-mass companions. Some of these objects are ejected through dynamical interactions with other companions or nearby stars (Whitworth & Stamatellos, 2006a; Goodwin & Whitworth, 2007a). In clusters, the gas interaction of two disks may promote BD and PMO formation (Shen et al. 2010). However, such massive disks (∼ 0.1M⊙) producing BDs and PMOs are rare in studies of star forming regions. Eisner & Carpenter (2006) observed infrared protostellar objects in the ONC and concluded that the abundance of massive discs (> 0.1M⊙) is less than 2 %.Photo-evaporation of OB stars —
Photo-ionizing radiation from OB stars halts accretion by re- moving much of the envelope and discs of nearby low-mass protostars (Whitworth & Zinnecker, 2004).1.4. INSTRUMENTS USED AND STAR FORMING REGIONS CONSIDERED IN THIS THESIS 9
However, this scenario applies only in the vicinity of OB stars and cannot for example be adopted for the TMC.
Since the theories of BDs and PMOs have reached controversial conclusions so far, it is important to test these theories though observations in star forming regions and to investigate low-mass star proper- ties, such as binarity, spatial distribution and especially the IMF, in star forming regions. Recently, a radial velocity survey has determined the frequency of extra-solar planets. By combining this planetary frequency data with stellar binary data, a clear difference in the mass functions between companions to G-type stars and planets has been determined. This difference is thought to be associated with the difference in their formation mechanisms. Therefore, we need to study substellar IMF, including binaries, to confirm whether there is a difference in their formation scenarios.
1.4 Instruments Used and Star Forming Regions Considered in This
Thesis
In order to determine the substellar IMF, we observed two well-studied star forming regions using several instruments. In this section we introduce the instruments and previous works on the star forming regions.
1.4.1 Instruments
The Subaru telescope
is an 8.2-m optical–infrared telescope at the summit of Mauna Kea, Hawaii, operated by the National Astronomical Observatory of Japan (NAOJ). The telescope is enclosed within a cylindrical dome, whose shape was designed to reduce air disturbance. The median image size (full width at half maximum; FWHM) of the Subaru telescope is 0.6′′–0.7′′ in the R band (∼6500Å) based on the seeing size statistics collected by the CCD camera of an auto guider during focus checks. The Subaru telescope has a number of common-use instruments for imaging and spectroscopy with a wide wavelength coverage from optical to mid-infrared.The Okayama 1.88-m telescope
is one of the largest telescopes in Japan, operated by the Okayama Astrophysical Observatory (OAO). The 1.88-m telescope is located at the top of Mt. Chikurin-ji, which is the best astronomical site in Japan. The astronomical seeing at OAO is fairly good and the image size of stars is typically 1.4′′. The telescope has several open-use instruments for imaging and spectroscopy with wavelength coverage from optical to near-infrared.The United Kingdom Infra-Red Telescope (UKIRT)
has a 3.8-m primary mirror capable of optical–infrared photometry and spectroscopy, located at the summit of Mauna Kea. The UKIRT is cur- rently being operated by the Joint Astronomical Centre (JAC) in a transitional phase toward new ownership. The median image size of the UKIRT is 0.4′′–0.5′′in the K-band , which was systematically monitored and corrected for undersampling in February 1999. Since 1 January 2011, the UKIRT has been operating in a1.4. INSTRUMENTS USED AND STAR FORMING REGIONS CONSIDERED IN THIS THESIS 10
“minimalist mode” and all available observing time has been used to complete the UKIDSS program.
The Spitzer Space Telescope
is an infrared space observatory, and the final mission in NASA’s Great Observatories Program. Spitzer has a 0.85-m primary mirror and three cryogenically cooled science instru- ments, which are capable of sensitive imaging and spectroscopy from mid to far infrared wavelengths. On the May 15, 2009, Spitzer used the last of the superfluid helium aboard the spacecraft. Subsequently, the two shorter-wavelength modules of the IRAC camera have been operated in the Spitzer Warm Mission.The Wide-field Infrared Survey Explorer (WISE)
is a NASA-funded Explore mission that is de- signed to conduct an all-sky survey with a 0.4-m primary mirror and a mid–far infrared detector. WISE has provided an all-sky map of the infrared wavelength. This spacecraft had been in hibernation without ground contact from February 17, 2011, but was restarted for a new mission to search for asteroids in 2013.1.4.2 Star Forming Region 1: Orion Nebular Cluster
The ONC is the most suitable star forming region for IMF studies. It is nearby, ∼ 450 pc (Muench et al., 2008), and young, ≤1 Myr (Hillenbrand, 1997; Riddick et al., 2007). Previous studies of the ONC have concentrated on the central part of the ONC region. Hillenbrand (1997) conducted an optical imaging survey and spectroscopic follow-up, including collecting spectra for ∼ 900 stars, and measured the stellar masses down to ∼ 0.1 M⊙within 4.5 pc × 4.8 pc (34′×36′) of the Trapezium cluster. Luhman et al. (2000) conducted infrared imaging at the central region of the Trapezium cluster (140′′×140′′; 0.3 pc × 0.3 pc) and K− band spectroscopy for ∼ 100 sources. Slesnick et al. (2004) performed 97 J- and K-band spectroscopy measurements of the inner 5.1′×5.1′ region of the ONC (Hillenbrand & Carpenter, 2000). Although they confirmed the presence of many low-mass cluster members and even BDs of masses down to 0.02 M⊙, the bright nebulosities made it difficult to extend the measurements to lower masses. In order to cover a larger area of the ONC, deep and wide imaging surveys have been conducted (Robberto et al., 2010; Andersen et al., 2011; Da Rio et al., 2012). Andersen et al. (2011) have discontinuously covered a large area (26′×33′) using HST/NICMOS Camera 3. Over the observed area, they have shown that the IMF in the whole of the ONC become fatter in the substellar mass regime, and the relative abundance of BDs to stars increases from the center to the outer regions. Meanwhile, Da Rio et al. (2012) have also covered a large FOV (32′×33′) with a WFI camera mounted on the 2.2-m MPG/ESO telescope. They have determined the IMF down to 0.02 M⊙, finding that it declines steeply with decreasing mass, and they have found no evidence of IMF flattening toward the substellar mass regime. The inconsistency between Andersen et al. (2011) and Da Rio et al. (2012) may be explained by different estimates of the background contamination. In order to confirm the validity of these studies, a wider coverage area spectroscopic study with multi-object spectrographs is required. However, no spectroscopic observations of the targets have yet been made. Lucas et al. (2005) have made observations focused on the outer regions of the ONC, where fainter nebulosities enable the observation of fainter objects. They detected 33 faint planetary mass candidates. To confirm their cluster membership, spectroscopic observations were conducted and about 10 PMO candidates were identified as young stellar objects (Lucas et al., 2006; Weights et al., 2009). However, many of the photometric candidates have not yet been spectroscopically examined. It is important to observe the candidates for
1.4. INSTRUMENTS USED AND STAR FORMING REGIONS CONSIDERED IN THIS THESIS 11
characterization of the BDs and PMOs in this region. Aim to observe the ONC
We therefore have conducted spectroscopic follow-up observations of the Lucas et al. (2005) candidates, and found two new young BDs and a BD/planetary-mass boundary object.
The universality of substellar IMF in the ONC —
In previous works, the authors have con- ducted spectroscopy to concentrate on the central regions in the ONC, however the spectroscopic follow-up have been uncompleted on the outer regions. We identify several stellar and substellar members with spec- troscopy from the candidate list of Lucas et al. (2005), and compile the spectroscopic sample of the outer regions in the ONC. In comparison of our sample with the previous works in the central regions, we can first discuss the universality of substellar IMF in the ONC based on the spectroscopic sample.The impact of OB star’s photo-evaporation process on the substellar formation —
The ONC is a well-studied massive star forming region and has some OB stars, Trapezium stars at the central regions. Therefore, if the process of photo-evaporation of OB stars was dominant for the substellar forma- tion, we would find the central concentration of the substellar mass objects for the stellar mass members. Since our observed region is located away from the center, we can check the impact in comparison of our sample with the sample of the central regions.1.4.3 Star Forming Region 2: Taurus Molecular Cloud
The TMC is one of the best star forming regions to study the origin of PMOs because of its proximity (140 pc) and youth (∼ 1 Myr) (see Kenyon et al. 2008 for a review). Several surveys have been conducted in the Taurus region to investigate its IMF down to the substellar regime. Brice˜no et al. (2002a) have combined their optical photometry of several clustered regions with near-infrared data from 2MASS, and identified some low-mass members from optical spectroscopy. They constructed the Taurus IMF with AV < 4 samples covering ∼ 8 deg2and determined the deficit of BD mass members in the TMC, compared with the Orion Trapezium cluster. Luhman (2004) have conducted optical imaging covering ∼ 4 deg2 and combined the data with the 2MASS catalogue. They identified new low-mass members from optical spectroscopy, and added the data to the previous studies (Brice˜no et al., 2002a; Luhman et al., 2003a). They constructed the IMF totally covering ∼ 12 deg2 and found that the relative ratio of substellar mass to stellar mass is slightly higher than those determined by Brice˜no et al. (2002a) and Luhman et al. (2003a). Since there are no observations from which to fully generate the census of low-mass population (M2–M6) in TMC, their IMF could be overestimated. However, since Slesnick et al. (2004) revised the number of BDs per star downwards, the difference in the BD/star number ratio might be small between the TMC and Trapezium. Guieu et al. (2006) have conducted a wider survey (∼ 28 deg2) with CFHT and the optical large FOV camera CFHT12k (Cuillandre et al., 2000) and MegaCam Boulade et al. (2003), and obtained optical spectra of selected low-mass candidates. Their work is not complete in the spectral range M2–M4, but they were able to estimate the BD/star number ratio to be higher than the result of Luhman (2004). However, Luhman
1.4. INSTRUMENTS USED AND STAR FORMING REGIONS CONSIDERED IN THIS THESIS 12
(2006), who covered the entire area of the TMC (∼ 225 deg2) with an all sky survey catalogue (2MASS and USNOB-1.0), has indicated that the incompleteness of Guieu et al. (2006) is worse than originally thought by appropriately considering the missed known members in their selection procedure. As a result, Luhman (2006) found a BD/star number ratio of Guieu et al. (2006) similar to that of Luhman (2004). Luhman et al. (2009) have conducted optical and infrared spectroscopy for low-mass candidates selected using 2MASS, Spitzer, and XMM-Newton Observatory data Scelsi et al. (2007). They have determined the substellar population down to 20 MJup covering 5 deg2 in Taurus, and updated the IMF previously constructed by the authors. The IMF closely resembles those they previously reported. Moreover, they have found the first probable PMO candidate, 2MASS J0437+2331 in their TMC survey. Since they determined that the optical SpT is L0 and the object shows no infrared excess, they have concluded that the object is a young disc-bearing L-type member. Alves de Oliveira et al. (2012) have obtained the near-infrared spectrum with Gemini/GNIRS as a young L0-type template. The spectrum shows strong water absorption, which means it is probable that the object has a very cool temperature as an L-type object. In summary, many authors have investigated the population in TMC, but it nevertheless remains difficult to measure a reliable BD/star ratio due to the wide spread of TMC in the sky and the observational incompleteness for early M-type members. In addition, the previous surveys were only sensitive to substellar objects down to 20 MJupdue to limitations in the survey depth, and hence the planetary mass population has not been fully revealed.
Recently, some deep surveys have achieved a sensitivity capable of detecting even PMOs. Quanz et al. (2010) have performed deep near-infrared imaging covering 1 deg2 with OMEGA2000 mounted on the Calar Alto 3.5-m telescope. They found six planetary mass candidates and obtained the J-band spectra. Although they conclude that some candidates may be Galactic giant stars or carbon stars, one candidate (CAHA Tau 1) seems to be a young planetary mass object. However, Luhman & Mamajek (2010) have concluded that the candidate is a high mass member through their obtained near-infrared spectrum. The completeness of Quanz et al. (2010) is limited for the SDSS data, which is used as an optical counterpart for their infrared data. Therefore, when they combine their infrared data with deeper optical data, they may find other planetary mass candidates. Todorov et al. (2010) have found a very faint object as a companion to a central BD 2MJ04414489+2301513 (SpT∼M8.5; Luhman 2006) using HST and Gemini with the AO instrument. They have converted the Ks-band magnitude to the luminosity with a bolometric correction, and the luminosity indicates that the object has 5–10 MJupby comparing with the predicted luminosity from theoretical evolutionary models for an age of 1 Myr. Luhman et al. (2009) have found the first probable PMO candidate 2MASS J0437+2331 in their TMC survey. Since they determined that the optical SpT is L0 and the object shows no infrared excess, they have concluded that the object is a young disc-bearing L-type member. Alves de Oliveira et al. (2012) have obtained the near-infrared spectrum with Gemini/GNIRS as a young L0-type template. The spectrum shows strong water absorption, which means it is probable that the object has a very cool temperature as an L-type object. A few PMOs have been found so far in TMC, but the sensitivity and completeness of the previous surveys is still limited.
Aim to observe the TMC
In order to reveal the planetary mass population, we need to conduct much deeper and wider observations.
1.5. ORIGINALITY AND OUTLINE OF THIS THESIS 13
The bottom of IMF in the TMC —
Previous observations have achieved the sensitivity down to 20 MJup , however the IMF of lower (planetary) mass regimes have never been revealed. Our ultra-deep imaging with the Subaru/Suprime-Cam allows us to first study the bottom of the IMF in the TMC. In some star forming regions (e.g., ONC; Cha I; σ Ori), recent deep observations have found several PMO can- didates. However, there is no large spectroscopic observations except NGC1333 (Scholz et al., 2012b). Therefore, we can first compare it with our result based on the deep imaging/spectroscopy data.The impact of several substellar forming theories on the PMO formation —
Scholz et al. (2012b) have suggested that the frequency of PMOs can be explained by the extrapolation of a monotonic power law of the substellar IMF. Thus their result supports for the idea that PMOs are an extension of the population of stars and BDs and form through the same mechanism. Therefore, if it was true for other star forming regions, we would find some PMOs in the TMC. On the other hand, since current star forming theories do not distinguish between PMOs and massive stars, if we found many or few PMOs in the TMC, we would need additional scenario to explain the result.1.5 Originality and Outline of This Thesis
We have previously introduced the IMF, performed observations of BDs and PMOs in various star forming regions, in particular the ONC and TMC, and formulated the formation theories for BDs and PMOs. In this thesis, we develop a form for the low mass end of the IMF, and determine the formation mechanism and properties of BDs and PMOs. In this respect, the ONC and TMC are the most suitable locations because of their proximity, young age, and rich stellar abundance. Several noteworthy points of this thesis can be summarized, as follows:
1. We observed a very faint object of the ONC using a multi-object slit spectrograph, Subaru/MOIRCS. The ONC is a rich compact cluster and the best field for statistical investigation of BDs and PMOs. However, it takes a long time to observe a large number of very faint BDs and PMOs with a long slit spectrograph. Therefore, we used the Subaru/MOIRCS, which enabled us to obtain many spectra of faint substellar objects simultaneously.
2. We developed a reduction pipeline and algorithm to derive the physical parameters . After the obser- vation with MOIRCS, we needed to conduct a reduction of many raw frames. Therefore, we devel- oped a pipeline which enabled us to obtain 1-D spectra from 2-D raw images semi-automatically. We also developed an algorithm for determining the physical parameters and to evaluate the uncertainty using the programming language Python.
3. We obtained a huge number of deep images in the TMC using a large FOV camera mounted on the Subaru telescope, Suprime-Cam. The TMC is the best location for studying PMOs, but it is widely spread in the sky and the coverage by previous studies has been insufficient. Our wide ultra-deep imaging with Subaru/Suprime-Cam can reveal very low mass populations, even of PMOs, in this region.
1.5. ORIGINALITY AND OUTLINE OF THIS THESIS 14
4. We adapted the optical filters of the Suprime-Cam to select PMOs efficiently. Usually, studies observ- ing star forming regions use IR instruments because they exhibit the advantage of visual extinction of the molecular cloud. However, as shown in Figure 1.3, since the fluxes at the optical wavelength are clearly different between host massive stars and cool substellar objects, we can distinguish substellar objects from massive stars by combining the deep optical data with near IR data.
In Chapter 2, we describe a spectroscopic study of the ONC using Subaru/MOIRCS and the OAO 188- cm telescope + ISLE. We identify three new BD candidates from 12 spectra. We derive their physical parameters using χ2-fitting and the HR diagram. We discuss the properties of each object and the star forming history in Orion. In Chapter 3, we show the results of wide and ultra deep optical imaging with Subaru/Suprime-Cam, an infrared imaging follow-up with OAO/ISLE, and infrared spectroscopy of BD and PMO candidates. By combining these data, we achieved a sensitivity down to several planetary masses at optical to infrared wavelengths. We select two PMO candidates and obtain their spectra using Subaru/IRCS. Finally, we discuss the ratio of PMOs to BDs in the TMC. In Chapter 4, we end with a summary and conclusions of this thesis.
aSee http://pono.ucsd.edu/˜adam/browndwarfs/spexprism
1.5. ORIGINALITY AND OUTLINE OF THIS THESIS 15
1.0 1.5 2.0 2.5
Wevelength [ µ m]
0.0
0.5
1.0
1.5
2.0
2.5
No rm ali ze d F lux
H
2O H
2O
i′ z′ K
Young M9V spectrum (KPNO12)
Field M9 spectrum (LHS2065)
Field M3V spectrum (Gl388)
Filter response curve
Figure 1.3: Comparison of a spectrum of a young M9-type BD spectrum (red: KPNO12; Muench et al., 2007) with that of a field M9-type dwarf with much higher gravity (black: LHS2065; Rayner et al., 2009). In addition, a spectrum of the field M3-type dwarf (blue: Gl388; Rayner et al., 2009) is shown. The spectra are available at the SpeX Prism Spectral Librariesa. The filter response curves used in our imaging data (Suprime-Cam i′- and z′-band; UKIDSS K-band) are shown at the bottom of this figure. As clearly shown in this figure, hotter objects like M3-type dwarfs have “bluer colors” in i′–z′or i′–K color, while the cool late-type objects have redder colors. These clear differences in i′–z′ or i′–K color diagrams (i.e., use of “optical” wavelength) provides a great benefit in efficiently removing the hotter objects, while preserving the cooler objects like PMOs.
Chapter 2
Spectroscopy of Very Low Mass Brown Dwarfs
in Orion Nebular Cluster
(Based on a paper by Suenaga et al., accepted for publication in PASJ)
In order to investigate the formation of substellar mass objects in the ONC, we obtained near-infrared spec- tra of BD candidates through two observing programs. The first data set was acquired on November 30, 2007, using the Multi-Object InfraRed Camera and Spectrograph (MOIRCS; Suzuki et al. 2008) mounted on the 8.2-m Subaru telescope (f/12.2 at the Cassegrain focus). The second data set was obtained during December 3–7, 2010, using ISLE (Yanagisawa et al., 2006, 2008), a near-infrared imager and spectrograph for the Cassegrain focus (f/18) of the 1.88-m telescope at OAO. Unfortunately, we could only observe relatively bright candidates because auto-guider problems and high-humidity conditions prevented a full observing program with MOIRCS. Therefore, we focus on the good signal-to-noise ratio (S/N) candidates for MOIRCS in this paper. In total, 12 BD candidates were selected, with eight of these objects obtained by MOIRCS and four obtained by ISLE (Table 2.1).
2.1 Observation and Data
2.1.1 Target Selection
The target sources for the spectroscopy were selected from the catalogue of Lucas et al. (2005), which presents the JHK photometry of the BD candidates obtained by Gemini-South/Flamingos. The selection criteria were as follows. (1) All sources have prospective masses ranging from the hydrogen-burning limit (< 0.075 M⊙) down to the deuterium-burning limit of 0.013M⊙. (2) Sources that were close to or embedded in bright nebulosity were avoided. For optimum sensitivity, objects located in areas of faint nebulosity were chosen (Figure 1 in Lucas et al. (2005)). (3) Sources were only chosen if they exhibited fairly low visual absorption (AV < 7.5), which is the same value as the recent spectroscopic study (Weights et al., 2009).
16
2.1. OBSERVATION AND DATA 17
Since Lucas et al. (2005) suggested that there is a significant number of background stars with AV >10 and K > 16 among the BD candidates, the AV < 7.5 limit reduces the background contamination. From 396 sources provided by Lucas et al. (2005), we selected 137 BD candidates within a extinction value AV < 4, and observed 12 objects which include some previous observed objects. Although most of these objects have uncertainties (∼ 0.1 mag) in their magnitude, two of them,208-736 and 215-652, have large errors (> 0.2 mag) in their J and H magnitudes. Robberto et al. (2010) also observed these objects with ISPI, the facility infrared camera at the CTIO Blanco 4-m telescope, and achieved better quality for 208-736 in the H-band, and 215-652 in the J- and H-bands. Therefore, in our study we used the magnitudes of Robberto et al. (2010) instead of Lucas et al. (2005) for these objects: H = 17.37 ± 0.10 for 208-736 and J = 17.87 ± 0.17, H = 17.23 ± 0.09 for 215-652.
2.1.2 Multi-Object Spectroscopy
We obtained eight spectra using Subaru/MOIRCS whose 4′×7′FOV is covered by two HAWAII 2048×2048 HgCdTe arrays with a pixel scale of 0.117 arcsec/pixel. We took simultaneous spectra of eight of the BD candidates using the multi-object spectroscopy (MOS) mode of MOIRCS. We used a 1-arcsec slit width and the HK500 grism, optimized for 1.4–2.5 µm and low-resolution (R ∼ 500) spectra. To eliminate the background noise, the objects were observed with slit nodding. Dome flats were obtained before a run. In order to calibrate telluric absorptions, we observed a standard star with an F-type spectrum (HD7386) in a similar air mass as the main observations for the BDs.
2.1.3 Long-Slit Spectroscopy
Four spectra out of the 12 BD candidates were taken by OAO/ISLE. The detector was a HAWAII 1024×1024 HgCdTe array that covered a 4.3′×4.3′FOV with a pixel scale of 0.25 arcsec/pixel. The ISLE observations were carried out in the long-slit mode. The slit width was 1 arcsec and nod dithering was performed. A low resolution mode was selected with R ∼ 350 in the H-band and R ∼ 450 in the K-band. The observations on Dec. 3 and Dec. 4 were photometric. The Dec. 7 observation, 065-207, was taken under a condition of thin clouds, and we carefully analyzed this source to reduce the effect of this condition. We employed a 1.5-arcsec slit width to obtain sufficient S/N. We obtained the dome flat before and after the observation. We selected an F-type star, HD24635, and a B-type star, HD34748, to measure the telluric absorption. When using a B-type star possessing primarily strong hydrogen recombination lines as a telluric standard star, we must carefully deal with the stellar intrinsic lines since such lines cause artificial features in the spectra. Therefore, we removed the intrinsic lines in the B-type stellar spectra by interpolating it with the nearby flux.
2.1. OBSERVATION AND DATA 18
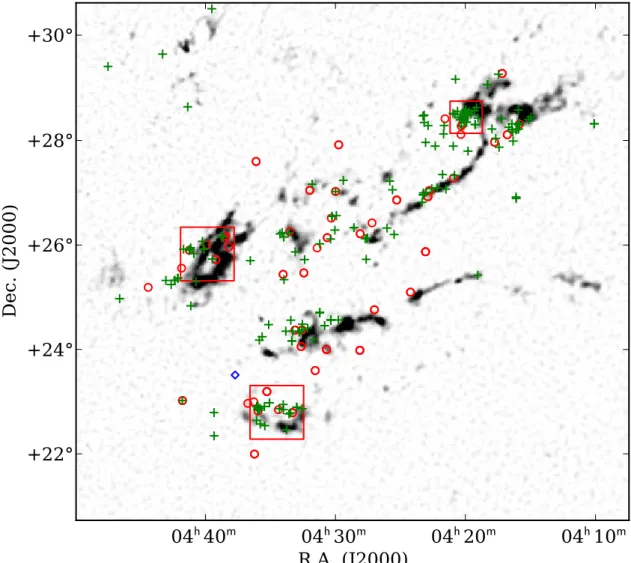
Figure 2.1: Our FOV overlaid with the dust continuum image (Figure 1 of Lucas et al., 2005). The field that we obtained for the spectra of BD candidates is shown as a red square box. The survey region of Lucas et al. (2005) is enclosed by solid lines and the locations of the three Gemini South/Flamingos fields are indicated. The location of θ1Ori C at the cluster center is indicated by a large + sign. The zero-flux contour is marked with short lines. Contour levels (in data numbers) are 0, 0.2, 1, 2, 3, 5, 8, 12, 20, 50 and 100. The 0.2 contour level corresponds to visual extinction of the order of AV = 5.
2.1. OBSERVATION AND DATA 19
Table 2.1: Summary of observed objects
J H K Obs time
Object Data Set [mag] [mag] [mag] AV H,K[min] Referencea ID(LRT05)b
030-524 MOIRCS 17.88 17.26 16.77 1.8 ±1.5 60,60 1,2 178
037-628 MOIRCS 18.52 17.66 16.99 4.4 ±1.5 60,60 2 94
061-400 MOIRCS 18.31 17.33 16.48 5.7 ±1.5 60,60 2 270
065-207 ISLE 13.47 12.81 12.24 0.8+1.5−0.8 10,60 - 382
072-638 ISLE 15.39 14.80 14.29 1.0+1.5−1.0 10,- 1 70
099-411 MOIRCS 17.08 16.40 15.99 2.3 ±1.5 60,60 - 256
104-451 ISLE 15.10 13.99 13.13 5.8 ±1.5 5,30 - 230
183-729 MOIRCS 18.05 17.38 17.24 2.3 ±1.5 60,60 1,2 18
208-736 MOIRCS 18.28c 17.37d 16.56 5.0 ±2.4 60,60 - 8
215-652 MOIRCS 17.87d 17.23d 17.15 2.0 ±2.0 60,60 - 56
216-540 MOIRCS 16.95 15.89 15.47 3.7 ±1.5 60,60 - 155
217-653 ISLE 14.99 14.26 13.32 2.4 ±1.5 5,30 1 55
Note. Object names are coordinate based, following O’dell & Wong (1996). 030-524 means that the coordinate of the object is (R.A., Decl.) = (05:35:03.0, -05:25:24). JHK magnitudes are taken from Lucas et al. (2005) with the exception of 208-736 and 215-652. Visual absorption (AV) is estimated from a comparison between observed and synthetic J–H vs. H color-magnitude diagrams.
aThe previous spectroscopic studies. 1. Riddick et al. (2007); 2. Weights et al. (2009)
bThe running number is used in Lucas et al. (2005)
cThe magnitude has a large uncertainty (> 0.2 mag)
dThe magnitude is taken from Robberto et al. (2010) instead of Lucas et al. (2005)
2.2. DATA REDUCTION 20
2.2 Data Reduction
Both the multiple and long slit data were reduced using IRAF software. Standard techniques were used to reduce the MOIRCS multiple slit data. To subtract the sky background, the exposures for each BD candidate pair were separated into their relative nod positions (A or B). We subtracted the adjacent B frame from the A frame to reduce the residual. Flat fielding was corrected by using the dome flat frames. Note that channel 1 of MOIRCS was an engineering detector from Oct. 2007 to Jun. 2008 and had prominent, large, ring-like high dark noise. Therefore, we masked and did not use these regions in this data reduction. Cosmic ray cleaning was performed by L.A.Cosmic (Laplacian Cosmic Ray Identification; van Dokkum 2001). The array distortion was corrected by the MCSGEOCORR task in the MCSREDa. To calibrate the wavelength of the data, OH lines were identified as a function of wavelength. After performing 5-pixel binning along the wavelength directions of the data to improve the S/N ratio, we extracted the spectra with the APALL task in IRAF. We corrected spectral contamination due to telluric absorption using the standard star measurements. Extracted pairs from each nod position were combined. Finally, a dereddening procedure was conducted with an adopted reddening parameter of 3.1. We used the J–H vs. H color and magnitude of the objects and synthetic color-magnitude diagram (Allard et al., 2010) with age ∼ 1 Myr and distance ∼ 450 pc to derive the AV values using the reddening law of Cardelli et al. (1989).
For the ISLE spectra, the reduction process was similar to that of MOIRCS. However, we did not correct the array distortion because the influence of the distortion was negligible. We obtained the H-band and K- band spectra separately. Therefore, the H-band and K-band spectra were scaled to the 2MASS magnitude of objects whose Vega magnitude and zero point magnitude were based on Cohen et al. (2003). The advantages of using 2MASS magnitudes are that the 2MASS magnitudes of our objects had low errors (< 0.1 mag) and the 2MASS K s-band filter reduced the noise contribution from the thermal background beyond 2.3 µm.
2.2.1 Semi-Automatic Reduction Pipeline
In order to efficiently analyze the many spectra obtained from MOIRCS, we developed a semi-automatic reduction pipeline in the programming language CL-Script, with some procedures taken from external libraries. It is a simple pipeline for the standard reduction procedure. Using this pipeline, we can easily conduct each reduction step, though some manual operations are required. In particular, it is efficient to use a function to divide the 2-D MOS image into several 2-D spectral images. Also, optimization of background subtraction will minimize residual noise. We introduce the procedures briefly as follows:
1. Split the raw frame list. Before starting the data reduction, we need to split the raw frame list into objects, flat, comparison lists at each channel.
2. Subtract sky background (OH lines) optimally, perform flat field correction and correct for cosmic rays. When the sky background of a frame is subtracted, the reference frame for the subtraction is optimized to minimize the residual OH lines by combining the vicinity frames and multiplying the
aMCSRED was provided by Dr. Ichi Tanaka. See http://www.naoj.org/staff/ichi/MCSRED/mcsred.html for the software for MOIRCS imaging.
2.2. DATA REDUCTION 21
coefficient. In this procedure, the OH lines for minimizing the residual need to be selected manually. Next, flat fielding is conducted based on the split lists. The routine for cleaning cosmic rays provided from L.A.Cosmic is included in this pipeline.
3. Correct the array distortion. This routine is provided from the MCSGEOCORR task in the MCSRED. 4. Divide the 2-D MOS image into images. Before extracting the 1-D spectra, the 2-D MOS image needs to be divided into 2-D spectral images. This procedure needs an MDP file which is created during the preparations for observation to identify the position of each 2-D spectral image.
5. Wavelength correction and extraction of 1-D spectra. This procedure identifies OH lines for wave- length correction manually. Since the pipeline includes a detailed reference OH line list for MOIRCS, we need to identify at least three lines. The function for extracting 1-D spectra is included by using the APALL task in IRAF.
6. Combining frames, binning, correct telluric absorption and dereddening. After combining frames, binning, telluric correction and dereddening are optionally conducted.