Low Cycle Fatigue Properties of
Reduced Activation Ferritic/Martensitic Steel (JLF-1)
at Elevated Temperature
Huailin LI
DOCTOR OF PHILOSOPHY
Department of Fusion Science
School of Physical Sciences
The Graduate University for Advanced Studies
2006 (School Year)
Abstract
One of the most important tasks in the 21th century is to develop a social system in which the environment and life on a global scale are protected. Central item to this issue is the development of economical energy sources with low emission of carbon dioxide because carbon dioxide leads to global warming and may cause more critical issue of abominable global climate. On the other hand, the supplement of fossil fuels is limited. The development of advanced energy is an important option concerning stable energy source in the century.
Among the fission, fusion, and other sources such as wind power, fusion has been actively considered as the 21st century energy source in major countries to meet the energy requirement of our society in the future, because it has potentially superior characteristics with respect to safety, environment acceptability, and resource availability. The structural integrity of fusion reactor depends on the properties of the structural materials. Thus, the development of reactor materials and power generating blanket system is a critical issue for early realization of fusion energy. Among the three materials for fusion applications—reduced activation ferritic/martensitic steel (RAF/M), V-alloy, and SiC/SiC composites, the RAF/M steel is considered as the leading candidate structural material for the first wall in fusion reactor as there exists a well-developed technology and a broader industrial experience with the ferritic-martensitic steels in fossil and nuclear energy technology.
Low cycle fatigue (LCF) behavior of RAF/M steel at elevated temperatures is necessary to design since the cyclic plastic deformation might be expected if the combined mechanical and thermal cyclic loading of the first wall is extreamly high. In addition, mechanical properties of martensitic steels are strongly related to their complex microstructure.
Thus, the objective of this research is to study the LCF behavior of a candidate structural material of the first wall, JLF-1 steel, at elevated temperature with an engineering size specimen in vacuum. To avoid the shape, size, and environment effects, the LCF tests were carried out with engineering size (8 mm in diameter) round bar specimens in vacuum. The present research focuseses on;
1) temperature effect on the relationship between fatigue life and plastic strain range, 2) cyclic softening/hardening and the mechanism,
3) cyclic yield stress-strain curves and its application on design.To obtain basic information on RAF/M at elevated temperature, the tensile test was also carried out.
Tensile and LCF specimens were polished in the longitudinal direction with #1500 emery paper to remove the circumferential machining layers. The test system consisted of mechanical machine (load capacity of ±98 kN), vacuum system (~10-3 Pa), and induction heating system (capacity of up to 973 K). The axial displacement of the specimen was measured by a Shinko 1501-93-20 extensometer (a differential transducer with gage length of 12.5 mm and capacity of ± 1 mm). Based on the temperature profile on the specimen, two thermocouples were welded in the gage length on the specimen for temperature control. One thermocouple was used for the control of the temperature and the other was to monitor the temperature during the test. The temperature difference in the two thermocouples was kept less than 3 K, which was stricter than the requirement of ASTM standard.
Tensile tests of JLF-1 steel were carried out from room temperature (RT) to 873 K at strain rate of 0.1%/s and 0.02%/s. The strain rate does not affect yield stress, ultimate tensile strength and reduction in area as far as the tests performed in this study. Strain hardening of JLF-1 steel decreased significantly above 673 K, almost no strain hardening was observed at 873 K. With strain hardening decreased, the aspect of fracture changed from shear type fracture below 673 K to dimple type fracture at 773 K and 873 K. Since a little strain hardening results in lower deformation resistance at 873 K, the deformation becomes larger and larger when the stress should be over the yield point.
LCF tests of JLF-1 steel were carried out in vacuum using a fully reversed push–pull strain controlled triangular wave with strain rate of 0.1 %/s at RT, 673 K, and 873 K. The fatigue life at elevated temperature was almost as same as that at RT when the life was plotted against the total strain range. But when the life was plotted against the plastic strain range, the fatigue life curves for RT, 673K and 873 K were on different lines, which is not in agreement with the Coffin’s model. The TEM images showed that dislocation structure is dependent on temperature; dislocation rearrangements keeping high density at RT, dislocation decrease to medium level at 673 K, dislocation density decrease to low level at 873 K. Loss of dislocation pile up will result in reduction of strain hardening at high temperature. So, the loss of strain
hardening will be responsible for the increase of fatigue life at high temperature when plotted against the plastic strain range.
Cyclic softening was observed during LCF test at elevated temperature in vacuum, which was strongly related to reduction of the dislocation density, formation and loss of dislocation cell structure, and increment of lath width caused by partial annihilation of original lath boundaries. The correlation of Vickers Hardness and microstructure for the present experiment is investigated to obtain mechanistic understanding on the mechanical property change such as fatigue life and cyclic softening.
The cyclic stress-strain curve can be obtained from the fatigue stress-strain hysteresis curves around half life. Strain hardening decreased significantly at 873 K. The cyclic yield point was lower than the static one, especially at 873 K, that means cyclic deformation at elevated temperature will reduce the design margin. So, cyclic yield stress-strain curve of JLF-1 steel have to be applied for fatigue design and safety analysis.
In summary, this study has demonstrated that the fatigue life was dependent on temperature when plotted against the plastic strain range, which is not in agreement with the Coffin’s model. The TEM images showed that dislocation structure is dependent on temperature: at RT, dislocation rearrangements keeping high density; at 673 K, dislocation decrease to medium level; at 873 K, dislocation density decrease to low level. Loss of dislocation pile up will result in reduction of strain hardening at high temperature. The loss of strain hardening will be responsible for this phenomenon. It is also indicated that the phenomenon of cyclic softening of JLF-1 steel is a one of important issues for design, which will cause the reduction in design margin significantly. The cyclic yield stress curve is a base for design and safety analysis. The design stress of 1/3σUTS is acceptable at 873 K.
Contents
Chapter 1 Introduction
... 11.1 World energy composition and supplement... 2
1.2 Fusion reactor... 3
1.3 Candidate structural materials for blanket... 11
1.4 Mechanical properties of RAF/M steels... 15
1.5 Low cycle fatigue at elevated temperature... 26
1.6 Objectives of present research... 36
Chapter 2 Experimental Procedure
... 372.1 Chemical composition of JLF-1 steel and heat treatment.... 38
2.2 Tensile and fatigue specimens... 39
2.3 Test system... 40
2.4 Temperature profile of specimen... 44
2.5 Test procedure... 46
Chapter 3 Tensile Test and Microstructural Analysis
... 503.1 Tensile test results... 51
3.2 Effect of static deformation on microstructural change.... 55
3.3 Discussion... 59
3.4 Summary... 62
Chapter 4 Fatigue Test and Microstructural Analysis
... 634.1 Temperature effect on fatigue life and the mechanism... 65
4.2 Cyclic softening and the mechanism... 84
4.3 Hardness test results... 90
4.4 Summary... 95
Chapter 5 Consideration for design base
... 965.1 Effect of strain hardening on the design base... 97
5.2 Effect of cyclic softening on the fatigue design base... 99
5.4 Summary... 102
Chapter 6 Conclusions
... 103REFERENCE ... 106
LIST of PAPERS ... 111
LIST OF PRESENTATION... 112
ACKNOWLEDGEMENTS... 113
Chapter 1 Introduction
1.1 World energy composition and supplement
Our world will face the need for new energy sources as the growth of population, the absence of fossil fuels and the development of society. Figure 1.1 shows the world primary energy sources in use in 2000 [1]. Fossil fuels accounted for about 80% of the primary energy consumption, while the renewable sources of hydro and new renewable ones merely represented 4.4% of the energy consumption. Fossil fuels are sources with many problems difficult to resolve, such as environmental degradation at the local, regional and global level. Burning fossil fuels to get energy produces CO2 and causes air pollution, resulting acid rain. The release of CO2 causes a critical environmental issue of “green house effect”, which results in global warming and may cause more critical issue of abominable global climate.
Fig. 1.1 World primary energy production by source in 2000 [1].
On another hand, the supplement of fossil fuels is limited. It was predicted by Donald L. Klass [2] that oil reserves will be used up within 20-70 years at an annual growth rate of 2.3% in consumption and 30-70 years for the natural gas at an annual growth rate of 3.2%. R. Toschi [3] reported in 1997 that the proven recoverable reserves of energy were 800, 200, 200 and 80TWY for coal, oil, natural gas and nuclear fuel, respectively, and could be used for about 300, 50, 80, 100 years at the consumption rate of the year. Thus new energy source should be found to meet the energy requirement of our society in the future.
1.2 Fusion reactor
The major energy source in the 21st century and beyond should satisfy global environmental protection requirements while being closely related to national economy and security. Among the fission, fusion, and other source such as wind power, fusion has been actively considered as the 21st century energy source in the world’s major countries since fusion energy has potentially superior characteristics with respect to safety, environment acceptability, and resource availability [4]. Based on deuterium- tritium fusion reaction, there is an essentially unlimited fuel supply on the earth, deuterium from the ocean and tritium from transmutation of lithium by fusion neutron. On the other hand, global warming and acid rain will not happen as fusion will not produce CO2 or SO2.
1.2.1 Fusion reaction
The scheme of fusion reaction to produce fusion energy is schematically shown in Fig. 1.2.1-1 [5-8].
Fig 1.2.1-1 Scheme of D-T fusion reaction [6].
In contrary to fission, fusion reaction leads two light nuclei into one heavier nucleus with the release of substantial amounts of energy. There are many kinds of fusion reaction,
practical ones for energy on earth are shown on Fig. 1.2.1-2. The most suitable reaction occurs between the nuclei of two isotopes of hydrogen, deuterium (D) and tritium (T), at relatively the lowest ignition temperature since D-T reaction has the largest fusion cross-section among the reactions [8].
The mass loss is only 0.38% of the initial reactants for the D-T reaction. According to Einstein’s famous equation,
Mc2
E = (1.2.1-1) where E is energy, M is mass and c is the speed of light (3×10⁸m/sec.), the total energy output for the D-T reaction is 17.6MeV with 14.1MeV carried by the neutron and 3.5MeV by
4He [7]. So the D-T reaction could be written as:
D + T He+ n+ 17.6 MeV (1.2.1-2) At the temperature required for the D-T fusion reaction, the fuel has changed its state from gas into plasma in which the electrons have been separated from the atomic nuclei and move freely. For the fusion reaction, the two nuclei of D+ and T+ should have very high kinetic energy enough to overcome the electrostatic repulsion between the two nuclei.
The fuels of fusion reaction, D and T, are essentially inexhaustible. D could be easily extracted from seawater. The D content in seawater is about 30 ppm, that is, one liter of seawater contains about 0.03 g deuterium. The total volume of the seawater on the earth is about 13.7 billion cubic km, thus the D in the seawater is in the level of several billion billion kg. Tritium is a low-energy beta emitter with a half-life of 12.4y and thus there are few resources on the earth. However, it can be bred by causing the n released by the D-T reaction to interact with isotopes of lithium as follows [8]:
MeV n
T He n Li
MeV T
He n Li
5 . 2 '
8 . 4
4 7
4 6
− + +
→ +
+ +
→ +
Natural lithium consists of about 93%Li7 and 7%Li6, and there is abundant Li in the earth’s crust.
Besides D-T reaction, other reactions also receive attentions for possible energy
application (Fig 1.2.1-2) [6,7]. The D-D reaction eliminates the need for tritium breeding but has much higher ignition temperature and requirement for strong plasma energy confinement. Therefore it will require either a larger system or a more powerful method of plasma confinement. D-3He has a somewhat larger reaction cross-section, lower ignition temperature than D-D but is more difficult to use than D-T. The major concern is for the actual source of
3He fuel. This isotope is found in very small quantities on earth but there are adequate supplies in the near-surface crust of the moon due to deposits from solar wind over the ages. The feasibility and cost of recovery of such resources are serious issues. Other fusion reactions involving lithium have marginal or even negative net energy yields and are highly questionable as practical fusion power reactions [9].
Fig 1.2.1-2 Fusion ignition temperature and output energy at different fusion action [7].
Fusion energy is clean and safe [9]. Different from fission reaction, fusion reaction in a device will stop immediately in case of an accident because in such case the fuel (plasma) will cool down rapidly. The waste gas of the fusion reaction is helium that is an inert gas without any impact on the environment, and does not cause greenhouse effect. And yet, no products of radioactive waste like that produced by the fission fuels. Another product of fusion reaction is
the 14MeV energetic neutron, which is the source of the fusion energy and is stopped in the blanket of a fusion reactor. It has little impact on the environment. The reactor wall will be activated by the neutron and the material becomes radioactive, but the half-life is many orders-of-magnitude lower than fission products. The radioactivity can be minimized by careful selection of low-activation structural materials.
1.2.2 Fusion reactor
There are two ways, Magnetic Confinement Fusion (MCF) and Inertial Confinement Fusion (MCF), to achieve the controlled reactions to produce electric power on earth [7,10].
1) MCF involves that ionized (changed) nuclei are controlled by so much strong magnetic field that the nuclei will orbit a round the field line, gradually processing along it if the nuclei has some longitudinal velocity.
2) ICF uses intense energy beams (high-energized particle or laser) to compress and heat the tiny pellets in a reaction chamber, which will raise the temperature and density to sufficient condition of a fusion reaction.
These two methods have large difference in the standpoint of physics or engineering. The most promising approaches for fusion power is the MCF concept. Here only the introduction and study concerning MCF are mentioned. One of the promising confinements that mostly studied is the tokamak concept. In a tokamak device the magnetic field confines the plasma within a torus vessel and keeps the high-temperature plasma away from the vessel wall. The research on tokamak principle have been performed widely and got many achievements, such as TFTR in the U.S [11,12], JET in Europe [13] and JT-60U in Japan [14], et al. Now a tokamak type International Thermonuclear Experimental Reactor (ITER) is under design and is expected to have its first plasma at 2016 [5, 15-20]. Figure 1.2.2-1 shows the cutaway of ITER. The function of parts or system in ITER is as follow;
1) first wall and blanket absorb heat radiating from plasma, provide neutron shielding, 2) diverter exhausts the flow of energy from charged particles produced in fusion reactions and remove helium and other impurities,
3) vacuum vessel provide high vacuum boundary for the plasma and the first line of confinement against radioactive release within the vessel,
4) superconducting magnet systems, including the toroidal field (TF) coil, poloidal field (PF) coil and central solenoid (CS) coil, produce a strong magnetic field to confine the plasma,
5) cryostat keeps ultra-low temperature to superconducting magnet.
Fig. 1.2.2-1 ITER Tokamak cutaway [15].
The objectives of ITER are to demonstrate ignition and extended burns of D-T plasmas with steady-state as an ultimate goal, demonstrate the integration of technologies for reactors and serve as a test facility for advanced components such as blankets [21]. The fusion power is designed to 500 MW with a pulse mode operation [21-23].
Table 1.2.2-1 shows the general parameters of the future fusion devices [24], based on present knowledge in plasma and fusion technology. ITER is just an experimental reactor while the other two are reactors for power plants. In comparison, ITER has much lower fusion power and neutron wall load. For future fusion power reactors, the neutron wall load would be high up to 3 MW/m2, and hence advanced structural materials should be used. The integrated neutron wall load and the derived displacement damage will limit the lifetime of reactor components.
Plasma Vacuum Vessel
Blanket Blanket Module
Ports Center Solenoid
(CS) coil Toroidal Field (TF) coil Poloidal Field (PF) coil
Diverter Cryostat
Table 1.2.2-1 General performance parameter for fusion devices [24].
ITER DEMO* REACTOR
Fusion Power, GW 0.5-0.7 2-4 3-4
Neutron wall loading (first wall), MW/m2 0.57-0.78 2-3 2-3 Integrated wall load (first wall)
In MWy/m2
In displacements per atom (dpa)
~0.3-1 1.7-5.5
3-8 30-80
10-15 100-150
Operation mode Pulsed Quasi-continuous
DEMO: Fusion power demonstration reactor.
1.2.3 Blanket system
Fig. 1.2.3-1 View of ITER vacuum vessel [25].
The blanket is located between the plasma and vacuum vessel (Fig. 1.2.3-1). In the Basic
Performance Phase (BPP), ITER adopts a shielding blanket to provide the main thermal and nuclear shielding to the vessel and external machine components [25].
The breeding blanket concept in design is dependent on a number of parameters, such as neutron flux, safety, availability, tritium breeding ratio etc [26]. Based on these parameters, the materials selection and structure design can be performed.
The ITER blanket is operated at a low temperature (423-523 K) and lower integrated wall loading. Type 316LN austenitic steel is main structural materials for the ITER vacuum vessel and in-vessel components (shielding blanket, divertor cassettle body) [27]. However, the maximum irradiation dose for type 316 stainless steel is about 5-7 dpa (for neutron wall loading about 1MW/m2) within the operation temperature range of ITER [28]. For DEMO and future reactor, the irradiation dose and operation temperature are higher than that in ITER (Table 1.2.2-1) [24,29], void swelling should be considered for type 316 stainless steel in such rigorous condition. So the type 316 stainless steel cannot be applied to design high power density blanket as its low thermal conductivity.
Several fusion reactor blanket concepts for DEMO were developed and will be tested and irradiated in ITER (Table 1.3.2-1). All of them could be classified with regard to the breeding materials into two categories [29-34]; solid ceramic and liquid metal breeders with the options of self-cooled or separately cooled versions.
Table 1.2.3-1 Major breeding blanket concepts [26, 29-34].
Coolant Tritium
Breeder
Structural material
Neutron multiplier
Operation Temperature
(K)
LiCe/FM/Be He/H2O Li-ceramic F/M Be 523-823
LiCe/SiC/SiC/Be He Li-ceramic SiC/SiC Be 723-1223
Li/V Li Li V-alloy Li 623-1023
Pb-Li/FM Pb-Li /H2O Pb-Li F/M Pb-Li 523-823
Flibe/FM Flibe Flibe F/M Be 723-823
Flibe/V Flibe Flibe V-alloy Be 823-973
LiCe – Lithium ceramic breeder materials such as Li2O, Li4SiO4, Li2ZrO3 and Li2TiO3. F/M: Ferritic/Martensitic steels.
Flibe: BeF2+LiF.
The maximum temperature is limited by high temperature creep-rupture strength of structural material and/or its corrosion resistance to breeding materials or coolant. The possible low temperature or coolant inlet temperature is limited by irradiation hardening and embrittlement of structural materials. The thermal efficiency increases with the increase of the upper operation temperature, and could be further increased by use of more advanced material/technology and blanket concept.
The structural integrity depends on the properties of the structural materials. So, development of reactor materials and power generating blankets is a critical issue for early realization of fusion energy.
1.3 Candidate structural materials for blanket 1.3.1 Requirement for structural materials
The long-term goal of fusion materials researches is to develop structural materials that will permit fusion to be developed as a safe, environmentally acceptable, and economically competitive energy source. The safety of fusion power plant depends on the following items [35].
1) The structural integrity of the plant and the probability of its failure; 2) The radioactive decay heat generated in the absence of coolant; and
3) The paths for dispersion of radioactivity to the plant surrounding during accident. The structural materials of the first wall in D-T tokamak reactor during service are subjected to the following [35-38].
Mechanical and electromagnetic loading and alternating thermal stresses induced by the surface and volumetric heating and pulsed nature of operation.
Irradiation with high energy (14.1 MeV) fusion neutrons producing displaced atoms and helium, hydrogen, and solid transmutation products, leading to changes in bulk properties.
Thus, the requirements for structural materials of the first wall of blanket in a fusion reactor is more difficult than that for any other energy system [4], including high fluxes of high energy (14MeV) neutrons, high surface heat fluxes and high temperature coolants and breeding materials. The blanket systems are large systems with combined thermal, hydraulic and mechanical loading, irradiation, corrosion etc. The common requirements for fusion structural materials are the followings [9].
1) The material could withstand high neutron wall loads under temperatures and coolant pressure conditions necessary to drive efficient thermodynamic cycles in a blanket. 2) The lifetime of structural material must be long enough to minimize the necessary
replacements of near-plasma components.
3) The material should be of low activation in order to achieve the ultimate environmental attractiveness of fusion power.
It is the special requirement in the fusion reactor that the structural materials should be
"low activation" [4]. The fusion reaction does not produce radioactive nuclides. Any radioactivity produced in a fusion reactor derives from capture of neutrons in the structural materials, coolant, or tritium breeder. This leads to important potential advantages of fusion relative to fission in the key areas of safety and environmental impact and relative to fossil generation in the area of environmental impact. By careful selection of the chemical elements, the amount of long half-life radioactivity of structural materials can be reduced to the point that the materials are innocuous after as little as a 50 or 100 years decay period. Recycle of materials, which would tremendously reduce the amount of radioactive waste to be disposed of, may be a possibility.
Fig. 1.3.1-1 Comparison of γ-dose rate for F82H, V-alloy and SiC/SiC composites [35].
There are reduced activation ferritic/martensitic (RAF/M) steels (F82H, JLF-1 and Euofer 97 etc.), V-based alloys, and SiC composites for near-, mediate- and long-term applications in fusion reactor [36]. The level of long-term activation (γ-dose rate) for F82H, V-4Ti-3.3Cr and SiC/SiC composites, which determines the way of waste disposal and recycling after intermediate storage, is shown in Fig. 1.3.1-1. After 100 years decay time, γ-dose rate is in the range of low-level waste (less than 10 mSv/h) and can be recycled by
remote handling method. Especially V-alloy and RAFM steel have a potential to reach the hand-on limit (10 µSv/h) within 100-1000 years.
1.3.2 Candidate structural materials for blanket
The initial choices for candidate low activation structural materials, SiC/SiC composites and V–Ti–Cr alloys, were developed in the United States in the early 1980s. Subsequently the possibility of developing RAF/M steel based on the idea of substituting W for Mo and using V and/or Ta in place of Nb as the carbide forming element(s) was developed [27]. Successful development of these materials will provide significant improvements relative to conventional materials.
SiC/SiC composites, developed for aerospace application and fossil power generation plants, are the activation material with potential for very high operating temperature because of their high temperature strength, strength to weight ratio and high corrosion resistance [39, 40]. However, SiC/SiC composites are still the least developed of the three candidate materials because of its remaining several critical issues. The remaining issues include the low thermal conductivity of most commercially available products, high-strength joining techniques leading to a high difficult for hermetic seals, chemical compatibility with potential liquid coolants, the need to develop engineering structural design criteria for ceramics, and so on. There are also concerns regarding high present-day fabrication costs and the limited industrial technology base for production of large-scale SiC composites [38, 40, 41].
Vanadium alloys are another attractive candidate materials for fusion reactor structure components due to their high-temperature strength, high thermal stress factor, and low induced activation characteristic [37,42]. V-4Cr-4Ti ternary alloy is considered to be a leading candidate material, especially the NIFS-HEAT shows various benefits by reducing the level of oxygen and other trace impurities [42]. Much of recent research has focused on vanadium alloys containing 4-5% Cr and 4-5% Ti, but a number of alternative composition and processing routes have been explored in an effort to achieve improved performance [43, 44]. There are several critical issues for the alloys used in a self-cooled blanket. The main one is the development of insulator coating to mitigate MHD pressure drop effects in liquid lithium coolant channels. Additional topics where further work is needed include investigation
of possible engineering solutions to the high tritium permeability in vanadium alloys, determination of irradiation creep behaviors at 674-973 K and the fundamental deformation mechanisms that control high temperature thermal creep, and the incomplete understanding of the influence of interstitial impurities such as C, N and O on tensile, creep and fracture properties. The lack of a widespread commercial infrastructure for production of vanadium alloys is also of concern [38, 45].
RAF/M steels, developed from 9-12% Cr with 1% Mo steel, are candidate materials for fusion reactor as its inherently good dimensional stability under intense irradiation conditions, and the chemical composition of such steels is suitable for commercial production of a reduced-activation composition without a large industrial investment [46-48]. Creep strength of 9-12% Cr steel is adequate to 823 –873 K, and they have been used at these temperature in power-generation and chemical and petrochemical industries. The technology for production and fabrication of 9-12% Cr steel exists. A major issue of this material is the radiation induced hardening/embrittlement and degradation of fracture properties [38].
Of the three materials for fusion applications, RAF/M steels are furthest in development. There exits a well-developed technology and a broad industrial experience with the ferritic-martensitic steels in fossil and nuclear energy technology. Also RAF/M steels have the advantage for construction of massive structure of a fusion power plant based on the past experience of the commercial 9-12% Cr steel. For both Vanadium alloys and SiC/SiC composites, the technique for constructing of such structure must still be developed.
Thus, the RAF/M steel is considered as the leading candidate structural material for the first wall in fusion reactor. To qualify and finally validate the application of RAF/M, a sufficient design database must be accumulated, including code approval aspects.
1.4 Mechanical properties of RAF/M steels 1.4.1 Development of RAF/M steels
The 9-12% Cr martensitic steels were originated in 1912 with the manufacture of 12% Cr-5% Mo steel for steam turbine blades in Germany [35]. Subsequently, the 9-12% Cr steels with lower carbon (0.1% max.) contents and additions of Mo, W, V, Nb, N and other elements, possessing higher creep-rupture strengths combined with good oxidation and corrosion resistance at elevated temperature, have been developed and used in petrochemical and chemical plant, gas turbine engineering, aircraft and aerospace industries, electrical power plants, and nuclear fission plants.
The 9-12% Cr ferritic/martensitic steels were introduced into the fusion materials programs about 30 years ago, after research in fast reactor programs demonstrated their superior swelling resistance and excellent thermal properties compared to austenitic stainless steels. But two types of problem are of concern with the use of a ferromagnetic material in the high magnetic field of fusion reactor:
1) The effect of the field perturbation caused by the ferromagnetic material on the plasma.
2) The magneto-static force on the ferromagnetic structure due to the magnet field. Calculations showed that the field perturbation was small. The magnetic stress on ferritic steels was small but not negligible, and it was concluded that they must be incorporated in the stress analysis of design [35, 49, 50].
The first steels considered were conventional 9% and 12% Cr ‐Mo steels. Because of long radioactive decay times for some activated species in the steels (e.g., molybdenum and niobium), reduced-activation ferritic/martensitic steels has been developed in the 1980s in the EU, Japan, Russia and the US [38, 45-48].
The objective is to maximize the safety advantages of fusion and enable material and components maintenance, waste management and recycling scenarios to be established [51, 52]. The principal in this development are as follows:
The replacement of radiologically undesirable Mo, Nb and Ni in the exiting commercial steels by elements such as W, V, Mn, Ta, and Ti, which have equivalent
or similar effects on the constitute and structure.
The removal of the impurities that adversely influence the induced activities and dose rates when present in low concentration in the steel.
Since Fe–Cr–Mo steels were candidates for cladding materials in LMFBR, extensive irradiation database is available, which is useful for screening the Fe–Cr–W alloys. Based on a series of irradiation tests [52,53], 8–9% Cr was selected as an optimum level (see section 1.4.3). The comparative tests with Fe–Cr–Mo and Fe–Cr–W steels showed that the alloy properties of Fe–Cr–W were similar or superior to those of Fe–Cr–Mo. Especially, Fe–Cr–W steels were shown to have less shift of DBTT induced by irradiation compared to Fe–Cr–Mo steels (Fig. 1.4.1-1) [54].
Many kinds of composition of RAF/M were investigated in the European, US, and Japan. The development history of RAF/M is shown as bellow.
1960’s : 9Cr-1Mo (British 9 Cr)
1970-80’s: 9Cr-1MoNbV (ORNL, USA) 1980’s: MANET (EU, 10Cr)
1980-90’s: RAF/M (Rapid decay to recycle limits or hands-on limits, no Mo and Nb) F82H (Japan, 8Cr-2W)
9Cr-2WVTa (USA, 9Cr-2W) JLF-1 (Japan, 9Cr-2W) Eurofer 97 (EU, 9Cr-1W)
The composition of the RAF/M steels, which appear to have stable microstructure and favorable combination of strength, toughness, and resistance to radiation damage, are summarized in Table 1.4.1-1.
Fig. 1.4.1-1 Irradiation temperature effect on DBTT in ferritic steels [54] (The bracketed number indicate the dose in dpa).
Table 1.4.1-1 Typical composition (wt%) of RAF/M with favorable properties.
C Si Mn Cr V Ta W N B Ref.
F82H 0.10 0.20 0.50 ~8.0 0.20 0.04 ~2.0 <0.01 0.003 52,55,56 JLF-1 0.10 0.08 0.45 ~9.0 0.20 0.07 ~2.0 0.05 52,57,58 EUROFER 0.10-0.120 0.05 0.4-0.6 8.0-9.0 0.20-0.30 0.06-0.10 1.0-1.2 0.02-0.04 0.004-0.006 52, 59
9Cr-2WVTa 0.10 0.30 0.40 ~9.0 0.25 0.07 ~2.0 52, 60
1.4.2 Martensitic phase transformation
The 8-9% Cr steels are austenitic structure at austenitizing temperature in the range of 1123 K to 1473 K (850 to 1200℃ in Fig. 1.4.2-1). The austenite phase transforms to martensite
during air cooling or rapid quenching to ambient temperature (Fig. 1.4.2-2), and the steels are subsequently tempered to obtain a good combination of strength, ductility, and toughness.
Fig. 1.4.2-1 Effect of Cr on Fe-Cr-C alloy containing 0.1% C [35].
Fig. 1.4.2-2 Continuous cooling transformation (CCT) diagram for low carbon 7.5Cr-2WVTa (F82H) steel determined after austenitization at 1323 K for 0.5 h [61].
The martensitic transformation is a diffusionless phase transition in the solid state with a large deviatoric component, which proceeds by the nucleation and growth of the new phase. From the viewpoint of thermodynamics, the free energy is decreased during the transformation from austenite to martensite [62,63]. The relationship between free energy of austenite (γ) and martensite (M) phases with temperature is shown in Fig. 1.4.2-3. At temperature of M, the transformation is happened, the driving force is the energy difference between austenite and martensite:
M
M G G
G = −
Δ γ→ γ (1.4.2-1)
Fig. 1.4.2-3 Chang in free energy of γ and M phases with temperature [62].
The precise atomistic mechanism for the nucleation and growth of the martensite is unclear. Different models have been advanced for this in conventional martensites. But the fundamental is Bain mechanism [62]. The change in crystal lattice is shown in Fig. 1.4.2-3. The steels have a close-packed face centered cubic (fcc) structure at austenitizing temperature. On cooling this structure becomes unstable and transforms to a body-centered cubic (bcc) lattice as required by thermodynamics. The elementary bcc cell is a cube with the atoms on
the corners and with an additional atom in the center. The transformation from fcc to bcc can be considered as a homogeneous distortion. This can be made clear by Fig. 1.4.2-4. In this figure are drawn two fcc cubic cells, and within them a smaller cell containing an atom in the center. This is a body centered tetragonal (bct) cell. By a homogeneous compression in the vertical direction, indicated by the arrows, and an expansion in the plane normal to it, a cubic bcc lattice is created without the need to change the volume of the bct cell.
Fig. 1.4.2-4 Change in lattice structure during martensitic transformation [63].
Iron is the base of the steels that have good characters due to their strength and hardness. This is due to the presence of the small carbon atoms. They find sufficient space in the interstitial sites between the iron atoms in the fcc structure and therefore dissolve easily in large quantities at high temperatures. When this fcc ‘austenitic’ lattice transforms martensitically at sufficiently high cooling speeds to the bcc structure, the space for the carbon atom is reduced, and the carbon, having no time to diffuse to more convenient sites produces a high degree of distortion around it which makes the alloy very hard.
1.4.3 Basic mechanical properties of RAF/M 1.4.3.1 Tensile test results
The tensile results were reported in [52, 58, 64-69]. The tensile properties of JLF-1 and F82H are shown is Fig. 1.4.3.1-1, there were little difference in yield stress (YS), ultimate tensile strength (UTS), total elongation (Et) and reduction in area (RA) [58, 64].
(a)YS and UTS of JLF-1 and F82H. (b) Et and RA of JLF-1 and F82H.
Fig. 1.4.3.1-1 Tensile property of JLF-1 and F82H [58,64].
Fig. 1.4.3.1-2 Dose dependence of YS and Et following irradiation at 673 K [52].
Fig. 1.4.3.1-2 shows the irradiation effect on YS and Et at 683 K in FFTF/MOTA (Fast Flux Test Facility/Materials Open Test Assembly) and HFIR (High Flux Isotopic Reactor). Both JLF-1 and F82H showed rapid irradiation hardening in the early stage of displacement damage. Above 20 dpa, irradiation hardening decreased and then saturated at a lower strength level [52]. One explanation for the maximum in strength with the influence is that beyond the peak strength irradiation-enhanced softening (recovery) has proceeded [35].
UTS
YS
RA Et
The tensile results of EUROFER 97 without irradiation were reported in reference[67-69]. The UTS and Et of EUROFER 97 was similar to that of F82H.
1.4.3.2. Impact test results
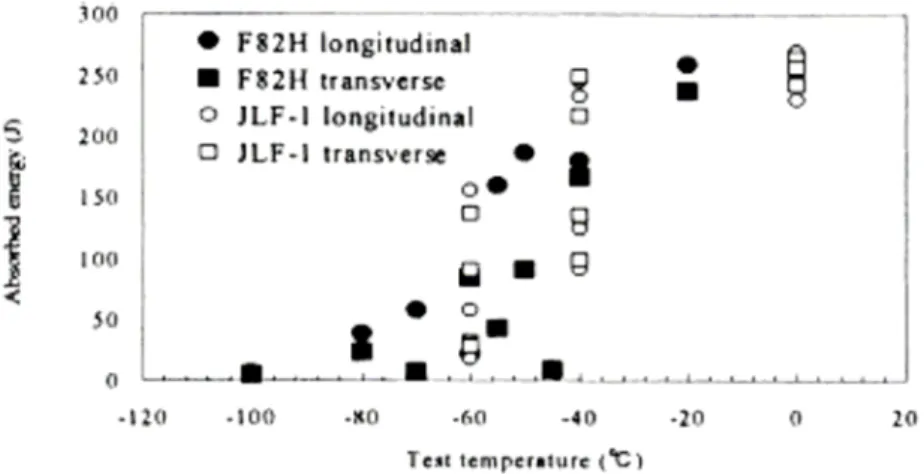
Fig. 1.4.3.2-1 shows the charpy impact test results of JLF-1 and F82H. Little differnce was observed between them.
Fig. 1.4.3.2-1 Charpy impact properties compared with F82H [58].
Fig. 1.4.3.2-2 Effect of Cr content on DBTT shift of RAF/M irradiated in the FFTF [52].
Fig. 1.4.3.2-2 shows the effect of Cr composition on the DBTT shift for Fe-CrWVTa
steels of various composition after irradiation in FFTF [52]. It appeared that there was a minimum in DBTT shift in the vicinity of 9 Cr. At the same time, the addition of W, V and Ta could reduce the DBTT shift in irradiation.
1.4.3.3 Creep test results
Fig.1.4.3.3-1 shows creep rupture strength of JLF-1 and F82H. The properties of JLF-1 was similar to those of F82H [58].
Fig.1.4.3.3-1 Creep rupture strength of F82H and JLF-1 [58].
Fig.1.4.3.3-2 shows average creep coefficient (B) for JLF-1 and F82H as a function of irradiation temperature to maximum dose of 62 dpa. The difference between F82H and JLF-1 at 793 K (520 ℃) was concluded to be due to the lower tantalum and nitrogen in F82H compared to JLF-1. The higher coefficient for F82H at 873 K (600 ℃) is due to the dominance of thermal creep [70].
Fig.1.4.3.3-2 Temperature dependence of the average creep coefficient (B) for F82H and JLF-1 [52, 70].
Fig. 1.4.3.3-3 Creep rupture strength of the 9Cr-W-0.1C as a function of W concentration [71].
The effect of tungsten on creep behavior of 9Cr-W-0.1C steels was investigated in reference [71]. The creep rupture strength of the steels was shown in Fig. 1.4.3.3-3 as a function of W concentration, the strength increase linearly when W concentration was lower than 3% where is the region of tempered martensite. When the W concentration is above 3%, the tendency of creep rupture strength was decreased because the steel consisted of tempered martensite and δ–ferrite.
Overall mechanical test results suggested that 9Cr-2W (JLF-1) steel has the best performance under irradiation, so JLF-1 is strong candidate of low activation ferritic/martensitic steel as a future fusion structural material at present.
1.5 Low cycle fatigue at elevated temperature 1.5.1 Fatigue
The most common type of mechanical failure is caused by fatigue, which means a machine part or a whole structure is loaded by cyclic external stress or strain, and a complete fracture may occur [35,72].
Fatigue tests are controlled either by stress (load) or strain (displacement). The majority of the early studies of metal fatigue were based on stress control testing, which is still adopted for design situation within elastic range and resulting endurance is high [high cycle fatigue (HCF)], fatigue life is over 105 cycles. However, the strain-controlled test is applied in design and evaluation of components whenever the load is high as in the vicinity of the notches where plastic deformation is significant. In this case, the response of the material is deformation dependent, the ductility is the dominant factor governing the fatigue behavior, and the number of cycles to failure is low [low cycle fatigue (LCF)], fatigue life is in the region 102~105.
Fig. 1.5.1-1 shows the stress-strain hysteresis curve of LCF test, from which the total strain range (Δ ), plastic strain range (εt Δ ), elastic strain range (εp Δ ), total stress range εe
(Δσ) and peak stress could be obtained.
Stress
Strain Plastic strain range
Total strain range
Stress range
Peak stress
(Δε
t)
(Δε
p)
(Δσ)
Elastic strain range (Δε
e)
Fig. 1.5.1-1 Typical fatigue stress-strain hysteresis curve of LCF test
The plastic strain range (Δ ) and fatigue life (εp N ) can be expressed by the f
Manson-Coffin’s relation [72, 73]:
b f
p A N
= −
Δε ( ) (1.5.1-1) where A and b are material constant.
10
-110
010
110
210
310
410
5Δε
t, Δ ε
ta n d Δ ε
e(% )
N
f(cycles)
Δε
p=A(N
f)
-bΔε
e=C/E(N
f)
-dΔε
t= Δε
p+ Δε
eFig. 1.5.1-2 Schematic drawing of Δ , εt Δ and εp Δ versus εe N . f
But many machine parts are practically working in the regime of constant total strain range. Fatigue tests are also very often advantageously performed under conditions of total strain range control. Total strain range (Δ ) consists of two components: plastic strain range εt (Δ ) and elastic strain range (εp Δ ). εe
e p
t ε ε
ε =Δ +Δ
Δ (1.5.1-2) Elastic strain range (Δ ) is related to stress range (εe Δσ) by Hook’s law.
e E ε = Δσ
Δ (1.5.1-3)
The relationship between stress range (Δσ) and fatigue life (N ) can be expressed as f follows [72]:
d
Nf
C −
=
Δσ ( ) (1.5.1-4)
Thus, the Δεt―N can be expressed as follow. f
d f b
f e
p
t A N C E N
−
− +
= Δ + Δ
=
Δε ε ε ( ) / ( ) (1.5.1-5)
Fig. 1.5.1-2 shows the total strain range (Δ ), plastic strain range (εt Δ ) and elastic εp
strain range (Δ ) change with fatigue life (εe N ). f
Temperature is one of the important external parameters influencing fatigue life. The Mason-Coffin relation of steel A 286 in air and vacuum is shown in Fig. 1.5.1-3 [72]. In air, it is well known that fatigue is decrease with temperature. But in vacuum, as shown in Fig 1.5.1 -3, the Manson-Coffin curves determined at room temperature (RT) and 866 K (593 ℃) are
― within limits of experimental scatter band ― the same. Coffin [73] summarized the data of the LCF properties of several materials in vacuum or inert gas atmosphere and concluded that plastic strain range versus fatigue life curves of various steels, aluminum alloys and some refractory metals converged into a scatter band of 0.5 in factor, and that the degradation of fatigue life at high temperature did not occur when fatigue life plotted against the plastic strain range. Thus the reason for the strong temperature dependence of the Manson-Coffin curves in air is due mainly to oxidation, which changes the mechanism of crack nucleation and propagation [72]. From Fig. 1.5.1-3, the frequency effect is significant in air, but little in vacuum. That means the frequency effect is also primarily due to oxidation environment.
So the fatigue process at high temperatures is (with the exception in vacuum tests) always a corrosion fatigue process [72].
Fig. 1.5.1-3. Manson-Coffin’s relationship of steel A 286 in vacuum and air [72].
1.5.2 Cyclic loading of structural materials of fusion reactor
Structural components of fusion reactor such as first wall, blankets and magnetic system should withstand tensile, creep, fatigue, creep-fatigue deformation during a reactor lifetime when material is subjected to high-energy neutron irradiation. Material must at all times retain adequate toughness in order to resist unexpected high strain deformation from disruption, electromagnetic force, pressure surges and earthquake [74]. Design against these failure modes requires the following knowledge [75]:
Irradiation damage and different source of loading and their dependence on time. Material behavior response to static loading (stress, strain, plastic, strain hardening,
creep, etc).
Material behavior response to cyclic loading (fatigue life, cyclic softening or hardening, crack initiation/propagation, fatigue-creep, etc).
Material response to high, rarely occurring overloading by ultimate failure by unstable crack extension or by plastic collapse.
Due to pulse mode operation of ITER, the variation of temperature and stress at a point of structure material is schematically shown in Fig. 1.5.2-1. The stress ranges (Δσ) or strain ranges (Δε ) caused by stress range are responsible for cyclic deformation of material. So the
Plastic strain range (%)
Fatigue life (cycles)
first wall in pulse D-T tokamak fusion system will undergo thermo-mechanical fatigue (TMF) as a result of the mechanical and electromagnetic loading, and the cyclic loading induced by temperature change during the plasma burn/dwell period. There are two approaches to estimate the fatigue life of structural materials under thermo-mechanical cycling. The first one is to get the relationship of cyclic loading and lifetime directly from TMF tests [76-80]. However, the acquisition of TMF data on materials by testing with simultaneously varying temperature and strain is experimentally difficult, time consuming and expensive, and the experimental procedures have not been standardized, further more the TMF data cannot be applied in design code [76]. Consequently most of relevant materials data has been generated by second approach of isothermal cyclic fatigue (ICF).
Fig 1.5.2-1 Temperature (a) and stress (b) variation during one burn/dwell cycle [75].
The change in stress during one burn/dwell cycle in Fig. 1.5.2-1 may be elastic. But time dependence swelling and creep effect lead to an addition change in stresses and strains. Furthermore, earthquake will incur the stress and strain larger than that at normal operation. In another hand, stress concentration of some parts of structure will also cause bigger stress in local position. If the combined mechanical and thermal cyclic loading is sufficient high, the cyclic plastic deformation will happen. Thus, the LCF property of structural material is necessary for design.
1.5.3 LCF behavior of RAF/M
Strain-controlled fatigue test of RAF/M steel with fully reversed triangular wave forms
( 1,
max
min =−
=ε ε
R where εmin and εmax are minimum and maximum strain) have been carried out in air and vacuum at RT and elevated temperature.
0.1
1
10
10
210
310
410
510
6F82H, RT, Vacuum
F82H, 673 K, Vacuum
F82H, 773K, Vacuum
F82H, 873 K, Vacuum
F82H, 923 K, Vacuum
T o ta l s tra in ra n g e ( % )
Number of cycles to failure (cycle)
Fig. 1.5.3-1 Δεt―N relationship of F82H at RT and elevated temperature f in vacuum [81].
Figure 1.5.3-1 shows the Δεt ― Nf relationship of F82H [81]. No significant difference was observed when F82H tested below 773 K (500 ℃), which means the Δεt―
N relationship of F82H was temperature independence at this temperature region. When f
temperature above 873 K (600 ℃), a large reduction in fatigue life of F82H was observed. At
all test temperature, cyclic softening was observed (Fig. 1.5.3-2).
Fig. 1.5.3-2. Cyclic stress response curves for different temperatures at a control strain range of 1.5% of F82H [81].
The phenomenon that Δεt―N relationship is temperature independence was also f reported on MANET I from RT to 723 K, and Mod. 9Cr-1Mo from 755 K to 977 K [35]. The reason for this phenomenon is still unclear.
For JLF-1 steel, LCF test was carried out with round bar specimen (Fig. 1.5.3-3), mini-size and full-size hourglass specimen (Fig. 1.5.3-4) [83, 84]. The method to get the total strain range was different: the axial strain range (Δεz) was measured directly from the parallel part of round bar specimen; for hourglass specimen, the axial strain was converted from the diametral strain range (Δεr).
Fig. 1.5.3-3 Round bar specimen [83]. εz
Δ
Fig. 1.5.3-4 Mini-size (a) and full-size (b) hourglass specimen [84].
The advantages and disadvantages of hourglass and round bar specimens are summarized in Table 1.5.3.1.
Table 1.5.3-1 Advantages and disadvantages of hourglass and round bar specimen. Hourglass specimen Round bar specimen
Crack initiation Center part Random distributed along the parallel part
Deformation measurement Diametral Axial
Buckling Resistance Little resistance
Strain evaluation Need conversion Real
The shape and size effects on fatigue life are shown in Fig. 1.5.3-5. The Δεt―N f relationship of hourglass specimen is steeper than that of round bar specimen. For hourglass specimen, the size effect should be considered.
ε
rΔ
10-1 100 101
102 103 104
Hourglass (Mini-size) Hourglass (Full-size) Round bar (Full size)
Total strain range (%)
Number of cycles to failure (Cycle) For hourglass specimen:
Δεz=(σ/Ε)(1-ν)-2Δεr
Fig. 1.5.3-5 Shape and size effects on fatigue life of JLF-1 steel at RT in air [83, 84].
Fig 1.5.3-6. Change in peak stresses during fatigue tests of JLF-1 [83].
Same as F82H, cyclic softening of JLF-1 steel was observed at RT (Fig. 1.5.3-6). A little difference is that strain hardening was observed in initial cycles. That means dislocation was tangled at initial cycles, then dislocation annihilation occurred, so cyclic softening was observed.
The published paper on LCF of RAF/M steel is summarized in Table 1.5.3-2. The LCF
properties and microstructure evolution of JLF-1 steel at elevated temperature are necessary to be investigated.
Table 1.5.3-2 Published paper on LCF of RAF/M.
Temperature Specimen type JLF-1 F82H Eurofer 97
Engineering sized [83] [81] —
Round bar
Mini-sized — [82] —
Engineering sized [84, 88] — —
RT
Hourglass
Mini-sized [84] [87] — Engineering sized Necessary [78, 81,86] [78]
Round bar
Mini-sized — [68] [68]
Engineering sized [85] — —
Elevated
Hourglass
Mini-sized — — —
1.6 Objectives of present research
Among the fission, fusion, and other source such as wind power, fusion has been actively considered as the 21st century energy source in the world major countries. The structural integrity of fusion reactor depends on the properties of the structural materials. Thus, development of reactor materials and power generating blankets is a critical issue for early realization of fusion energy. Of the three materials for fusion applications (RAF/M, V-alloy, and SiC/SiC), the RAF/M steel is considered as the leading candidate structural material for first wall in fusion reactor as there exits a well-developed technology and a broad industrial experience with the ferritic/martensitic steels in fossil and nuclear energy technology. From the results of irradiation, JLF-1 is the strong candidate low activation ferritic/ martensitic steel as future fusion structural material.
LCF behaviors of JLF-1 steel at elevated temperature are necessary for plastic design since the cyclic plastic deformation will happen if the combined mechanical and thermal cyclic loading of first wall is sufficient high. To avoid the shape, size, and environment effects, the LCF test should be carried out with engineering size (6-8 mm in diameter) round bar specimen in vacuum.
Thus the objective of this research is to study the tensile and LCF behavior of a candidate material of first wall, JLF-1 steel, at elevated temperature with an engineering size specimen in vacuum. It includes the following contents:
1) Temperature effect on the relationship between fatigue life and plastic strain range. 2) Cyclic softening/hardening and its mechanism.
3) Cyclic yield stress-strain curves and its application on design.
To obtain basic information of RAF/M at elevated temperature, the tensile test was also carried out.
Chapter 2 Experimental Procedure
Action of development RAF/M steels for fusion reactor application has been carried out under IEA international collaboration. The 9Cr-2W ferritic steel, named JLF-1, was fabricated in Japan [52, 57]. The material in this research is the second heat JLF-1 steel plate, 25 mm and 15 mm in thickness.
2.1 Chemical composition of JLF-1 steel and heat treatment.
JLF-1 was designed to have good irradiation resistance, high temperature mechanical performance and high toughness as well. The chemical composition of the JLF-1 steel plate in wt% is shown in Table 2.1-1. The plate was 15 mm thick and had a heat treatment as follows: 1323 K/3.6 ks/air cooling (normalizing) and 1052 K/3.6 ks/air cooling (tempering) [83]. The microstructure is tempered martensite, to be shown in Fig. 3.2.2-1 (a).
Table 2.1-1 Chemical composition of JLF-1 (wt%) [83].
C Si Mn P S Al Cr W V Ta N B Ni Cu Mo Nb
0.10 0.05 0.45 0.003 0.002 0.003 8.85 1.99 0.20 0.080 0.0231 0.0002 <0.01 < 0.05 < 0.001 < 0.002
The addition of W (< 3%) improves creep strength in high Cr steel, but excess addition, more than 2~3%, cause toughness degradation due to δ-ferrite formation. V addition also improves the creep strength at elevated temperature, but excess V addition causes significant coarsening of carbides at high temperature, resulting in severe degradation of mechanical properties. Nb has similar role as V, but it is harmful element from the standpoint of low activation alloy design. Thus, Ta is chosen to be added for high temperature strength improvement as Ta has equivalent role as Nb. Ti additions is thought to suppress irradiation induced void formation. Small amount of N is considered to improve high temperature creep strength [70].
2.2 Tensile and fatigue specimens
According to ASTM standard [89-91], the shape and dimension of tensile and fatigue specimen was designed as Fig.2.2-1. To save material, 15mm×15mm×70mm sticks were cut from the JLF-1 steel plate, followed by welding two SM500 steel blocks with electrion beam (EB) at the both ends of the stick, then, it was machined to the tensile and fatigue test specimens.
R1
26
20 20
C0. 5
160
8
30
14 φ
φ
φ
70
EB EB
JLF-1 SM500 R3
5
R1
26
20 20
C0. 5
160
8
20 R3
5
14
70
φ
φ
EB JLF-1
EB
φ
SM500
Fig. 2.2-1 Tensile (a) and fatigue (b) test specimen.
(a)
(b)
2.3 Test system
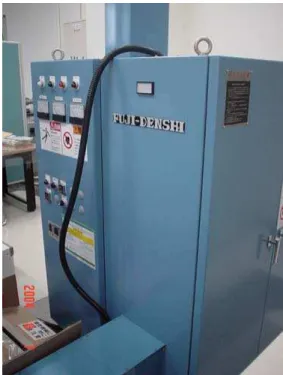
To avoid the oxidation effect, the tensile and fatigue specimens of JLF-1 steel should be tested in vacuum at elevated temperature. Testing system includes three parts: mechanical machine, vacuum system, and heating system. The schematic drawing of the testing system is shown in Fig. 2.3-1.
Fig. 2.3-1 Scheme of test system.
The specimens were tested in vacuum chamber. The temperaturewas measured by thermal couple, and the signal of thermal couple was feedbacked to heating system to control the temperature stable during test. The load and axial displacement were measure by the load cell and extensometer directly, and the signal were recorded by X-Y recorder, X-t and Y-t recorder, and Data loger.
Vacuum system
Fig 2.3-2 Vacuum system.
The vacuum system consisted of oil rotary pump, molecular pump (Fig 2.3-2), and vacuum chamber (Fig 2.3-3). The capacity of the vacuum system is ~10-3 Pa.
Mechanical test machine
The mechanical test machine is the Shimazu Servopulser with a dynamic load capacity of ±10 tons. Specimens were tested in the vacuum chamber (Fig 2.3-3), and heated by an induction coil. Axial strain was measured by a Shinko 1501-93-20 extensometer, which has a differential transducer with gage length (G.L.) of 12.5 mm and the capacity of ± 1 mm. To reduce the noise generated from the induction coil and keep the temperature of extensometer stable during tensile and fatigue tests at elevated temperature, a water cooling jacket was installed.
Molecular pump
Oil rotary pump
Fig 2.3-3 Inner equipment of vacuum chamber.
Induction heating system
Fig 2.3-4 Power supply for induction heating device. Clamp Induction
coil
Extensometer
Water cooling jacket Specimen
The power supply for induction heating device is shown in Fig 2.3-4. The parameter of heating system are 100 kW of input power, 100 kHz of induction frequency, and a capacity of form RT to 973 K with sensitivity of 0.1 K.
2.4 Temperature profile of specimen
The temperature control is the key to carry out the tensile and fatigue test at elevated temperature. Before the research, the temperature profile was obtained.
200 300 400 500 600 700 800 900
-20 -15 -10 -5 0 5 10 15 20 RT 373 K 473 K 573 K 673 K 773 K 873 K
Temperature (K)
Distance from center (mm) Uniform zone
(a) Axial distribution along the parallel part of specimen.
300 400 500 600 700 800 900
300 400 500 600 700 800 900 CH2 (K) CH3 (K) CH4 (K) Temperature measured by CH2, CH3 and CH4 (K)
Temperature controlled by CH1 (K)
(b) Circular distribution in temperature uniform zone. Fig. 2.4. Temperature profile of specimen.
Ch1
(Controller)
Ch2
Parallel part of specimen Ch3
Ch4
The temperature profile of specimen was measured from room temperature (RT) to 873 K by thermocouples (φ0.32 mm) welded in axial and circular direction. Fig. 2.4 (a) shows the temperature distribution along axial direction. There is a temperature uniform zone (about 10mm in length) in the parallel part of specimen. The temperature distribution along the circular direction in the uniform zone is shown in Fig. 2.4. (b), channel 1 (Ch1) was the controller of which the signal was feedbacked. There was little difference among the data of Ch1, Ch2, Ch3, and Ch4.
Based on the temperature profile on the specimen, two thermocouples were welded in the gage length on the specimen for temperature control during tensile and fatigue tests. One thermocouple was used for the control of the temperature and the other was to monitor the temperature. The temperature difference in the two thermocouples was kept less than 3 K, which was satisfied with the requirement of ASTM standard (the greater of 2 K and 1% of test temperature).
2.5 Test procedure Tensile test
The detail procedure of tensile test is shown in Fig 2.5-1. Tensile specimens were polished in the longitudinal direction with #1500 emery paper to erase the circumferential machining marks. Tensile tests were carried out in vacuum (≤5×10⁻³ Pa) from RT to 873K at strain rates of 0.1%/s and 0.02%/s. The axial displacement of the specimens was measured by a Shinko 1501-93-20 extensometer from 0 to 1 mm, and then changed to stroke control until broken. The test data were stored in the Yokogawa DL 708 (sampling rate is 20 /s). At the same time, the load and displacement curves were drawn by Yokogawa 3023 X-Y recorder. Those data will be applied to design base of JLF-1.
Fig. 2.5-1 Procedure of tensile test.
The fracture surface was observed with scanning electron microscopy (SEM). The φ 3mm thin foils for transmission electron microscopy (TEM) observation were prepared from
JLF-1 plate, and at 7 mm form the fracture surface of the tensile specimen to avoid the effect of necking. All thin foils were polished to less than 0.1 mm in thickness with #1500 emery paper, followed by electropolishing to perforation for TEM examination. So, the microstructure change during static loading would be applied to explain the mechanism of macro-phenomenon.
Low cycle fatigue test
S tra in (% )
Time (s)
0.1 %
0 1s
Fig. 2.5.2 Fully reversed push–pull triangular wave with an axial strain-control (0.1%/s).
Fatigue specimens were polished in the longitudinal direction with #1500 emery paper to erase the circumferential machining marks. LCF tests with total strain range of
εt
Δ =0.6%~2.4% were carried out in vacuum (≤5×10⁻³ Pa) at RT, 673 K, and 873 K. A fully reversed push–pull triangular wave was applied with strain rate of 0.1 %/s (Fig. 2.5.2). The detail procedure is shown in Fig 2.5-3.
Fig. 2.5-3 Procedure of LCF test.
The temperature difference of the two thermocouples was kept less than 3 K. The number of cycles to failure is defined as either the cycle when the peak tensile stress decreased by over 25% from an extrapolation curve of the peak tensile stress against number of cycles (Fig. 2.5-4), or test signal becomes unstable. All the test data were recorded by Yokogawa LR 4210 recorder. The load and displacement data were stored at every a certain cycle in the Yokogawa DL 708 (sampling rate is 20/s). At the same time, the load and displacement hysteresis curve was drawn by Yokogawa 3023 X-Y recorder. Those data will be applied to design base of JLF-1.
To investigate the microstructure change during fatigue at elevated temperature, tests were terminated for some specimens at 10th and 500th cycle with total strain range of
εt
Δ =1.8% at RT, 673 K and 873 K, and the thermal history simulating of LCF test of
εt
Δ =1.8% at 673 K and 873 K was carried out in annealing furnace in vacuum.
The φ3mm thin foils for transmission electron microscopy were prepared from JLF-1 plate, thermal history simulating specimen, and center part of the fatigue specimen. All the
![Fig 1.2.1-2 Fusion ignition temperature and output energy at different fusion action [7]](https://thumb-ap.123doks.com/thumbv2/123deta/6156116.103441/10.892.164.807.492.879/fusion-ignition-temperature-output-energy-different-fusion-action.webp)
![Fig. 1.3.1-1 Comparison of γ-dose rate for F82H, V-alloy and SiC/SiC composites [35]](https://thumb-ap.123doks.com/thumbv2/123deta/6156116.103441/17.892.164.653.493.868/fig-comparison-dose-rate-alloy-sic-sic-composites.webp)
![Fig. 1.4.2-3 Chang in free energy of γ and M phases with temperature [62].](https://thumb-ap.123doks.com/thumbv2/123deta/6156116.103441/24.892.265.653.406.848/fig-chang-free-energy-gh-m-phases-temperature.webp)
![Fig. 1.4.3.1-2 Dose dependence of YS and Et following irradiation at 673 K [52].](https://thumb-ap.123doks.com/thumbv2/123deta/6156116.103441/26.892.129.761.539.847/fig-dose-dependence-ys-et-following-irradiation-k.webp)
![Fig. 1.5.1-3. Manson-Coffin’s relationship of steel A 286 in vacuum and air [72].](https://thumb-ap.123doks.com/thumbv2/123deta/6156116.103441/34.892.261.660.110.453/fig-manson-coffin-s-relationship-steel-vacuum-air.webp)
![Fig. 1.5.3-1 Δ ε t ― N relationship of F82H at RT and elevated temperature f in vacuum [81]](https://thumb-ap.123doks.com/thumbv2/123deta/6156116.103441/36.892.143.759.344.817/fig-d-e-relationship-rt-elevated-temperature-vacuum.webp)

![Fig. 1.5.3-5 Shape and size effects on fatigue life of JLF-1 steel at RT in air [83, 84]](https://thumb-ap.123doks.com/thumbv2/123deta/6156116.103441/39.892.223.705.126.504/fig-shape-size-effects-fatigue-life-jlf-steel.webp)