Article
Quota Restrictions on Land Use for Decelerating
Urban Sprawl of Mega City: A Case Study of
Shanghai, China
Yunqian Zhang1, Zhenjie Chen1,2,*, Qianwen Cheng1, Chen Zhou1, Penghui Jiang1, Manchun Li1,2and Dong Chen1
1 Department of Geographic Information Science, Nanjing University, Nanjing 210023, China; [email protected] (Y.Z.); [email protected] (Q.C.);
[email protected] (C.Z.); [email protected] (P.J.); [email protected] (M.L.); [email protected] (D.C.)
2 Jiangsu Provincial Key Laboratory of Geographic Information Science and Technology, Nanjing University, Nanjing 210023, China
* Corresponding: [email protected]; Tel./Fax: +86-25-8968-1185
Academic Editor: Brian Deal
Received: 14 July 2016; Accepted: 20 September 2016; Published: 22 September 2016
Abstract:The mega cities of China are faced with great pressure from conflict between huge land demand for construction use and limited resources. To improve this situation, it is necessary to slow the increasing rate of built-up land and even reduce the existing built-up land by improving land use efficiency. Herein, land use planning with urban sprawl deceleration is proposed. Land quotas are important tools for the control of land use planning in China, but the current quotas are mainly in the form of increment, thus cannot support land use planning with urban sprawl deceleration. To address these issues, we developed a model named “current-plan-requirement response (CPRR)”, to optimize the land quotas. With this model, we investigated the current status of land use, the process of land use planning, and the requirements of land use planning with urban sprawl deceleration in Shanghai. It was found that the current land quotas have provided somewhat inhabited conversion of arable land to built-up land, but scarcely any regulation of land use efficiency or protection of natural environment. Then, the land quotas were optimized and quota management recommendations were made. The optimized land quotas included four aspects of quotas: arable land protection, ecological conservation, scale constraint on built-up land and economical and intensive land use. These new land quotas could be used to guide reduction of built-up land and increase ecological land in China’s mega cities. It might also be beneficial for easing conflict between supply and demand of built-up land, for building an eco-friendly city land-use structure.
Keywords:land use planning; land quota; CPRR; built-up land; Shanghai
1. Introduction
The world is undergoing rapid urbanization, and the level of global urbanization is expected to reach 70% in the next 40 years [1]. During this process, the built-up areas of mega cities in developing countries continuously sprawl [2–4]. China has been one of the world’s fastest growing economies in the last decade. Cities in China ensure their urban development by increasing the built-up land. Extensive expansion of urban areas has taken up large areas of arable land and ecological land. It has significant impacts upon the food security and ecological environment [5–9]. Therefore, contradictions between urban development and environmental protection have become increasingly serious, especially in China’s mega cities [10–12]. Meanwhile, the utilization efficiency of urban land has not improved; rather, it has actually declined [13,14]. Therefore, better management and control
of large-scale urban land use for intensive and sustainable development is very important in China’s mega cities.
In China, the land quotas have become important tool of land resource management. The land quotas used by China nowadays aim to protect arable land and constrain built-up land [15–17]. The land quotas are determined according to the trend of social and economic development, and are allocated from top to bottom. The central government determines the land quotas of each province, and each provincial government determines the land quotas of each city in its administrative area. When land use planning is made, land quotas for about 15 years are set for each administrative area. During the implementation of land use planning, the upper level of governments will issue the annual land quotas to the lower governments at the beginning of every year. This means that the amount of each land quota is divided into the amount for every year during the planning period [18,19]. By quantitatively studying the development targets of land use, and guiding the structure and distribution of land use with quotas, limited land resources can be allocated both temporally and spatially. The land resources in China are extremely limited and governmental administrative power is highly centralized, making allocative planning that focuses on mandatory quotas more suitable for the national conditions of China [20,21]. However, local governments want to strive for land quota to expand built-up areas and do not fully comply with regulations that control urban sprawl. In such cases, the effect of land use planning is lower than anticipated, and the sustainability of land use is threatened [22,23].
Given this situation, China’s mega cities, such as Shanghai, Shenzhen, and Beijing, have all proposed land use planning with urban sprawl deceleration. The cities attempt to lower the increasing rate of built-up land, and encourage the change of land use mode from continuous increase of built-up land to renewing the inefficient built-up land [24–26]. The indices and their values of current land quotas are determined at the time of making land use planning and are static during the planning period. It cannot adapt to the change of new situation. Thus, it is necessary to re-examine and rethink the effects of the current land quotas, and to seek a method to evaluate the status of planning implement and adjust land quotas if necessary.
In this study, the city of Shanghai was taken as a case. By comprehensively considering the current status of land use, the process of land use planning, and the requirements of land use planning with urban sprawl deceleration, a “current-plan-requirement response (CPRR)” model was developed. Using this model, the effectiveness of current land quotas for Shanghai was evaluated and their weakness summarized. Then, a new land quota system that is more suitable for land use planning with urban sprawl deceleration was proposed. From the perspective of protection (ecological resource) and control (built-up land scale), we designed four categories of land quotas with respect to arable land protection, ecological conservation, scale constraint on built-up land, and economical and intensive land use. The management of land quotas for land use planning with urban sprawl deceleration was explored to guide land use for mega cities.
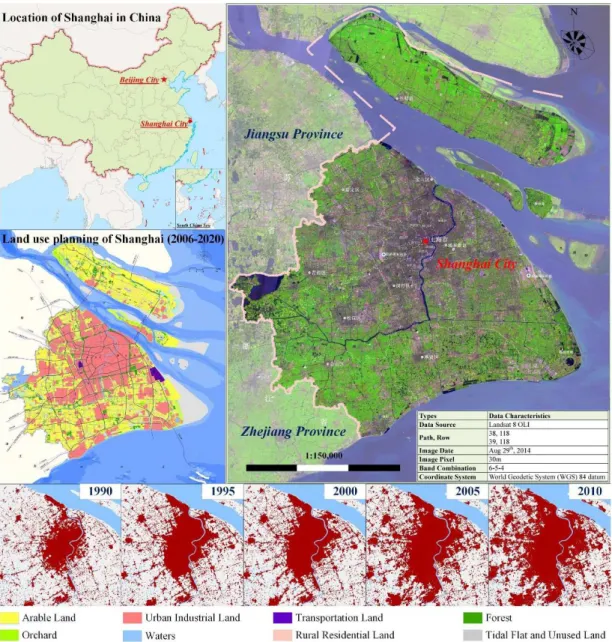
2. Study Area and Data Sources
2.1. Study Area
Shanghai is located at latitude 30◦40’ to 31◦53’N, and longitude 120◦52’ to 122◦12’E. It is bound
Figure 1.The study area.
Shanghai, as an international metropolis and economic center of China, is the top mega city in China. There is intense conflict between the demand for land to support rapid urbanization and the limited supply of land resources. Extensive and rapid economic development has initiated a series of consequences, and problems of land use are representative of those in China, and in other parts of the world [29,30]. According to the annual land use change survey data, there was 1880 km2of arable land in Shanghai in 2013, which was less than that planned by the State Council to Shanghai. The remaining land actually available for construction was only 153 km2, which is close to the upper limit of the total planned area of built-up land. From an ecological perspective, the forest coverage in Shanghai was only 13.13%, lower than the national average of 21.6% [31].
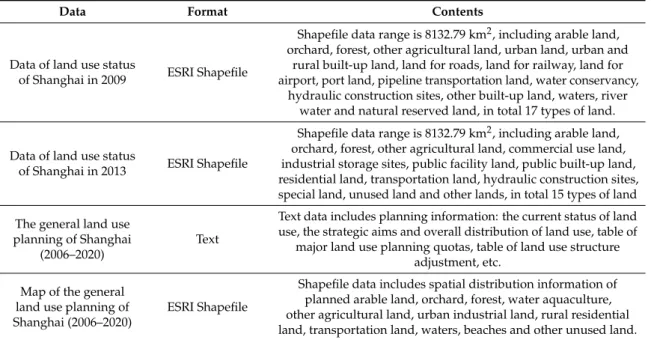
2.2. Data Sources
the current status of land use of Shanghai was considered and the land use data of different years were grouped into five categories: arable land, built-up land, forest and orchard, waters, and unused land.
Table 1.Basic description of data sources used in this study.
Data Format Contents
Data of land use status
of Shanghai in 2009 ESRI Shapefile
Shapefile data range is 8132.79 km2, including arable land, orchard, forest, other agricultural land, urban land, urban and
rural built-up land, land for roads, land for railway, land for airport, port land, pipeline transportation land, water conservancy,
hydraulic construction sites, other built-up land, waters, river water and natural reserved land, in total 17 types of land.
Data of land use status
of Shanghai in 2013 ESRI Shapefile
Shapefile data range is 8132.79 km2, including arable land, orchard, forest, other agricultural land, commercial use land, industrial storage sites, public facility land, public built-up land, residential land, transportation land, hydraulic construction sites, special land, unused land and other lands, in total 15 types of land
The general land use planning of Shanghai
(2006–2020)
Text
Text data includes planning information: the current status of land use, the strategic aims and overall distribution of land use, table of
major land use planning quotas, table of land use structure adjustment, etc.
Map of the general land use planning of Shanghai (2006–2020)
ESRI Shapefile
Shapefile data includes spatial distribution information of planned arable land, orchard, forest, water aquaculture, other agricultural land, urban industrial land, rural residential land, transportation land, waters, beaches and other unused land.
3. Methods
3.1. Basic Idea and Framework of the CPRR Model
Figure 2. Framework of the CPRR model.
=
… … … … …
… …
x
Figure 2.Framework of the CPRR model.
3.2. Analysis of Land Use Changes
Data about land use status in different years are compared to analyze changes of land use within the study period, and to provide supporting information for evaluating the utilization of land quotas. The transition matrix of land use reflects the dynamic process of various land use types in a certain area between the beginning and end of a certain period [33,34]. The general formula of a transition matrix of land use is:
Sij=
S11 S12 . . . S1n S21 S22 . . . S2n
. . . . Sn1 Sn2 . . . Snn
(1)
wherenis the number of land use types;iandjrepresent land use types before and after transition, respectively; andSijis the area of land usejtransited from land usei. Each line in the matrix represents
flow information during transition from land useito various types of land use. Each column in the matrix represents source information during transition from various types of land use to land usej.
3.3. Evaluation of Land Quota Use
The utilization of land quotas can be measured by comparing the actual scale of the land use type at the time of evaluation to the original land scale, and to the planned land scale [35]. Comparison of the actual scale of the land use type to the planned scale can intuitively reflect the completion status of a quota. The degree of completion of the quota is calculated by Equation (2). The comparison of the actual scale of the land use type to the original scale can enable us to better understand the use rate of the quota in detail; the formula is shown in Equation (3).
Pi= xi
Zi= xi ui
(3)
wherePiis the degree of completion of the quota at the time of evaluation;Zidenotes the use rate of
quota relative to the planned rate;xiis the actual scale of land use type at the time of evaluation;u1is the planned scale of this land type in the target year; anduiis the target scale at the time of evaluation.
IfZiis equal to one, it indicates that the rate of quota use is in line with expectations; if less than one,
it indicates a slower use rate than expected; and if greater than one, it indicates that the quota use is faster than expected.
The planned target at the time of evaluation is estimated by the total scale of land use during the planning period. Assuming that the time of evaluation is yeari, and that the planning period is from 2006 to 2020, the formula is shown in Equation (4).
ui =u0+ (u1−u0)×
i−2006
2020−2006+1 (4)
whereu0is the scale of this land use type in the base period.
4. Results and Discussion
4.1. Analysis of the Current Land Quota System in Shanghai
4.1.1. The Current Status of Land Use in Shanghai
According to the analysis of changes in arable land, built-up land, forest and orchard, waters, and unused land between 2009 and 2013 (Table2), and to the transition matrix between land use types (Table3), the features associated with land use changes between 2009 and 2013 in Shanghai can be summarized as follows.
(1) Constant Decrease in Arable Land
A notable feature of the land use change in Shanghai is a continuous decrease in the area of arable land. From 2009 to 2013, the area of arable land in Shanghai decreased from 1897.72 to 1861.84 km2. During this period, the loss of arable land was 126.70 km2. Of the area lost, 108.96 km2became built-up land, accounting for 86.00% of the total reduction of arable land. Additional loss of arable land was attributed to 1.08 km2, 15.81 km2, and 0.85 km2converted to forest and orchard, waters, and unused land, respectively. Meanwhile, 41.09 km2of forest and orchard, 19.33 km2of waters, and 0.26 km2of unused land were changed to arable land. Several factors contributed to the decrease in the area of arable land in Shanghai (e.g., structural adjustment of agriculture and ecological set-asides of arable land). The main factor was excessive use of arable land for construction.
(2) Rapid Sprawl of Built-up Land
In contrast to the decrease in the area of arable land, the other notable feature of the land use in Shanghai was the increase in the area of built-up land. The amount of built-up land in Shanghai increased from 2830.11 km2to 3054.66 km2between 2009 and 2013. During this period, there were interactive changes among built-up land, forest and orchard, waters, and unused land. The net areas converted from arable land, forest and orchard, waters, and unused land, to built-up land were 94.72, 60.81, 24.30, and 8.05 km2, respectively. The main source for the increase of built-up land was arable land; however, some forest and orchard, and waters became built-up land as well.
(3) Gradual Shrinkage of Ecological Land
waters became unused land. This is closely related to the invasion of rivers, lakes, and ponds due to land rehabilitation and development of new construction.
From 2009 to 2013, the overall trend in land use change in Shanghai was expansion of built-up land, and decrease of arable and ecological land. This also reflects the rapid development of urbanization in Shanghai. With the continuation of urban construction, land use in Shanghai faces the following dilemma: the demand for built-up land maintains high, and the conflict between land supply and demand remains acute. In response, the expansion of built-up land takes up arable land existing around cities and thus causes continuous decrease in the area of arable land. The protection of arable land is in a tough situation. Moreover, the expansion of urban areas takes up scarce ecological space and ecological protection is under great pressure. Therefore, there is an urgent need to implement land use planning with urban sprawl deceleration and to change the extensive land use model in order to improve land use efficiency, and to protect important ecological resources.
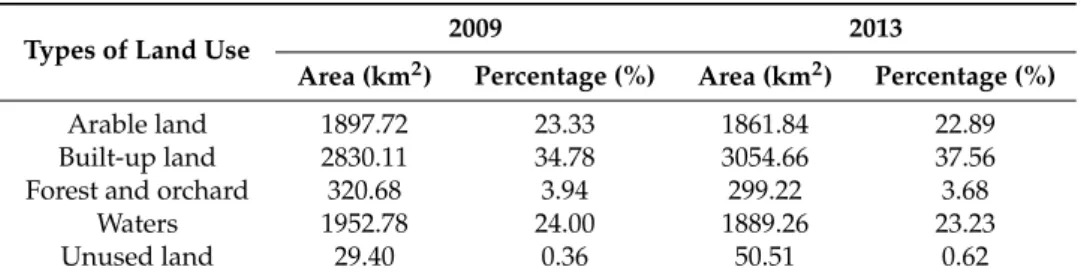
Table 2.Area and percentage of different land use of Shanghai in 2009 and 2013.
Types of Land Use 2009 2013
Area (km2) Percentage (%) Area (km2) Percentage (%)
Arable land 1897.72 23.33 1861.84 22.89
Built-up land 2830.11 34.78 3054.66 37.56
Forest and orchard 320.68 3.94 299.22 3.68
Waters 1952.78 24.00 1889.26 23.23
Unused land 29.40 0.36 50.51 0.62
Table 3.Transition matrix of land use of Shanghai in 2009 and 2013 *.
2009
2013 Arable
Land
Construction Land
Forest and
Orchard Waters
Unused Land
Arable land 1730.63 108.96 1.08 15.81 0.85
Built-up land 14.24 2786.14 2.42 10.17 0.46
Forest and orchard 41.09 63.23 178.62 17.88 0.07
Waters 19.33 34.47 1.57 1856.14 29.36
Unused land 0.26 8.51 0.01 0.21 20.16
* Note: The area unit is km2.
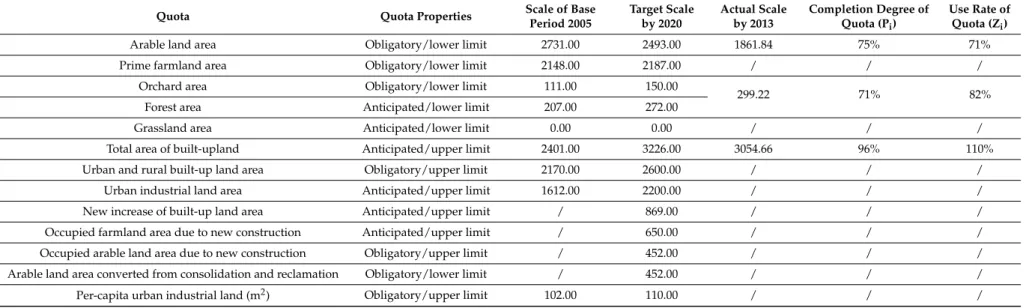
4.1.2. The Current Land Quotas of Shanghai
In total, thirteen land quotas were set in the general land use planning of Shanghai (from 2006 to 2020) (Table4) to adjust the structure of land use. The following two features can be seen from the current land quotas of Shanghai.
(1) Highlight particular protection of arable land
Table 4.Land quota system of Shanghai (2006–2020) and status by 2013 *.
Quota Quota Properties Scale of Base
Period 2005
Target Scale by 2020
Actual Scale by 2013
Completion Degree of Quota (Pi)
Use Rate of Quota (Zi)
Arable land area Obligatory/lower limit 2731.00 2493.00 1861.84 75% 71%
Prime farmland area Obligatory/lower limit 2148.00 2187.00 / / /
Orchard area Obligatory/lower limit 111.00 150.00
299.22 71% 82%
Forest area Anticipated/lower limit 207.00 272.00
Grassland area Anticipated/lower limit 0.00 0.00 / / /
Total area of built-upland Anticipated/upper limit 2401.00 3226.00 3054.66 96% 110%
Urban and rural built-up land area Obligatory/upper limit 2170.00 2600.00 / / /
Urban industrial land area Anticipated/upper limit 1612.00 2200.00 / / /
New increase of built-up land area Anticipated/upper limit / 869.00 / / /
Occupied farmland area due to new construction Anticipated/upper limit / 650.00 / / /
Occupied arable land area due to new construction Obligatory/upper limit / 452.00 / / /
Arable land area converted from consolidation and reclamation Obligatory/lower limit / 452.00 / / /
Per-capita urban industrial land (m2) Obligatory/upper limit 102.00 110.00 / / /
(2) Highlight the constraint on built-up land
Four quotas related to built-up land (i.e., total area of built-up land, urban and rural built-up land area, urban industrial land area, and new increase of built-up land area, highlighted with blue in Table4) set constraints from the perspective of total and incremental amounts of built-up land. They also put constraints on the scale of different kinds of built-up lands (i.e., urban, independent industrial and rural built-up lands).
In addition, the planning sets a few quotas related to ecological protection (forest area, orchard area, and grassland area) and land use efficiency (per-capita urban industrial land) [36].
4.1.3. Effect of the Current Land Quotas of Shanghai
Comparison of the change in land use of Shanghai and current planning targets show that, until 2013, the land quotas played a role in adjusting the land use structure to a certain degree. However, a few weaknesses were exposed as well.
Regarding arable land, although the current amount of arable land in 2013 was already lower than the target scale of protected arable land in 2020 and the quota for arable land area has been broken, the annual reduction in arable land has slowed. Studies have suggested that the current land quotas play a positive management role. According to the general land use planning of Shanghai (from 2006 to 2020), until 2020, the scale of protected arable land must be >2493 km2. This goal was drawn based on the arable land area of 2731 km2in the year 2005, when the plan was first made. The results of the second survey of land use change show that the actual scale of protected arable land is lower than the current target scale and even lower than the limit set for the end of the planning period. Therefore, the goal set for the area of protected arable land in 2020 is obviously unreasonable and breaking the quota is inevitable. During the implementation of planning, the area of arable land decreased 833.28 km2between 2006 and 2009, and decreased 35.88 km2between 2009 and 2013. The annual average rate of decrease in arable land is clearly slowing down. It can be seen that quotas like arable land area played a controlling role to at least some extent.
Regarding built-up land, the current land quotas limit the expansion of built-up land to a certain degree. The quota for the total area of built-up land has not been broken yet. However, the rate of increase in built-up land was much higher than expected. The current land quota requires that until 2020, the total area of built-up land in Shanghai should not exceed 3226 km2. By 2013 the total area of built-up land had reached 96% of the quota. The actual remaining space for built-up land for the whole city is only 153 km2, approaching the upper limit of built-up land. Compared with the quota intended for the time of evaluation, the built-up land scale has reached 110% of the quota. This is higher than expected. If this rate of increase continues, the scale of built-up land in 2020 will exceed the planned scale. Facing the reality of “limited quota, huge demand”, Shanghai must continue to control the total scale of built-up land and also improve the efficiency of use on built-up land. Shanghai must revisit the current stock of built-up land, which includes land that was been approved as built-up land, but not actually used, and low-efficiency built-up land for which the building density and capacity volume ratio are lower than industry standards. The land use style should be updated to meet the future needs of development in Shanghai [37–39].
4.2. Optimization of a Land Quota System for Land Use Planning with Urban Sprawl Deceleration
4.2.1. Requirements Analysis of Land Use Planning with Urban Sprawl Deceleration
Land use planning with urban sprawl deceleration is a land use planning designed to lower the increasing rate of built-up land, and is a concrete implementation of China’s new-type urban construction and ecological conservation. Facing the increasingly prevalent “urban disease” problem, the new-type urbanization needs improved land utilization to avoid continuous expansion of urban areas, and needs change in the urban land use patterns. The government needs to upgrade and reform industrial structures and improve the economic use of land, aiming to preserve some land resources and to use land intensively. In the meantime, it is necessary to reclaim industrial lands featuring industries with backward production capacity, serious pollution, security risks, and low profit level. On the other hand, in order to create a productive, healthful living environment, it is necessary to expand urban ecological space, increase the area of forest and wetland, and build reasonable green ecological corridors in the urbanized area while holding the red line for protection of arable land [40,41].
Therefore, three goals of land use planning with urban sprawl deceleration can be summarized: control the scale of built-up land, protect arable land, and increase ecological land. First, land use planning with urban sprawl deceleration requires control of the scale of built-up land and gradual reduction in the supply of built-up land. It also guides the outward expansion of built-up land towards exploring the potential of stock built-up land, and promotes the transition from extensive and inefficient to intensive and efficient [26]. Moreover, serious protection of arable land and prime farmland must continue. By improving the quality of arable land and prime farmland, the threat from built-up land expansion caused by economic and social development can be mitigated and food security can be guaranteed. In addition, ecological conservation must be promoted. Important ecological elements like forest, waters, and wetlands must be protected from occupation.
4.2.2. Optimal Design of a Land Quota System for Land Use Planning with Urban Sprawl Deceleration
In order to build a land quota system that suits China’s new-type urbanization construction, it is necessary to consider the effect of the current land quotas and the requirements of land use planning with urban sprawl deceleration. The performance and weakness of the current land quotas must be examined. Combining the requirements of land use planning with urban sprawl deceleration with respect to different land use problems, the retention, increase, or removal of quotas can be determined.
Comparing the current situation of land use planning with the requirements of land use planning with urban sprawl deceleration, there are four possible scenarios (Figure3). The first scenario is that quotas of the current land use planning have positive effects on the adjustment and control of the land use problem, and land use planning with urban sprawl deceleration also strives to solve this land use problem. In this case, the relevant quotas of the current land quota system must be kept. The second scenario is that the adjustment and control effect from the current land quotas for land use problem is too weak and perhaps not even positive. However, the requirement from land use planning with urban sprawl deceleration has great focus on the land use problem, so relevant quotas must be added. In the third scenario, the adjustment and control effect from the current land quotas for land use problem is too weak and not positive. This problem is not acute in land use planning with urban sprawl deceleration. Redundant quotas can be removed. In the fourth scenario, the adjustment and control effect from the current land quotas for land use problem is positive. This land use problem is not acute in land use planning with urban sprawl deceleration. Quotas of the current land quota system can be kept.
done to optimize land quota system with respect to arable land protection, ecological conservation, scale constraint on built-up land, and economical and intensive land use. In addition, in order to reflect the effect and degree of importance of different land quotas, quotas are classified as three types: controlling quotas, guiding quotas, and verifying quotas. Controlling quotas represent the highest willingness to adjust and control in land use planning. They are bottom line quotas, which must be accomplished, and are used to guarantee the execution of planning intentions. Guiding quotas are relatively flexible quotas to promote the accomplishment of planning targets. The mechanism of land use change is extremely complicated and involves progress in diverse economic social activities, so the value of guiding quotas cannot be accurately determined. Verifying quotas are difficult to be disaggregated, and are considered here to examine the implementation of planning (Figure4).
Figure 3. Schematic view of the optimization of land quota system.
Figure 3.Schematic view of the optimization of land quota system.
4.2.3. Land Quota System for Land Use Planning with Urban Sprawl Deceleration
According to the results from comparison of the control effect of the current land quotas in Shanghai, and the requirements of land use planning with urban sprawl deceleration, in this study the land quota system was optimized, and the optimal results are shown in Table5.
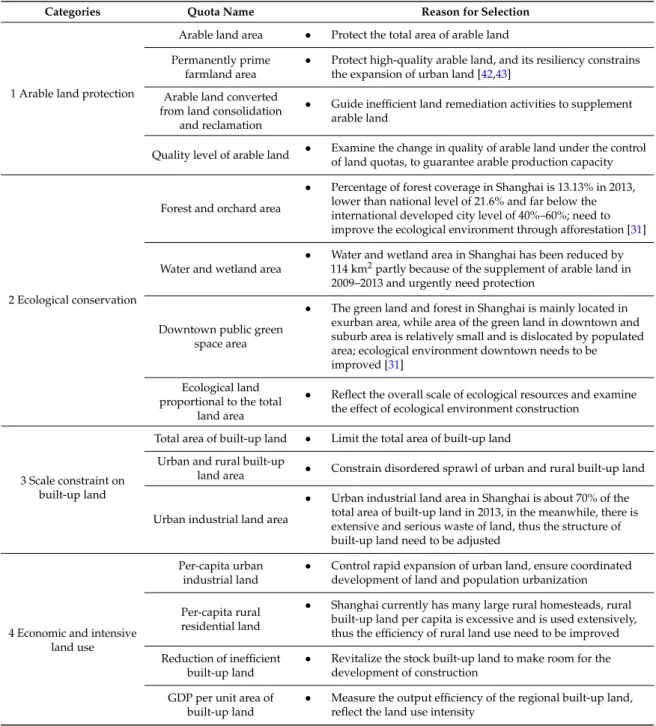
Table 5.Description of land quota system for land use planning with urban sprawl deceleration.
Categories Quota Name Reason for Selection
1 Arable land protection
Arable land area • Protect the total area of arable land
Permanently prime farmland area
• Protect high-quality arable land, and its resiliency constrains
the expansion of urban land [42,43]
Arable land converted from land consolidation
and reclamation
• Guide inefficient land remediation activities to supplement
arable land
Quality level of arable land • Examine the change in quality of arable land under the control of land quotas, to guarantee arable production capacity
2 Ecological conservation
Forest and orchard area
• Percentage of forest coverage in Shanghai is 13.13% in 2013, lower than national level of 21.6% and far below the international developed city level of 40%–60%; need to improve the ecological environment through afforestation [31]
Water and wetland area
• Water and wetland area in Shanghai has been reduced by
114 km2partly because of the supplement of arable land in
2009–2013 and urgently need protection
Downtown public green space area
• The green land and forest in Shanghai is mainly located in exurban area, while area of the green land in downtown and suburb area is relatively small and is dislocated by populated area; ecological environment downtown needs to be improved [31]
Ecological land proportional to the total
land area
• Reflect the overall scale of ecological resources and examine
the effect of ecological environment construction
3 Scale constraint on built-up land
Total area of built-up land • Limit the total area of built-up land
Urban and rural built-up
land area • Constrain disordered sprawl of urban and rural built-up land
Urban industrial land area
• Urban industrial land area in Shanghai is about 70% of the total area of built-up land in 2013, in the meanwhile, there is extensive and serious waste of land, thus the structure of built-up land need to be adjusted
4 Economic and intensive land use
Per-capita urban industrial land
• Control rapid expansion of urban land, ensure coordinated
development of land and population urbanization
Per-capita rural residential land
• Shanghai currently has many large rural homesteads, rural built-up land per capita is excessive and is used extensively, thus the efficiency of rural land use need to be improved
Reduction of inefficient built-up land
• Revitalize the stock built-up land to make room for the
development of construction
GDP per unit area of built-up land
• Measure the output efficiency of the regional built-up land, reflect the land use intensity
farmland should be set. The annual evaluation mechanisms for protection of arable land area should be established to ensure the target area of arable land, and to provide an orderly increase in high quality arable land. Meanwhile, the quota for arable land area converted from land consolidation and reclamation guides inefficient land management, development, and land reclamation activities, to supplement arable land. The quality level of the arable land quota is used for examining the change in arable land quality under the control of land quotas, to protect the production capacity of arable land. In addition, land use planning with urban sprawl deceleration also removes the original quota for occupied arable land area due to new construction, and occupied farmland area due to new construction. Because the core of land use planning with urban sprawl deceleration is reduction of built-up land, new increase of switching arable land or farmland to built-up land should no longer occur.
Regarding the ecological environment, the existing land quotas have weak effect on ecological land protection. Ecological land has been severely taken over by built-up land, while one of the primary objectives of land use planning with urban sprawl deceleration is to protect ecological resources from occupation by improving conservative, intensive land use. Therefore, from the vital elements of ecological resources, the original quotas for forest area and orchard area are merged into one quota for forest and orchard area. Quotas for water and wetland area, the downtown public green space area, and ecological land in proportion to the total land area are added. Quotas for forest area and orchard area in the current planning are too detailed, resulting in the problem of obscurity in definition. This study suggests that the merged forest and orchard area quota favors increasing ecological resources by constructing forest and orchard areas. In addition, the current planning takes the forest area quota and orchard area quota as an anticipated quota, which is not included in the planning implementation evaluation. The quota control is weak with high risk of break, thus it is considered a controlling quota in land use planning with urban sprawl deceleration (equivalent to an obligatory quota in the current planning) in order to emphasize the importance of the protection of forest and orchard resources. The downtown public green space area is used as a guiding quota, which helps enhance the downtown green area and increase the public perception of ecological area. The water and wetland area quota is used as a controlling quota, effectively protecting rivers, lakes, and ponds against arbitrary occupation and ensuring orderly development of coastal beaches. Land use planning with urban sprawl deceleration has also removed the original grassland area quota. There is no grassland in the structure of agricultural land in Shanghai, thus the value of this quota is always zero in the current plan, giving it no controlling effect.
Regarding the built-up land, the current land quotas show a positive effect on scale constraint on built-up land. Land use planning with urban sprawl deceleration requires strict control of built-up land scale as well. Thus, from the perspective of total scale and structure control, these quotas should be retained: the total area of built-up land, urban and rural built-up land area, and urban industrial land area. During implementation of land use planning with urban sprawl deceleration, the total area of the urban and rural built-up land; including urban, independent mining, and rural land, should be controlled; and inefficient use of land for construction should be curbed. The area of urban industrial land should be determined based on scientific estimates of population size and the urbanization level. At the same time, land use planning with urban sprawl deceleration no longer sets a quota for new increase of built-up land area, requiring urban development to repurpose built-up land from stock land.
land. Under the circumstance of insufficient reserve for built-up land, the excessive expansion of urban land has to be strictly controlled. On the premise that per-capita urban industrial land does not break the land quota, requisite land for urban development has to be provided. On the premise that per-capita rural residential land does not break the land quota, agricultural production and built-up land for farmer living space have to be guaranteed. Support is needed for rural roads, water conservancy, and other infrastructure construction as well as land for education, health, and civil affairs. In an orderly manner, one should promote moderate concentration of dispersed rural settlements, and scientific layout of rural residential communities. When using the reduction of inefficient built-up land quota, it should be linked to the policy of dynamic balance between urban and rural built-up land, to define the plan of inefficient built-up land consolidation and reclamation. These can enable us to disuse inefficient industrial land with high energy consumption and high pollution, gradually reducing the scale of built-up land, and leading people moving towards towns and cities, as well as industry to concentrate in industrial areas (Figure5).
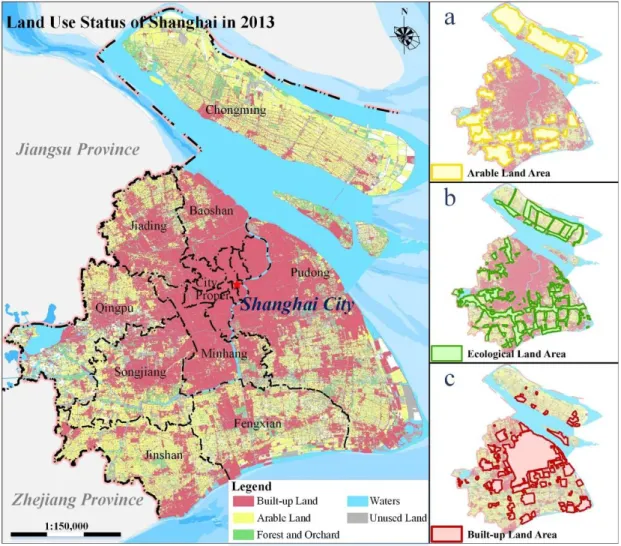
Figure 5. Schematic view of the spatial distribution of main land quotas: (a) spatial distribution of
Figure 5.Schematic view of the spatial distribution of main land quotas: (a) spatial distribution of arable land area quota; (b) spatial distribution of ecological land area quota; and (c) spatial distribution of built-up land area.
5. Conclusions
optimization suggestions for land quota system of land use planning with urban sprawl deceleration. This provided a useful exploration of sustainable land use in mega cities. The main conclusions are as follows.
(1) The current land quotas in China plays a certain role in protection of arable land and control of built-up land, but the land quotas focus on quantitative evaluation of arable land protection and scale constraint on built-up land. Quotas lack regulation of the stock build-up land, and of intensive utilization of land. They are also weak on the protection of ecological land.
(2) Land use planning with urban sprawl deceleration is intended to control the sprawl of built-up area and to ensure sustainable development. It leads to a new land use mode for coordinated development of the economy and environment. The land quotas for land use planning with urban sprawl deceleration should include four categories of quotas (arable land protection, ecological conservation, scale constraint on built-up land, and economical and intensive land use) to achieve reduction of built-up land and increment of ecological land by rearranging land use structure.
(3) The CPRR Model has the advantages of tracking land use problems and analyzing the process and requirements of land use planning timely, making it capable of adjusting the land quotas dynamically. The model was applied in the optimization of land quotas in Shanghai. Theoretically, it is also suitable for other mega cities that1 have similar land use problems and requirements of the land use planning.
Besides the land use planning, there are other plans such as urban master planning and environmental protection planning. All of these plans tend to fuse into one space planning, and categories of the quota system should include land use, social development, and environmental development. This study only focused on land use planning and the land quotas eventually implemented into the land use types. In the future, considering other spatial planning, the quota system should adjust and control industry, population, public services, infrastructure, ecology, and agricultural layout; ultimately improving the urban environment in mega cities.
Acknowledgments: This work was supported by the National Natural Science Foundation of China (No. 41571378), the Special Research Fund of China Land Surveying and Planning Institute (No. 2016-63-3), the Special Research Fund of the Ministry of Land and Resources for Non-Profit Sector (No. 201411014-03), and the Technological Innovation for Land Use Planning Compilation of Shanghai (2015(07-002CF)-07). Sincere thanks are given for the comments and contributions of the anonymous reviewers and members of the editorial team.
Author Contributions: All authors contributed to this work. In particular, Yunqian Zhang had the original idea for the study, and coauthors conceived and designed the experiments. Qianwen Cheng analyzed the data. Yunqian Zhang drafted the manuscript, which was revised by Zhenjie Chen, Chen Zhou, Penghui Jiang, Manchun Li and Dong Chen. All authors have read and approved the final manuscript.
Conflicts of Interest:The authors declare no conflict of interest.
References
1. The Ambassador Anwar Chaudhry: Green Economy and Inclusive Growth under the Global Change. Available online: http://www.gfhsforum.org/news/GD/2012/8/12891022434274.html (accessed on 15 March 2016).
2. Ding, C. Building height restrictions, land development and economic costs. Land Use Policy2013, 30, 485–495. [CrossRef]
3. Cohen, B. Urbanization in developing countries: Current trends, future projections, and key challenges for sustainability.Technol. Soc.2006,28, 63–80. [CrossRef]
4. McMichael, A.J. The urban environment and health in a world of increasing globalization: Issues for developing countries.Bull. World Health Organ.2000,78, 1117–1126. [PubMed]
5. Bai, X.; Chen, J.; Shi, P. Landscape urbanization and economic growth in china positive feedbacks and sustainability dilemmas.Environ. Sci. Technol.2011,46, 132–139. [CrossRef] [PubMed]
6. Deng, X.; Huang, J.; Rozelle, S.; Zhang, J.; Li, Z. Impact of urbanization on cultivated land changes in China.
7. Yeh, A.G.-O.; Li, X. Economic development and agricultural land loss in the Pearl River Delta, China.
Habitat Int.1999,23, 373–390.
8. Han, J.; Hayashi, Y.; Cao, X.; Imura, H. Evaluating land-use change in rapidly urbanizing China: Case study of Shanghai.J. Urban Plan. Dev.2009,135, 166–171. [CrossRef]
9. Wu, K.-Y.; Zhang, H. Land use dynamics, built-up land expansion patterns, and driving forces analysis of the fast-growing Hangzhou metropolitan area, Eastern China (1978–2008).Appl. Geogr.2012,34, 137–145. [CrossRef]
10. Deng, X.; Huang, J.; Rozelle, S.; Uchida, E. Growth, population and industrialization, and urban land expansion of China.J. Urban Econ.2008,63, 96–115. [CrossRef]
11. Güneralp, B.; Seto, K.C. Environmental impacts of urban growth from an integrated dynamic perspective: A case study of Shenzhen, South China.Glob. Environ. Chang.2008,18, 720–735. [CrossRef]
12. Skinner, M.W.; Kuhn, R.G.; Joseph, A.E. Agricultural land protection in China: A case study of local governance in Zhejiang province.Land Use Policy2001,18, 329–340. [CrossRef]
13. Qu, Y.; Sun, S.; Chen, Y. The expansion and strategy of controlling China’s urban construction land.Resour. Sci.
2014,36, 1–7.
14. Chen, Y.; Chen, Z.; Xu, G.; Tian, Z. Built-up land efficiency in urban China: Insights from the general land use plan (2006–2020).Habitat Int.2016,51, 31–38. [CrossRef]
15. Chien, S.-S. Local farmland loss and preservation in China—A perspective of quota territorialization.
Land Use Policy2015,49, 65–74. [CrossRef]
16. Li, Y.; Li, Y.; Westlund, H.; Liu, Y. Urban–rural transformation in relation to cultivated land conversion in China: Implications for optimizing land use and balanced regional development.Land Use Policy2015,47, 218–224. [CrossRef]
17. Ding, C. Land policy reform in China: Assessment and prospects. Land Use Policy2003, 20, 109–120. [CrossRef]
18. Wang, H.; Tao, R.; Wang, L.; Su, F. Farmland preservation and land development rights trading in Zhejiang, china.Habitat Int.2010,34, 454–463. [CrossRef]
19. Tan, R.; Beckmann, V.; van den Berg, L.; Qu, F. Governing farmland conversion: Comparing China with The Netherlands and Germany.Land Use Policy2009,26, 961–974. [CrossRef]
20. Tan, R.; Zhou, T. Decentralization in a centralized system: Project-based governance for land-related public goods provision in China.Land Use Policy2015,47, 262–272. [CrossRef]
21. Yunnan, H. Effects of urban land supply policy on real estate in China: An econometric analysis. J. Real Estate Lit.2008,16, 55–72.
22. Hsing, Y.-T. Land and territorial politics in urban China.China Q.2006,187, 575–591. [CrossRef]
23. Zhong, T.; Mitchell, B.; Huang, X. Success or failure: Evaluating the implementation of China’s national general land use plan (1997–2010).Habitat Int.2014,44, 93–101. [CrossRef]
24. Shi, W.; Zou, B.; Jin, Z.; Shi, X.; Ding, C.; Wang, K.; Zhao, Y.; Zhen, H.; Lin, J.; Shi, N. Master plan targeted at stock and decrement.City Plan. Rev.2014,38, 16–21.
25. Shanghai Deploys the Reducing Operation of Construction Land. Available online: http://www.shgtj.gov. cn/xxbs/shij/201506/t20150623_657117.html (accessed on 21 October 2015).
26. Notification about the Printing of the Yangtze River Delta Urban Agglomeration Development Plan. Available online: http://www.gov.cn/xinwen/2016-06/03/content_5079264.htm (accessed on 10 June 2016). 27. Zhang, H.; Zhou, L.G.; Chen, M.N.; Ma, W.C. Land use dynamics of the fast-growing Shanghai metropolis, China (1979–2008) and its implications for land use and urban planning policy.Sensors2011,11, 1794–1809. [CrossRef] [PubMed]
28. National Bureau of Statistics of China. Shanghai Statistical Yearbook, 2014; China Statistics Press: Beijing, China, 2015. (In Chinese)
29. Yin, J.; Yin, Z.; Zhong, H.; Xu, S.; Hu, X.; Wang, J.; Wu, J. Monitoring urban expansion and land use/land cover changes of Shanghai metropolitan area during the transitional economy (1979–2009) in China.
Environ. Monit. Assess.2011,177, 609–621. [CrossRef] [PubMed]
30. Wang, J.; Chen, Y.; Shao, X.; Zhang, Y.; Cao, Y. Land-use changes and policy dimension driving forces in China: Present, trend and future.Land Use Policy2012,29, 737–749. [CrossRef]
32. Liu, J.; Zhang, Z.; Xu, X.; Kuang, W.; Zhou, W.; Zhang, S.; Li, R.; Yan, C.; Yu, D.; Wu, S.; et al. Spatial patterns and driving forces of land use change in China in the early 21st century.Acta Geogr. Sin.2009,64, 1411–1420. [CrossRef]
33. Bell, E.J. Markov analysis of land use change—An application of stochastic processes to remotely sensed data.Socio Econ. Plan. Sci.1974,8, 311–316. [CrossRef]
34. Turner, M.G. Spatial simulation of landscape changes in Georgia: A comparison of 3 transition models.
Landsc. Ecol.1987,1, 29–36. [CrossRef]
35. Hong, W.; Liu, Y.; Li, M.; Liu, M.; Tong, L. Implementation evaluation methods of overall land use planning.
Sci. Technol. Manag. Land Resour.2013,30, 68–73.
36. Shanghai Planning and Land Resource Administration Bureau. Shanghai General Land Use Planning (2006–2020). Available online: http://www.shgtj.gov.cn/tdgl/200812/t20081223_152679.html (accessed on 6 April 2016).
37. Shanghai Limits the Total Scale of Construction Land for Development. Available online: http://www.gtzyb. com/yaowen/20140322_60529.shtml (accessed on 2 July 2015).
38. Shanghai Promotes the Reducing Operation of construction Land to Break the Tight Constraints on Land Resources. Available online: http://www.ce.cn/cysc/fdc/fc/201512/14/t20151214_7524294.shtml (accessed on 4 May 2016).
39. Outline of Shanghai Master Plan (2015–2040). Available online: http://2040.shgtj.net/web/ (accessed on 12 April 2016).
40. State Council. Opinions about Accelerate the Construction of Ecological Civilization. Available online: http://www.scio.gov.cn/xwfbh/xwbfbh/yg/2/Document/1436286/1436286.htm (accessed on 6 April 2016).
41. State Council. National New-Type Urbanization Plan (2014–2020). Available online: http://www.gov.cn/ zhengce/2014-03/16/content_2640075.htm (accessed on 6 April 2016).
42. Cheng, L.; Xia, N.; Jiang, P.; Zhong, L.; Pian, Y.; Duan, Y.; Huang, Q.; Li, M. Analysis of farmland fragmentation in China modernization demonstration zone since “reform and openness”: A case study of south Jiangsu Province.Sci. Rep.2015,5, 11797. [CrossRef] [PubMed]
43. The Surrounding Permanent Basic Farmland of 89 Cities Been Delimited Implies the Ending of the Extensive Type of Construction Land. Available online: http://www.ce.cn/xwzx/gnsz/gdxw/201605/24/t20160524_ 11918683.shtml (accessed on 30 May 2016).