トップページ - 横浜国立大学学術情報リポジトリ
13
0
0
全文
(2) S. USAMI and Z. FUNAToGAWA. 10 (b). Polishing. In order to polish the specimens spherically a device developed by Bond`}. was used. The grinder is shown in Fig. 1. emery paper --------. ------->. aer. -----"-m. --. --. ."" :==--====. e. '. -o. -. -. nemte(o.S'/'op'9)flanse. Fig. 1. Grinder.. An emery paper was affixed to the inner wall of the circular hole, in which specimens were blown with the compressed air through a nozzle. After grinding, the specimen was etched for a few minutes in the hot HCI solution of about 9 normal to remove the distorted layer of the surface.. (c) Determination of the crystal orientation , The orientation of a specimen can be determined accurately by the X-ray diffraction method. In order to rotate the crystal about a [110]-axis, the spots. of the reflection from the (400), (440), (444) planes in the Debye-Scherrer photograph were pursued carefully. Its accuracy is within ±O.50. Then the specimen was mounted on the rod in the cavity without changing the orientation, and fixed with the special dental cement. It was coated with a thin film of polystyrene or silicon resin.. g3. Experimental Apparatus. (a) Microwave comPonents ・ The block diagram of the whole apparatus is shown in Fig. 2. The cavity of transmission type (TEio4 mode) was used. (Fig. 3.). When the absorption line is strong the detection is possible by a simple video type; that is, by observing the decrease of Q-curve with the oscilloscope.. But the absorption intensity of a specimen which contains ferrous ions becomes so weak that a high sensitive detector is necessary.. The magnetic field was modulated by the town 50cls and the phasesensitive detector similar to Schuster type5) was constructed. (Fig. 4.). As the field modulation was applied, the microwave frequency had to be.
(3) Ferromagnetic Resonance in NixFe3-m04 11 stabilized. The A.F.C. network shown in Fig. 5. was used here. The microwave was frequency-modulated with 455 Kcls crystal oscillator and the trans-. mitted power through the cavity was amplified with the tuned amplifier. A. F. C. '. i<<ystren Attenuater Pcio'zeeieeltt Ateenuater Deteet.or. P;xTpeprty F".eigft"e"#Y c:,.,t} Aaze.Up`)O{fi,. ps.D. vnA. A・C・ llAase. 1 So9'2; sh`fter A'etd modeclator Fig. 2. Ferromagnetic resonance spectrometer.. >c. tnPthtezetpUt. K. SeK p!"nt. SOK IOOOt, SoK. mA. -- teftrence. 6SN7 tM. 3oK 3ok +s. '. ' s7,ee{mere .29SJ.7 ----spee. 'H '1-=: teoK ' -.tnput '. 50oK 2S" IKto f` thermeceapte. Fig・3・Cavityoftrans. CF--mission type. Fig. 4. Phase-sensitive'detector. The amplified signal was discriminated and fed back to the repellor of the klystron (2K25) through the d.c. amplifier. The fluctuation from the centrefrequency was about ±100 Kc!s.. The heterodyne'frequency-meter is shown in Fjg. 6. This is convenient.
(4) 12. S. USAMI and Z. FUNATQGAWA. to observe the change of the resonance frequency of the cavity when the temperature is varied.. Fig. 10 shows such a measurement.. '. 4Ss kva osciUator. ,J ,. Kfystron. .. cavity. .-. Crystat. l,・. 455k9,ls. detecter. Dtscrt,,. a,nP.. n c,. amP・. G '. Fig. 5. A.F.C. network.. '. lFt-4,rtt. Mixer A・E. 4Mc!s ' erystae. ' 7L = nE ±f (n s23fi 2g). zerebeet L=47,z (wttgS-tot). v. (gAKs) a,np・. oSetttdtor. u.H.F;n. -F,ery{tatta-'."Et Reeeiver (IIII). mcxer. oscittator. f. "4. /. Klystron --,.dt.ity . DirectionaL tbzepter. Fig 6. Heterodyne frequency-meter.. sv 27. 3K. 2T looOP. 6J6 f:"eitze・,vcr 4atoge. 34eL 4e4 M(l!I". "T. ST' leop. 10 K or,R). r. Fig. 7. U.H-F. oscillator.. +B.
(5) Ferromagnetic Resonance. in・NixFe3-x04 13 '. '. '. tv2SA. '. '. eiii-.. tl,. 2seK aJ ptunger. .. T----- sooK. tooP. microurave r, 1. ny ------. rMiea. ' +B. l --. ."nc)s. i"PLOt leoK '. -. l eeaxiatedble j. t. - th`bbGLJ Irop (UH.E th,,papt). tt.H:E. Fig. 8.. a.o1F. Fig. 9. Mixer (6AK5).. Crystal mixer.. Msck.. g2gS tr 2eo ・ v ?. : o. lillim'. eas5. lco tse ?co 2co 3ee - T"K Fig. 10. Resonance frequency of the cavity vs. temperature.. (b) Measurement of the magnetic field. It is important to measure the magnetic field accurately. We used the fluxmeter with a search coil which was calibrated carefully, and also the field-. meter of the proton resonance. The electron spin resonance of D.P.P.H.6) was. observed frequently asamarker. . For the field-meter of the proton resonance, the same eircuit as Knoebel and Hahn's7) was made. The flexible probe was convenient for our exp6riment and their frequency m' odulation method was not necessary in our case, where the magnetic field modulation was applied. The modulation amplitude of magnetic field was varied from ±5 to ±30 oersteds according to the absorption line width.. ' g4. Analysis. '. '. '. '. '. tt. The resonance condition which has been derived .by Kitte18) is. ' to == rllbff, - (1). ' ' where to is the frequency in radianlsec, r is the gyro-magnetic ratio (ge12mc),.
(6) 14 S. USAMI and Z. FUNATOGAWA g is the .spectroscopic splitting factor, and. H6ff =Hle+fi(e)K,!M+fi(e)K,!M, (2) where 0 is the angle of rotation in a crystal plane.9) If we let 0 be the angle in the (Oll) plane between Hla and the [100] direction, the following formulas are obtained,. ,fi(,Z),:g,fi55,12,)ptg2,Z.iwai?,i,n,2,i.;9),}. } (3). Table. I. .fl(e) and h(e) in [100], [110] and [111] crystal axis. [100]. [111]. [11O]. 54044,. 9oe. -112 114. e. Oo. A (e). 2. - 4/3. fi (e). o. - 419. From Equations (2) and (3), EL,ff, Ki!M) and K21M were determined with the measured values of the external applied field Hle as a function of 0. Their. temperature dependence was obtained from the data measured in the [100], [110] and[111] directions.* Also g-values at each temperature is given from Equation (1), or from the simplified formula:'. g==. f(Mcls). L()ff(oersteds) × 1.400. , (4). where f is microwave frequency itself.. g5. Results The variations of the applied field required for resonance with crystal direction in the (Oll) plane are shown in Figs, 11, 12, 13 and 14 for four speci-. mens respectively. The ・temperature dependence of KilM) K21M, and g-value for each compositions is shown in Figs. 15, 16 and 17.. Two experiments on the single crystal of the Fe-Ni ferrite system have been reported by other investigators: D. W. Healyii), and W. A. Yager et ali2).. One of the two crystals which were studied by Yager et al is n'early equal in. composition to our Nio.7sFe2.2s04. But as to the temperature dependence of KilMl their results differ substantially from ours, on the other hand Healy's * .lii(e) takes zero at three values of e; one is, of course, e=O and the other are real solutions of the next equation:. 1-6sin2e+(21/4)sin4e==O. Solutions are given with e=26044t and 75050t, so the data in these angles seem to simplify the calculation. But according to Artman's considerationiO), in the neighbourhood of such angles the non-line up effect of the magnetization varies the resonance field considerably. So measurements in these directions are not necessarily available..
(7) Ferromagnetic Resonance in NixFe3-x04. 15. t3oo. M ,.,, h 2.2s O,. (oe). t200. (o・49'7a,"). A: 77eK O:29o"K. n$. xt .loO g. A. g1-t8e. --2e. le. 10. no. 50. - eo 90. 60. 8e. 7. -2oo. -3oo. -ooo. Fig. 11.. (Hres-Hhal vs. angle between M and. [100] direc-. tion in (Oll) plane for Nio.7sFe2.2s04・ Ni oeiPe 2.4e 04 .3oo (Oe). (O 47 %t). A: 7e"K O: 2goeK. Ai +2oo ¢. : :. l. o. V +too. io. 20. fo. 30. .ilO. -e.. 50 60 Oo. 90. 8o. -too. -200. Fig. 12. (H}es-Heff) vs. angle between M and [100] direction in (Oll) plane for Nio.s2Fe2.4s04・. Nio.3sk2.ssq (o・44ncg). +eoo (odi. A: 70eK .2eo. Q:?9ok. Av r. g, { .too. 20. to. 1 .・oe. 30. co. "50 60 e'7o. A eo. 90. A -2eo li-. -go. Fig. 13. (Hres-Hbff) vs. angle between tion in (Oll) plane for Nio.3sFe2.6s04・. M and. [100] direc-.
(8) I. l i. i. S. USAMI and Z. FUNATOGAWA. 16. ' .sco. Ni,,2. fe 2,so O. (o・so ,%, P>. L. (oe). I. O:29oOK. .?oo. A. ..-li,. -". ty.too. t. bA. t'. e. :. A:770K. -'--'-" et. So. 30 40 5o 6o ?o・ SO. lo 2. go. 1 'too. -2oo -3co. Fig. 14. (Hres-Hbff) vs. angle between M and ]100] direction in (Oll) plane for Nio 2oFe2 so04・. (Pe)l. 'i' M.,,lthBoq`X. , K:ii・i. '. +/oo ,. ,s, N`o3sfe2ssq2>>[IN<lt. ' Ni,.s?li?,.,?o4'f!=)tL. a. 2o 1-e. dOO. )×, -----TX -so. tVL',.7sh2.2sCL[. UNA A. -leo. '. e. '.g. -lse. '. Fig. 15. Roe. (oe). KilM vs. temperature.. }. ----.Tn K .t..e-Ld"-'O. Kz!;.t o N;o2oEexgeQof'td""'lill]'-,. -200. 2DO ts. NCe.asFe2,ssO"" Nto・s2 Re 2,"eoA lj. -400 Nc o,os Fe 2,?s Opt -.-.-.. -6oO diBoo. Fig. 16. K3i!M vs. temperature.. K. 8oo-.
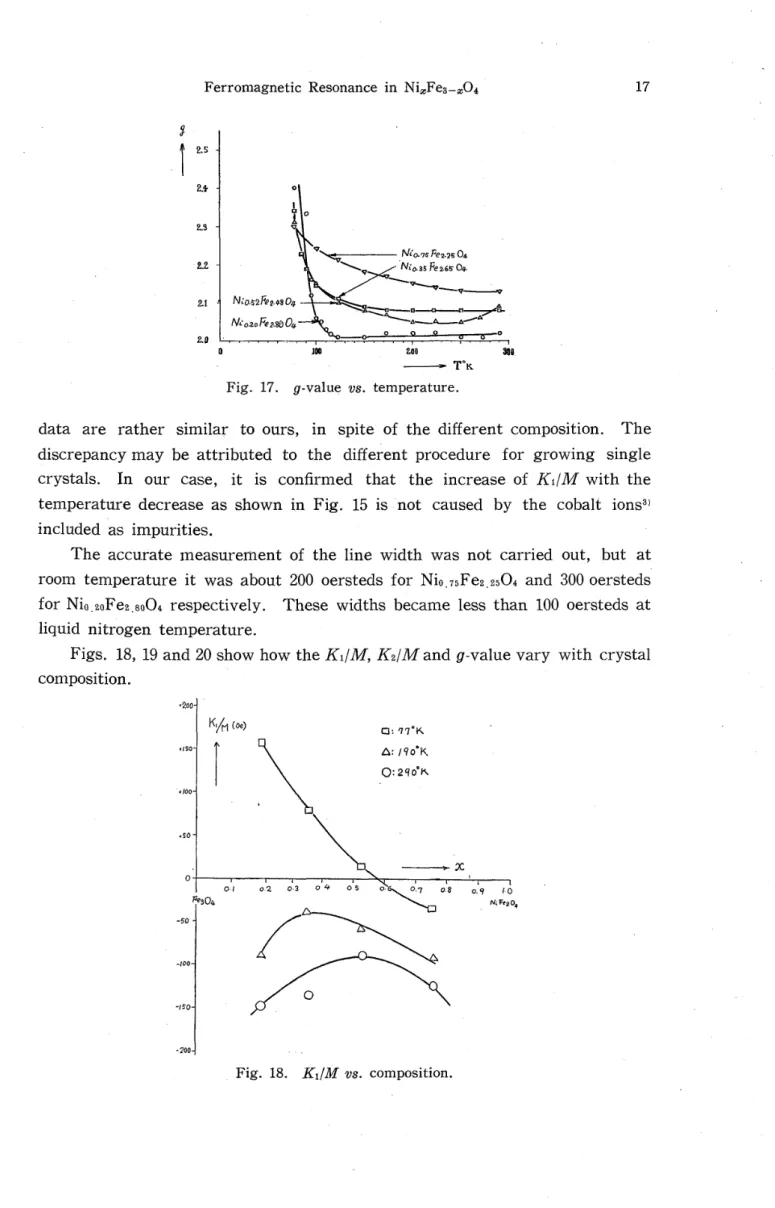
(9) Ferromagnetic Resonance in NimFe3-x04 17 g 1 2・s. 2.l o ±o. 2.S v. VNkf------ .M'a7slZe2.2604. l'1 Mg,S2:i;,8&'tVtwn.nN-..--,."-)A.. o 1oo Lte ,r.K eeg Fig. 17. g-value vs. temperature.. data are rather similar to ours, in spite of the different composition. The discrepancy may be attributed to the different procedure for growing single. crystals. In our case, it is confirmed that the increase of KilM with the temperature decrease as shown in Fig. 15 is not caused by the cobalt ions3) included as impurities.. The accurate measurement of the line width was not carried out, but at room temperature it was about 200 oersteds for Nio.7sFe2.2s04 and 300 oersteds for Nio.2eFe2.so04 respectively. These widths became less than 100 oersteds at liquid nitrogen temperature.. Figs. 18, 19 and 20 show how the KilM, K21M and g-value vary with crystal composltlon. -2eo. K/A (oe) a:a7oK ・tso i 81. !ZO,I K.. ',loo. `. .so. o' ----,- X,. o・t. lqe3o4 -50,. -too. -tso. o.2 o・3 e4 os. /. OK os. o. -200. Fig. 18. KilM vs. composltlon.. o,9 t・O NiFe204.
(10) 18. S. USAMI and Z.. FuNAToGAwA. -so. a '. t. Ks:ilt (bof. ' l. ,tt. 't. 'eoo. 1t. 1/. 1t 1. /. -"oe. o//. /. l. /o -. / -"t tt x/. -200. /-. ag..=-.r :- :'o2g ----.. o. A. d.-D. o・2 o・3Ao.4 o・s oJ6 O・7 o・8 O・9. o・1. Pe304. - ec. o. 1・o NtFeiO". .2oO. Fig. 19.. K2/M vs. composition. A 700K o ?qooK. ,. 2.4. 2. 1 2,. 22 tr 2,1. o. o. 2o. O a't a2 a3 o・4 O・S od6 o.7 o・g o・9. keO.. to M・ k,04. s x.. Fig. 20. g-value vs. composition.. o"-. g o・4. sas. O'awtA,ors @Healy+JoAns`o'2). t o・3. 5. ge. ". S e,2 ws. 1 ai. o o.l o.2 o・3 o・4 O・5 o・6 a7 o・8 ag "o. .fo3et. Fig. 21.. spc NeEhQ4p. g(77eK)-g(290eK) vs. composition..
(11) t. Ferromagnetic Resonance in NimFe3-x04 ,19 g6. Discussions. ' The static measurement by means of the torque-meter gives the similar tendency asourresonancedata. Bothresults at room temperature and at liquid oxygen temperature are tabulated in Table II. The saturation magnetization. Mwas measured by Miyata and Nakamura in our laboratory for the same specimens. Fig. 22 shows the curve of dKi vs. composition, where aKi is the Table II. Magnetic anisotropy constant Ki, Kli in ergfcc, and anisotropy field. KUM, K21M in oersteds, ag dependent on frequency and temperature. x. O.20. temp.. K,IM. 900K. +136. (290eK) (-147) O.35. 900K. +75. (290eK) (-134). goeK O.52. +15. (2900K) (-94). goeK O.75. -34. (2900K) (-120). M. Ki(res.) Ki(static). +12.3. dK,. KhlM. -6.0. -100. -5 (- 4). 460. +6.3. (440). (-6.5). (- 6.7). (+O.2). (-100). 410. +3.1. +7.9. -4.8. - 240. (378). (-5.1). (-3.3). (-1.8). (+1OO). 370. +O.56. +4.4. -3.8. - 270. (338). (-3.2). (-3.2). 325. -1.1. +O.5. -1.6. -705. (298). (-3.6). (-3.8). (+O.2). (-120). K,,AK,. (-103). (o). K2(res.) Kh(static). -10. -10. - 23 (- 4). -to. O:Kt(4esonance). a:Ki( stat`c) o9oe-.-pt-.. A;AKc .5. AK,(at29oeK)!xA. 9・3o.4o,s. 29oOK. AN. Nil.:・fg[[.-]);;:;・-・. ・-. q. .:r""`. i.-'. 5. a6 o.. z'. a8. .x o. o.9' t.. """-'"'::1}. N`roAK. AKt(of 9ok). FS. Ki(res), Ki(static) and AKi vs. composltlon at temperature and at Iiquid oxygen temperature. room. Fig. 22.. - 12. (- 3). o. e・to・2. -10. (+ 4). `ngkc>. o. -9. - 19.
(12) 20 S. USAMI and Z. FUNATOGAWA difference of the crystalline anisotropy between these two data:. AKi==Ki(resonance)-Ki(static). Bozorth et al'`) pointed out that in a Ni-Fe ferrite (Nio.76Fe2.i604) the frequency dependence of the ferromagnetic crystalline anisotropy was observed.. In our case, also, the same character has been observed in all compositions as seen in Table II or in Fig. 22.. - 'r OK. -l o. too 2oo A 30V.. (leengdi -i. d2 '. -'3 Nio.s2Fb?gD04 AA"' A K,. 1 -" -s T6. -7 Nio,2ok?.go04. -8. o. Fig. 23. AKi vs. temperature for Nio,2oFe2,so04 and Nig.s2Fe2,4s04・. Bozorth et al regarded that this phenomenon was due to the relaxation associated with the rearrangement of electrons between ferrous and ferric ions minimizing the free energy of the crystal.. From the above point of view, Clogston,'6) also, tried to explain the temperature dependence of the line width, the ferromagnetic anisotropy and g-value in Nio.7sFe2.2s04, which were reported by Yager et ali2), on the basis of thermo-. dynamics. The temperature dependence of g-value in ourstudy, too, may be accounted for by the thermodynamic theory. As for tne anisotropy, AKi must be adopted rather than Ki(resonance) itself, since Ki(static) is not independent of the. temperature. The temperature dependence of AKi shows the same direction which the theory has expected. It is noticeable that at liquid oxygen temperature AKi approxiMately depends linearly upon the composition (x) and may be extrapolated to zero at the point of x=1.0. The Fe-Mn ferrite system which was investigated in, our laboratoryi)・3)・i5}. did not show such a frequency dependence as seen in the Fe-Ni ferrite system. At present the satisfactory explanation is not given for this difference.. Acknowledgement The authors wish to express their gratitude tb Dr. Miyata for specimens,. static data and many useful discussions. They were helped also by many other people in our laboratory. This work was partly supported by the Scientific. Research Expenditure・of the Ministry of Education..
(13) t. Ferromagnetic Resonance in NixFe3-x04 21 References. 4). Z. J. N. W.. 5). N. A. SCHUSTER: Rev. Sci. Instr. 22 (1951) 254.. 6). A. N. HOLDEN, W. A. YAGER, and F. R. MERRITT: J. Chem. Phys. 19 (1951) 1319.. 1) 2) 3). FUNATOGAwA, N. MIYATA, and S. USAMI: J. Phys. Soc. JaPan 14 (1959) 1583. C. SLONCzEWSKI: J. Appl. Phys. 32 (1961) 253S. MIYATA: J. Phys. Soc. Japan 16 (1961) 1291. L. BoND: Rev. Sci. Instr. 22 (1951) 344.. 7). H.W.KNOEBEL,andE.L.HAHN:Rev.Sci.Instr.22(1951)904. '. 8). C. KITTEL: Phys. Rev. 73 (1948) 155.. 9). 10). 11) 12) 13). 14). J. R. BIcKFoRD: Phys. Rev. 78 (1950) 449. .. J. D. W. D.. O. W. A. W.. ARTMAN: HEALy: YAGER, HEALy,. Proc. Inst. Radio Eng. 44 (1956) 1284; Phys. Rev. 105 (1957) 62. Phys. Rev. 86 (1952) 1009. J. K. GALT, and F. R, MERRITT: Phys. Rev. 99 (1955) 1203. and R. A. JoHNsoN: Phys. Rev. 104 (1957) 634.. R. M. BozoRTH, B. B. CEmN, J. K. GALT, F. R. MERRm, and W. A. YAGER: Phys. Rev. 99 (1955) 1898.. 15). 16). 1. R. F. PENoyER, and M. W. SHAFER: J. Appl. Phys. 30 (1959) 315S. A. M. CLoGsToN: Bell Syst. Tech. J. 34 (1955) 739..
(14)
図
関連したドキュメント
An easy-to-use procedure is presented for improving the ε-constraint method for computing the efficient frontier of the portfolio selection problem endowed with additional cardinality
(Construction of the strand of in- variants through enlargements (modifications ) of an idealistic filtration, and without using restriction to a hypersurface of maximal contact.) At
It is suggested by our method that most of the quadratic algebras for all St¨ ackel equivalence classes of 3D second order quantum superintegrable systems on conformally flat
In this paper, we study the generalized Keldys- Fichera boundary value problem which is a kind of new boundary conditions for a class of higher-order equations with
In Section 3, we show that the clique- width is unbounded in any superfactorial class of graphs, and in Section 4, we prove that the clique-width is bounded in any hereditary
Keywords: continuous time random walk, Brownian motion, collision time, skew Young tableaux, tandem queue.. AMS 2000 Subject Classification: Primary:
This paper develops a recursion formula for the conditional moments of the area under the absolute value of Brownian bridge given the local time at 0.. The method of power series
The main problem upon which most of the geometric topology is based is that of classifying and comparing the various supplementary structures that can be imposed on a
