Rules of Origin and Local Content in East Asia
著者
Kuroiwa Ikuo
権利
Copyrights 日本貿易振興機構(ジェトロ)アジア
経済研究所 / Institute of Developing
Economies, Japan External Trade Organization
(IDE-JETRO) http://www.ide.go.jp
journal or
publication title
IDE Discussion Paper
volume
78
year
2006-11-01
INSTITUTE OF DEVELOPING ECONOMIES
Discussion Papers are preliminary materials circulated
to stimulate discussions and critical comments
DISCUSSION PAPER No. 78
Rules of Origin and Local Content
in East Asia
Ikuo KUROIWA*
November 2006
Abstract
Rules of Origin (RoO) are an integral part of all trade rules. In order to be eligible for
Common Effective Preferential Tariffs (CEPT) under AFTA and similar
arrangements under the ASEAN-China FTA, a product must satisfy the conditions
relative to local content. The paper tries to calculate local content as well as
cumulative local content in East Asian economies, with use of the Asian International
Input-Output Tables; it also investigates factors of change in local content by
applying decomposition analysis. The paper finds that the cumulation rule increased
local content of the electronics industry more significantly than local content of the
automotive industry, and the contribution of the cumulation rule increased in the
period 1990-2000, due to rising dependency on neighboring ASEAN countries and
China.
Keywords: rules of origin, local content, international input-output tables
JEL classification: C67, F15, L60
The Institute of Developing Economies (IDE) is a semigovernmental,
nonpartisan, nonprofit research institute, founded in 1958. The Institute
merged with the Japan External Trade Organization (JETRO) on July 1, 1998.
The Institute conducts basic and comprehensive studies on economic and
related affairs in all developing countries and regions, including Asia, the
Middle East, Africa, Latin America, Oceania, and Eastern Europe.
The views expressed in this publication are those of the author(s). Publication does not imply endorsement by the Institute of Developing Economies of any of the views expressed within.
INSTITUTE OF DEVELOPING ECONOMIES (IDE), JETRO
3-2-2, WAKABA,MIHAMA-KU,CHIBA-SHI
CHIBA 261-8545, JAPAN
Introduction
Rules of Origin (RoO) are an integral part of all trade rules. In the case of Free Trade Agreements (FTAs), RoO determine the “nationality” of a product, and only products that are considered to have originated in FTA member countries are eligible for preferential tariff concessions. Therefore, it is evident that RoO significantly influence the effectiveness of FTAs. In East Asia (especially for ASEAN countries and China), local content or cumulative local content have become the most important criteria.for determining the origin of a product.
This paper includes three purposes: (1) to provide an overview of RoO relative to FTAs in East Asia, (2) to calculate local content in eight East Asian economies, including investigation of the factors of change in local content of some sectors, and (3) to develop a projection of the impact of both AFTA and ASEAN-China FTA based RoO on cumulative local content of ASEAN countries.
In order to calculate the local content of industries in East Asia, the Asian international input-output tables for 1990 and 2000 were used. These tables register all international and domestic inter-industry transactions in East Asia. They thus may be used to help understand the rapidly changing and increasingly internationalized production network in this region.
The paper is structured as follows: First, RoO in East Asia are discussed. Second, methods of calculating local content are explored, and decomposition analysis of the factors of change in local content is introduced in a technical note. Third, local content as well as the ASEAN and ASEAN-China cumulative local content of the manufacturing sector is calculated. Value added-based local content, considered to represent real local content of these sectors, is also presented. Finally, local content of the electronics and automotive sectors (demonstrating respectively the largest decline and largest rise in local content between 1990 and 2000) is examined; reasons for these changes are then presented.
1. Rules of Origin
In this section, RoO in FTAs are reviewed. Focus is then placed on RoO in East Asia with particular emphasis on AFTA and the AFTA-China FTA.
1.1 Rules of Origin in FTAs
There are three types of RoO in FTAs: (1) Change in Tariff Classification (CTC), (2) Value Content (VC), and (3) Technical Process (TP). In CTC, origin is granted if the exported product falls into a different part of the tariff classification from any imported inputs that are used in its production. CTC may require the product be altered in its
chapter (2 digits under the Harmonized System), heading (4 digits), sub-heading (6 digits), or item (8-10 digits) in the exporting country. VC can be defined either as the minimum percentage of the value of the product that must be added in the exporting country (local content) or the maximum percentage of imported inputs (import content). TP defines certain manufacturing or processing operations that a product must undergo in the exporting country in order to confer origin, manufacturing, or processing procedures that do not confer origin.
Some elements of RoO are designed to promote trade between FTA member countries. De minimis allows a certain percentage of imported inputs to be used without affecting the origin of the final product. The De minimis rule, however, applies to CTC and TP but does not affect VC. On the other hand, cumulation allows producers to import inputs from other FTA member countries without undermining the origin of the product. There are three types of cumulation rules: (1) bilateral cumulation in which imported inputs originating in an FTA partner country can be counted as qualifying content in addition to originating materials in an exporting country when used in the country’s exports to that partner country, (2) diagonal cumulation; in this case, imported inputs originating anywhere in the FTA partner countries can be counted as qualifying content when used in a country’s exports to the FTA area, and (3) full cumulation; here, any processing activities carried in any FTA partner country can be counted as qualifying content regardless of whether the processing is sufficient to confer originating status (Breton, 2003).1
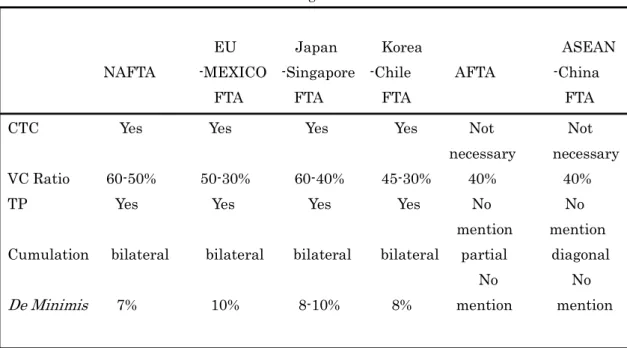
1.2 Rules of Origin in East Asia
In Table 1, six FTAs are compared in terms of CTC, VC ratio, TP, Cumulation, and De Minimis. Most FTAs apparently employ multiple criteria for setting RoO rather than applying a single rule. Among the four East Asian FTAs, the Japan-Singapore and Korea-Chile FTAs are more stringent and therefore more restrictive than AFTA and the ASEAN-China FTA. This is because Japan and Korea have depended heavily on the frameworks of existing FTAs, especially NAFTA. Thus, RoO in the FTAs of these two countries are similar to those of Western FTAs in terms of CTC, VC ratio, cumulation, and De Minimis (Cheong and Kwon, 2005).
1 In bilateral cumulation, only use of components from the (bilateral) partner country is favored. In both diagonal and full cumulation, all beneficiary trading partners of the cumulation area are favored. However, full cumulation is more liberal than diagonal cumulation, since the originating status in the FTA partner countries is not necessary and hence allows a greater use of third-country materials (Estevadeordal, 2003).
Table 1 Rules of origin in FTAs
EU Japan Korea ASEAN NAFTA -MEXICO -Singapore -Chile AFTA -China FTA FTA FTA FTA CTC Yes Yes Yes Yes Not Not necessary necessary VC Ratio 60-50% 50-30% 60-40% 45-30% 40% 40% TP Yes Yes Yes Yes No No mention mention Cumulation bilateral bilateral bilateral bilateral partial diagonal No No
De Minimis 7% 10% 8-10% 8% mention mention
Sources: Breton 2003, Estevadeordal 2003, Cheong and Kwon, 2005, ASEAN Secretariat 2005.
In contrast, AFTA and the ASEAN-China FTA have a simple and uniform format for RoO. In these two FTAs, CTC is not necessary, and TP is not mentioned; they require only one criterion of 40% local content.2 As shown below, the rule for cumulation is also less stringent.3
In order to be eligible for Common Effective Preferential Tariffs (CEPT) under AFTA and similar arrangements under the ASEAN-China FTA, a product imported into the territory of a member country from another member country must satisfy one of the following conditions: (1) the product must be wholly produced or obtained in the exporting member country or (2) at least 40% of the product’s content must originate from a member country. Condition (1) is relevant to primary products such as mineral and agricultural products4, while Condition (2) is applicable to other products which
2 However, the criterion of 40% local content is difficult to satisfy for some products. Thus other criteria, especially CTC, were later introduced into aluminums, wood-based, wheat flour, and other such products in AFTA. Also, in the China-ASEAN FTA, product-specific rules are scheduled for introduction into those products that may not satisfy the above criterion (ASEAN Secretariat, 2005).
3 In assessing East Asian FTAs, AFTA and the ASEAN-China FTA may have high scores in market access with simple and uniform RoO. However, some reservation is necessary relative to the quality of their market access. This is due to the fact they took recourse in the Enabling Clause; this allows developing countries to establish FTAs without satisfying the requirements set in GATT Article 24 (Cheong and Kwon, 2005).
may require a substantial amount of imported inputs in production.
Regarding the cumulation rule, diagonal cumulation was initially introduced in both AFTA and the ASEAN-China FTA. However, this diagonal cumulation was later replaced by partial cumulation in AFTA. In partial cumulation, “if the material has less than 40% ASEAN cumulative local content, the qualifying ASEAN national content shall be in direct proportion to the actual domestic content provided that it is equal to or more than the agreed threshold of 20%” (ASEAN Secretariat, 2005). Therefore, unlike diagonal and full cumulation, ASEAN cumulative local content is only partially taken into account as long as the intermediate inputs have more than 20% but less than 40% ASEAN cumulative local content.5
2. Calculation of Local Content
In this section, methods of calculating local content are explored. First, the RoO in AFTA (a prototype of the ASEAN-China FTA) are examined. These RoO are then applied to the methods of calculating local content with use of the Asian international input-output tables.
2. 1 Rules of Origin in AFTA
According to the RoO in AFTA, the criterion for maximum import content is given by the following formula:
[(Value of Imported Non-ASEAN Intermediate Inputs) + (Value of Undetermined Origin Intermediate Inputs)] ÷ FOB Price (of the finished product) x 100% ≤ 60%6
(1) where the FOB Price is decomposed as follows:
FOB = Ex-Factory Price + Other Costs for Export (transport costs from factory to port, storage and warehousing, port handling, brokerage fees, service charges, etc.)
4 In addition to primary products, Condition (1) is also applicable to waste, scraps, and used articles fit only for the recovery of raw materials (ASEAN Secretariat, 2005). 5 For example, consider the case where the material imported from other ASEAN member countries has 30% ASEAN cumulative local content. In this case, 0%, 30%, and 100% of the imported material price will be added to the calculation of ASEAN cumulative local content of finished products in diagonal, partial, and full cumulation respectively.
6 The original formula for this criterion is as follows (ASEAN Secretariat, 2005):
[(Value of imported non-ASEAN material, parts, or produce) + (Value of undetermined origin materials, parts, or produce)] ÷ FOB price x 100% ≤ 60%.
For this paper, original expressions were changed into more usable economic expressions.
(2) Further, the Ex-Factory Price is decomposed into the following two terms;
Ex-Factory Price = Values of Intermediate Inputs + Value Added (wages, profits, etc.) (3) On the other hand, since (Values of Intermediate Inputs) = (Value of Imported ASEAN Intermediate Inputs) + (Value of Imported Non-ASEAN Intermediate Inputs) + (Value of Undetermined Origin Intermediate Inputs) + (Value of Domestic Intermediate Inputs), Formula (1) may be rewritten as
[(Value of Imported ASEAN Intermediate Inputs) + (Value of Domestic Intermediate Inputs) + (Value Added) + (Other Costs for Export)] ÷ FOB Price x 100% ≥ 40%.
(4)
In the above formula, the left hand side is considered to represent ASEAN cumulative local content; thus, the above formula requires that the ASEAN cumulative local content be at least 40% of the FOB price.
2.2 Calculation of Direct Input-Based Local Content
In this study, the Asian international input-output tables for 1990 and 2000 were used to calculate the local content of manufacturing sectors in East Asia. Although there are limitations relative to consistency with the RoO in AFTA, these tables are the most comprehensive and suitable analytical tools to examine local content. The Asian tables are Isard-type international input-output tables, and they cover five ASEAN countries including Indonesia, the Philippines, Thailand, Malaysia, and Singapore, three Northeast Asian countries or regions including China, Korea, and Taiwan, and the countries of Japan and the United States.
(a) Local Content
Local content of domestic industries was calculated by removing the term “Value of Imported ASEAN Intermediate Inputs” from Formula (4). Using the Asian international input-output tables, it may be calculated as follows:
S j n i SS ij S j S j n i SS ij S j
V
X
v
lc
=
∑
X
+
=
∑
a
+
= =1 1/
)
(
(5)where , , respectively represent value added, output, and value added ratio of Sector j in Country S, while denotes the amount of Commodity
i
in Country S
needed by Sector j in Country S (domestic intermediate inputs from Sectors i into j).
Sj
V
X
Sjv
SjFurther,
is the number of sectors in each economy;
and representrespectively the sum of domestic intermediate input coefficients and the value added coefficient of Sector j in Country S.
n
∑
= n i SS ija
1 S jv
In Formula (5), local content is determined by intermediate input and value added coefficients which represent the input structure of industry. No roundabout (or indirect) production process is considered, so they may be considered “direct input-based local content”.7 In Formula (5), however, is valued with ex-factory prices rather than FOB prices. Unlike Formula (4), “other cost for export” is not included in the numerator of Formula (5). Considering the size of “other cost for export” vis-à-vis the FOB price, however, the accrued errors do not seem significantly large.
S j
X
(b) ASEAN Cumulative Local Content
As shown in Formula (4), ASEAN cumulative local content is the sum of local content and import content from ASEAN member countries. Therefore, ASEAN cumulative local content may be calculated as follows:
s j AS R n i RS ij S j S j AS R n i RS ij S j
V
X
v
ac
=
∑ ∑
X
+
=
∑ ∑
a
+
∈ = ∈ =1 1/
)
(
(6)where AS is a set of ASEAN member countries in which country S itself is included. It should be noted that Brunei, which joined ASEAN in 1984, and CMLV countries (Cambodia, Myanmar, Laos, and Vietnam) that joined the ASEAN in the 1990’s, are not covered in the Asian international input-output tables. In Formula (6), all imported ASEAN intermediate inputs are counted as qualifying content regardless of whether or not the processing is sufficient to confer originating status. In other words, full cumulation, instead of partial or diagonal cumulation, is implicitly assumed in Formula (6).8
(c) ASEAN-China Cumulative Local Content
According to the ASEAN-China FTA, ASEAN-China cumulative local content is the sum of ASEAN cumulative local content and import content from China; the same 40% local
7 Matsumura and Fujikawa (1998) called the local content in Formula (5) “direct technology criterion-based local content.” A different terminology is used in this study. 8 Although accrued errors are not significantly large, freight and insurance on imported intermediate inputs are not included in in Formula (6), due to the format of the Asian international input-output tables.
∑ ∑
∈AS = R n i RS ijX
1content criterion is applied for preferential tax concessions. ASEAN-China cumulative local content may then be calculated as follows:
s j AS R n i n i CS ij RS ij S j S j n i CS ij AS R n i RS ij S j
V
X
v
acc
∑ ∑
X
∑
X
∑ ∑
a
∑
a
∈ = = = ∈ =+
+
=
+
+
=
1 1 1 1/
)
(
(7)where C stands for China.
2.3 Calculation of Value Added-Based Local Content
Although Formulas (5)-(7) correspond with concepts of local content in AFTA or the ASEAN-China FTA, they may not demonstrate real local content of these countries or regions. This is because production of intermediate inputs supplied by domestic industry (which is always counted as qualifying content for tariff concession) may require other intermediate inputs imported from a second country. Therefore, value added may not accrue entirely in the first country; there may be leakage of value added from the first country. For example, if an engine is supplied by domestic industry, this portion will be given originating status for the domestic automotive industry. However, production of an engine may require substantial amounts of imported intermediate inputs (metal, engine parts, etc.), and the real local content may be significantly smaller than the direct input-based local content indicates.
(a) Local Content
Matsumura and Fujikawa (1998) present a method for calculating real local content. It is calculated by computing the proportion of valued added accruing to the domestic industry from the entire (direct as well as indirect or roundabout) production processes. Consistent with the notation used in this paper, real local content can be calculated as follows:
∑
==
n i SS ij S jlc
1*
γ
(8)where . and A represent respectively a diagonal matrix of
value added coefficients and an input coefficient matrix of the Asian international input-output table; (an element in Matrix
1
A)
(I
V
Γ
=
−
−=
ˆ
]
[
γ
RS ijVˆ
γ
RSij
Γ
) indicates value added which isinduced by one unit of final demand for Sector j in Country S, and that accrues to Sector
i in Country R. Therefore, represents the proportion of value added accruing to
all domestic industries in Country S, and local content in Equation (8) may be called
S j
“value added-based local content.”9 (b)ASEAN Cumulative Local Content
Region-wide cumulative content is calculated by extending the countries or regions covered in Equation (8). For example, the value added-based ASEAN cumulative local content is calculated as follows:
∑ ∑
∈ ==
AS R n i RS ij S jac
1*
γ
(9)(c)ASEAN-China Cumulative Local Content
Analogously, value added-based ASEAN-China cumulative local content is calculated using the following:
∑ ∑
∑
∈ = =+
=
AS R n i n i CS ij RS ij S jacc
1 1*
γ
γ
(10) 3. Empirical ResultsAlthough the Asian international input-output tables cover ten countries or regions, only the local content of the eight East Asian economies were the prime focus of this study. Japan and the U.S. were entered only as trade partners of these countries; all transactions in the Asian tables were converted into a common 27-sector classification, as shown in Table 2.10
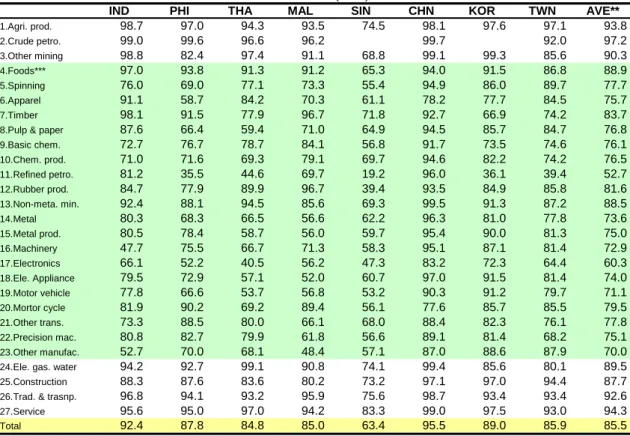
3.1 Changes in Local Contents by Sector, 1990-2000
Table 2 demonstrates the local content of 27 domestic industries in eight East Asian economies for 1990 and 2000. These tables clearly show that the primary industries (Sectors 1-3) and non-tradable goods and services (Sectors 24-27) had higher local content. With some exceptions (especially in Singapore), these sectors had more than 80% local content. Conversely, manufacturing sectors (Sectors 4 to 23) had lower local content, and some were even below the AFTA threshold of 40% (See, for example, Refined Petroleum in Singapore and Thailand and Electronics in the Philippines, Malaysia, and Thailand in 2000).
9 It is notable that feedback effects among the ten endogenous countries are taken into account when the Asian international input-output models (rather than single-country models) are employed (see Kuroiwa, 1995)
10 The original Asian international input-output tables for 1990 and 2000 had respectively 78 and 76 sector classifications.
Table 2 Local contents (1990) % *
IND PHI THA MAL SIN CHN KOR TWN AVE**
1.Agri. prod. 98.7 97.0 94.3 93.5 74.5 98.1 97.6 97.1 93.8 2.Crude petro. 99.0 99.6 96.6 96.2 99.7 92.0 97.2 3.Other mining 98.8 82.4 97.4 91.1 68.8 99.1 99.3 85.6 90.3 4.Foods*** 97.0 93.8 91.3 91.2 65.3 94.0 91.5 86.8 88.9 5.Spinning 76.0 69.0 77.1 73.3 55.4 94.9 86.0 89.7 77.7 6.Apparel 91.1 58.7 84.2 70.3 61.1 78.2 77.7 84.5 75.7 7.Timber 98.1 91.5 77.9 96.7 71.8 92.7 66.9 74.2 83.7
8.Pulp & paper 87.6 66.4 59.4 71.0 64.9 94.5 85.7 84.7 76.8
9.Basic chem. 72.7 76.7 78.7 84.1 56.8 91.7 73.5 74.6 76.1 10.Chem. prod. 71.0 71.6 69.3 79.1 69.7 94.6 82.2 74.2 76.5 11.Refined petro. 81.2 35.5 44.6 69.7 19.2 96.0 36.1 39.4 52.7 12.Rubber prod. 84.7 77.9 89.9 96.7 39.4 93.5 84.9 85.8 81.6 13.Non-meta. min. 92.4 88.1 94.5 85.6 69.3 99.5 91.3 87.2 88.5 14.Metal 80.3 68.3 66.5 56.6 62.2 96.3 81.0 77.8 73.6 15.Metal prod. 80.5 78.4 58.7 56.0 59.7 95.4 90.0 81.3 75.0 16.Machinery 47.7 75.5 66.7 71.3 58.3 95.1 87.1 81.4 72.9 17.Electronics 66.1 52.2 40.5 56.2 47.3 83.2 72.3 64.4 60.3 18.Ele. Appliance 79.5 72.9 57.1 52.0 60.7 97.0 91.5 81.4 74.0 19.Motor vehicle 77.8 66.6 53.7 56.8 53.2 90.3 91.2 79.7 71.1 20.Mortor cycle 81.9 90.2 69.2 89.4 56.1 77.6 85.7 85.5 79.5 21.Other trans. 73.3 88.5 80.0 66.1 68.0 88.4 82.3 76.1 77.8 22.Precision mac. 80.8 82.7 79.9 61.8 56.6 89.1 81.4 68.2 75.1 23.Other manufac. 52.7 70.0 68.1 48.4 57.1 87.0 88.6 87.9 70.0
24.Ele. gas. water 94.2 92.7 99.1 90.8 74.1 99.4 85.6 80.1 89.5
25.Construction 88.3 87.6 83.6 80.2 73.2 97.1 97.0 94.4 87.7
26.Trad. & trasnp. 96.8 94.1 93.2 95.9 75.6 98.7 93.4 93.4 92.6
27.Service 95.6 95.0 97.0 94.2 83.3 99.0 97.5 93.0 94.3
Total 92.4 87.8 84.8 85.0 63.4 95.5 89.0 85.9 85.5
* The Asian international input-output tables for 1990 and 2000 were used as data in this study. ** In all the tables and figures below, AVE represents an arithmetic mean of the eight East Asian countries. *** Shaded area indicates the manufacturing sector.
Local contents (2000) %
IND PHI THA MAL SIN CHN KOR TWN AVE
1.Agri. prod. 96.4 92.6 94.5 92.2 76.9 98.8 97.4 95.1 93.0 2.Crude petro. 97.8 91.9 99.5 89.0 97.1 91.8 94.5 3.Other mining 96.9 87.5 98.9 85.1 75.9 95.1 98.7 79.9 89.7 4.Foods 94.6 94.5 89.7 85.9 62.1 96.9 91.2 86.2 87.6 5.Spinning 80.4 55.4 85.4 70.3 56.3 92.1 83.2 86.1 76.1 6.Apparel 83.0 65.4 85.4 56.9 61.1 90.3 86.5 78.7 75.9 7.Timber 92.4 82.4 76.5 85.4 68.9 92.5 81.6 71.5 81.4
8.Pulp & paper 74.5 68.6 69.1 69.5 77.4 83.4 87.0 79.9 76.2
9.Basic chem. 76.9 65.2 72.2 78.1 69.7 89.3 76.5 63.5 73.9 10.Chem. prod. 77.7 65.2 71.0 67.4 74.3 92.9 81.1 68.7 74.8 11.Refined petro. 74.7 40.4 34.4 73.7 14.8 82.6 44.0 42.6 50.9 12.Rubber prod. 79.0 52.5 86.3 78.4 73.7 90.2 83.8 77.7 77.7 13.Non-meta. min. 91.2 78.9 85.4 81.9 70.4 95.8 93.0 79.2 84.5 14.Metal 82.7 66.1 69.3 54.1 64.6 91.8 81.5 77.7 73.5 15.Metal prod. 77.0 60.4 62.5 60.4 73.1 93.1 91.4 85.4 75.4 16.Machinery 51.9 64.3 57.6 64.1 60.2 91.8 88.1 74.2 69.0 17.Electronics 80.6 34.5 39.1 36.6 50.1 75.3 63.4 58.0 54.7 18.Ele. Appliance 75.2 63.4 50.5 56.0 62.2 90.3 87.0 74.4 69.9 19.Motor vehicle 83.7 66.4 59.8 68.5 58.7 91.0 92.3 80.4 75.1 20.Mortor cycle 92.7 59.1 73.0 75.9 51.1 94.2 87.0 90.9 78.0 21.Other trans. 62.3 69.8 67.3 65.6 79.0 94.2 80.9 69.9 73.6 22.Precision mac. 83.0 58.6 71.2 52.4 58.7 88.3 82.7 61.3 69.5 23.Other manufac. 71.7 56.9 69.3 68.9 60.3 87.4 90.3 83.3 73.5
24.Ele. gas. water 94.1 84.5 97.9 91.0 92.9 96.6 78.4 98.4 91.7
25.Construction 83.9 85.6 83.4 76.7 81.7 94.8 96.9 89.2 86.5
26.Trad. & trasnp. 91.9 91.2 98.7 83.7 79.1 97.3 87.1 92.8 90.2
27.Service 96.4 93.4 96.2 86.7 86.6 96.5 97.3 96.0 93.6
Total 90.0 80.1 82.0 69.9 69.3 93.2 87.2 83.1 81.9
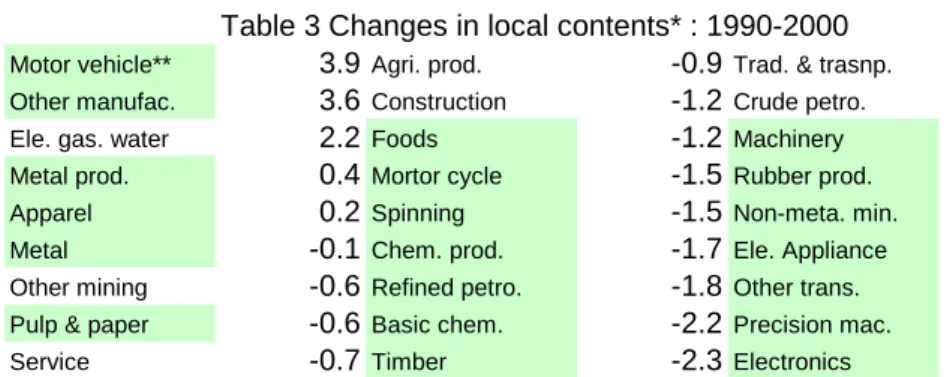
It is clear that manufacturing sectors, which are most relevant to the RoO in FTA, should be given priority in the analysis of local content. It is also notable that local content declined in many sectors in the period 1990-2000. Table 3 shows (in descending order) changes in average local content for the eight East Asian economies between 1990 and 2000. Only 5 out of 27 industries increased local content in this period. Among them, automotive (+3.9%) and electronics (-5.6%) sectors are at the opposite ends of the spectrum. These two industries and an exploration of the causes of these changes are discussed later.
Table 3 Changes in local contents* : 1990-2000
Motor vehicle** 3.9Agri. prod. -0.9Trad. & trasnp. -2.4
Other manufac. 3.6Construction -1.2Crude petro. -2.6
Ele. gas. water 2.2Foods -1.2Machinery -3.9
Metal prod. 0.4Mortor cycle -1.5Rubber prod. -3.9
Apparel 0.2Spinning -1.5Non-meta. min. -4.0
Metal -0.1Chem. prod. -1.7Ele. Appliance -4.1
Other mining -0.6Refined petro. -1.8Other trans. -4.2
Pulp & paper -0.6Basic chem. -2.2Precision mac. -5.5
Service -0.7Timber -2.3Electronics -5.6
* The figures in the table indicate the changes in AVE over the period 1990-2000. ** Shaded area indicates the manufacturing sector.
Data: Asian International Input-Output Tables (1990, 2000)
3. 2 The Manufacturing Sector
In order to investigate local content of the whole manufacturing sector, Sectors 4 to 23 in the Asian tables were aggregated into one sector, and methods of analysis introduced in the previous section were applied.
(1) Local Content
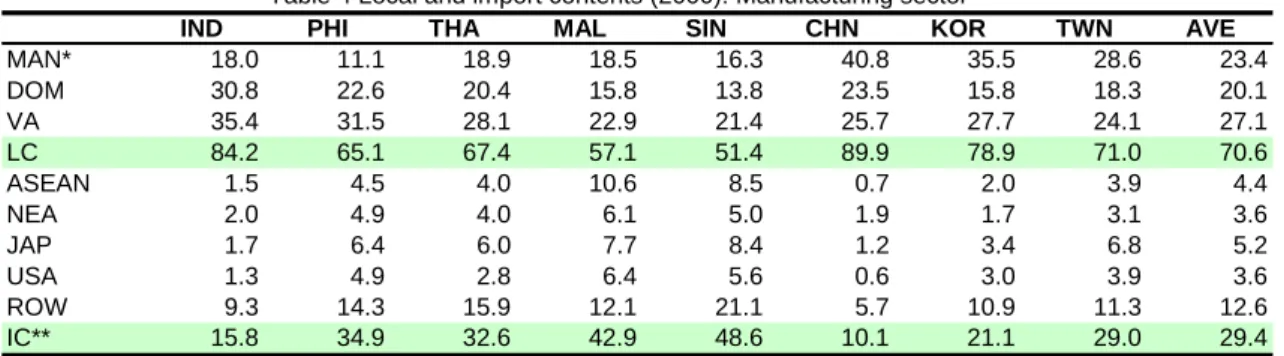
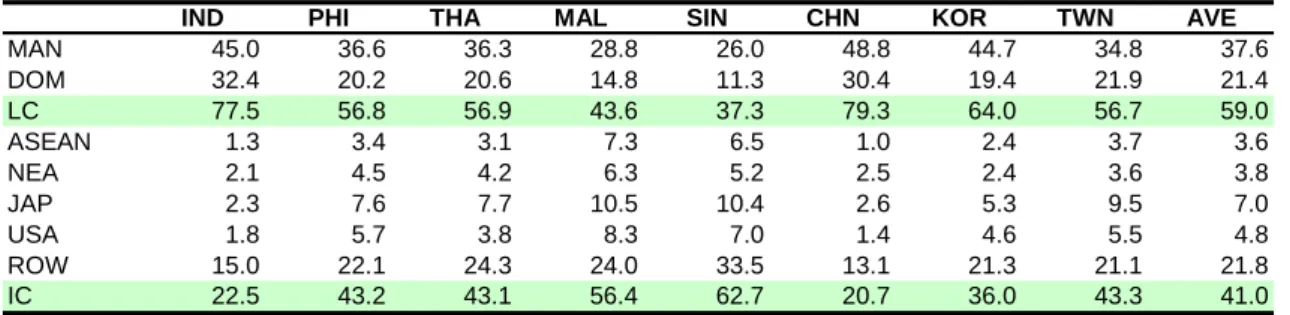
Table 4 demonstrates the input structure of the manufacturing sector in 2000. Local content is decomposed into three components: inputs from its own sector (the manufacturing sector), inputs from other domestic sectors, and value added components. Considering the size of each economy, it is clear that large economies, especially in terms of population, tend to have high local content. China and Indonesia, for example, had higher local content than more advanced economies such as those of Korea and Taiwan. Further, the contribution of China’s own manufacturing sector (40.8%) was outstanding; this reflects a relatively strong industrial base of China’s supporting industry. On the other hand, small and open economies, such as Singapore and Malaysia, had less than 60% local content, and the ASEAN economies in general had lower local content than Northeast Asian economies.
Table 4 Local and import contents (2000): Manufacturing sector
IND PHI THA MAL SIN CHN KOR TWN AVE
MAN* 18.0 11.1 18.9 18.5 16.3 40.8 35.5 28.6 23.4 DOM 30.8 22.6 20.4 15.8 13.8 23.5 15.8 18.3 20.1 VA 35.4 31.5 28.1 22.9 21.4 25.7 27.7 24.1 27.1 LC 84.2 65.1 67.4 57.1 51.4 89.9 78.9 71.0 70.6 ASEAN 1.5 4.5 4.0 10.6 8.5 0.7 2.0 3.9 4.4 NEA 2.0 4.9 4.0 6.1 5.0 1.9 1.7 3.1 3.6 JAP 1.7 6.4 6.0 7.7 8.4 1.2 3.4 6.8 5.2 USA 1.3 4.9 2.8 6.4 5.6 0.6 3.0 3.9 3.6 ROW 9.3 14.3 15.9 12.1 21.1 5.7 10.9 11.3 12.6 IC** 15.8 34.9 32.6 42.9 48.6 10.1 21.1 29.0 29.4
* MAN and DOM respectively indicate input coefficients of the manufacturing sector and other domestic sectors. ** Local content (LC) + IM (Import content) = 100 %.
Data: Asian International Input-Output Table (2000)
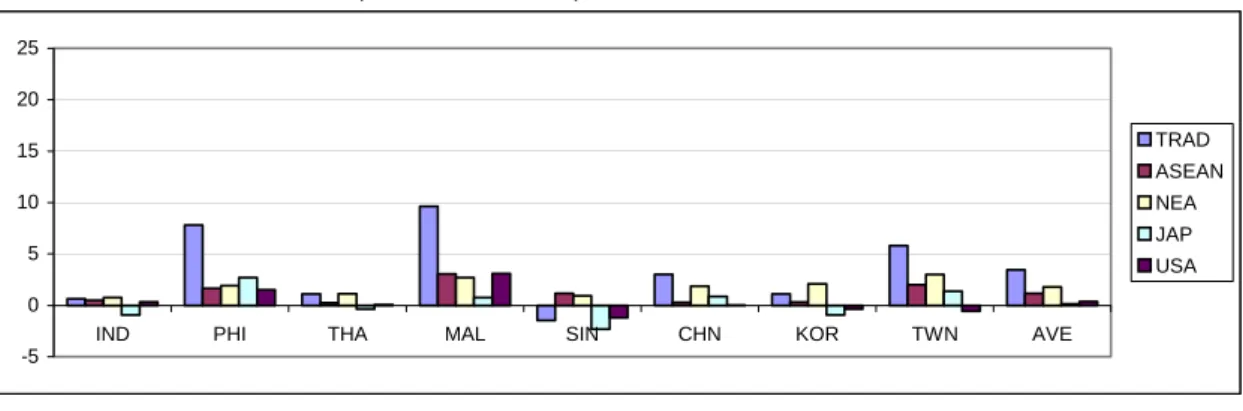
The second part of Table 4 shows import contents of the manufacturing sector. These include inputs from ASEAN, Northeast Asia (NEA), Japan, the U.S., and the Rest of the World (ROW). Although inputs from Japan declined significantly as shown below, they were still fairly large in 2000, exceeding 5% in Singapore, Malaysia, Taiwan, the Philippines, and Thailand. Inputs from the U.S. also exceeded 5% in Malaysia and Singapore. On the other hand, only Malaysia and Singapore had more than 5% inputs from ASEAN or Northeast Asia. Looking at the Asian Table, it is seen that bilateral linkages between Malaysia and Singapore were so strong that as much as 6.5% and
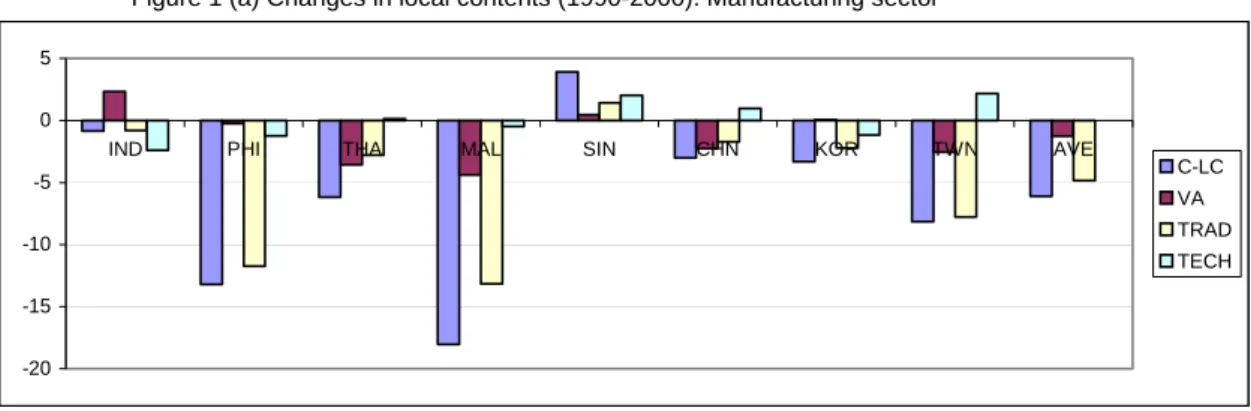
5.9% respectively in their ASEAN cumulative local content originated in bilateral trade. Figure 1 (a) shows factors related to changes in local content in the period
1990-2000. These include: (1) changes in value added coefficients (changes in shares of value added in total inputs), (2) changes in trade structure (changes in trade coefficients or import shares), and (3) changes in technology (changes in technological input coefficients). Details of the methodology may be found in the Technical Note.
Figure 1 (a) shows that local content decreased in all countries with the exception of Singapore. In particular, local content in the Malaysian manufacturing sector was reduced by 18%; this was followed by the Philippines with 13.2 % reduction. It is also notable that changes in local content were in parallel with changes in trade structure. This implies that trade structural change was a leading factor for local content changes.
Figure 1 (a) Changes in local contents (1990-2000): Manufacturing sector* *C-LC=VA+TRAD+TECH -20 -15 -10 -5 0 5
IND PHI THA MAL SIN CHN KOR TWN AVE
C-LC VA TRAD TECH
Figure 1 (b) Changes in import contents (1990-2000): Manufacturing sector*
* C-IC=ASEAN+NEA+JAP+USA+ROW
=TRAD (in Figure 1 (c)) + TECH (in Figure 1 (d)) + ROW (in Figure 1 (b)) -5 0 5 10 15 20
IND PHI THA MAL SIN CHN KOR TWN AVE
C-IC ASEAN NEA JAP USA ROW
Figure 1 (c) Impacts of trade structural changes (1990-2000): Manufacturing sector*
* TRAD=ASEAN+NEA+JAP+USA -5 0 5 10 15 20
IND PHI THA MAL SIN CHN KOR TWN AVE
TRAD ASEAN NEA JAP USA
Figure 1 (d) Impacts of technological structural changes (1990-2000): Manufacturing sector*
* TECH=ASEAN+NEA+JAP+USA
Data: Asian International Input-Output Tables (1990, 2000) -5 0 5 10 15 20
IND PHI THA MAL SIN CHN KOR TWN AVE
TECH ASEAN NEA JAP USA
Figure 1 (b) reveals how import content changed by country of origin in the period 1990-2000. Together, these figures show that changes in local content summed with changes in important content equal zero. The latter is further decomposed into changes in inputs from ASEAN, Northeast Asia (NEA), Japan, the United States, and ROW. It is notable that ASEAN economies had sharply increased inputs from ASEAN; Northeast Asian economies had such increases relative to inputs from NEA. This implies that geographical proximity may have affected procurement of intermediate inputs. Inputs from Japan and the U.S. did not increase significantly or even decrease, especially in Singapore and Korea. The latter indicates a significant shift in import content away from Japan and the U.S. toward other East Asian economies. Changes in import contents from ASEAN, Northeast Asia (NEA), Japan, and the U.S., as seen in Figure 1 (b), were further decomposed into the impact of trade structural changes and technological changes in Figures 1 (c) and (d) respectively (see Equation 17). East Asian economies in Figure 1 (c), especially Singapore and Korea, clearly indicate the diversion of import shares away from Japan and the U.S. to East Asia Since the impact of technological changes was removed from import content changes, Figure 1 (c) provides strong evidence that trade structural changes were a major driver in import content changes. On the other hand, Figure 1 (d) shows that impact of technological changes was minimal, except in some ASEAN economies.
(2) ASEAN and ASEAN-China Cumulative Local Content
As of 1990 and 2000, AFTA and the ASEAN-China FTA were not fully implemented, but it is still meaningful, using past trends, to project the impact of the cumulation rule on local content of ASEAN countries11.
Table 5 shows the ASEAN and ASEAN-China cumulative local content of the manufacturing sector. In 1990, ASEAN cumulative local content of each ASEAN member country was higher than the respective local content by from 0.9% in Indonesia to 7.3% in Singapore. Further, ASEAN-China cumulative local content exceeded ASEAN cumulative local content by from 0.2% in the Philippines to 1.8% in Singapore. These facts suggest that local content may significantly increase due to the cumulation rule in such open economies as Singapore and Malaysia.
Although local content (other than in Singapore) decreased in the period
11 AFTA was finalized in 1992, and the reduction of tariff rates started in 1993.
Consequently, almost all products in the Common Effective Preferential Tariff (CEPT) Scheme Inclusion List (IL) in the 6 ASEAN countries (Indonesia, the Philippines, Thailand, Malaysia, Singapore, and Brunei) were reduced to the 0-5% tariff range in 2003. On the other hand, agreement was reached on the ASEAN-China FTA in 2002, and the early harvest package was initiated in 2004.
1990-2000, some of this decrease was offset by an increase in inputs from neighboring ASEAN countries and China. Therefore, ASEAN as well as ASEAN-China cumulative local content did not decrease as much as local content per se. For example, due to stronger linkages with neighboring ASEAN countries, ASEAN content in 2000 was higher than local content in values ranging from 1.5% in Indonesia to 10.6% in Malaysia. On average, however, cumulative local content decreased in this period due to rising dependency on the outer world.12
Table 5 ASEAN and ASEAN-China cumulative local contents: Manufacturing sector
IND PHI THA MAL SIN AVE
LC (90) 85.0 78.3 73.5 75.2 47.5 71.9 AS (90)* 85.9 80.1 76.0 79.4 54.8 75.2 AS-C (90)** 86.3 80.3 76.7 80.0 56.6 76.0 LC (00) 84.2 65.1 67.4 57.1 51.4 65.0 AS (00) 85.7 69.6 71.3 67.7 59.9 70.8 AS-C (00) 86.5 70.3 72.9 69.2 62.0 72.2
*AS represents an ASEAN cumulative local content.
**AS-C represents an ASEAN-China cumulative local content. Data: Asian International Input-Output Tables (1990, 2000)
(3) Value Added-Based Local Content
Table 6 shows value added-based local content of the manufacturing sector in 2000. Value added-based local content was considerably lower than direct input-based local content (Table 4), and the differences between the two varied from 6.7% in Indonesia to 14.9% in Korea. Taiwan and Singapore also had a difference of more than 14%. This
12 As an exercise, the ASEAN-Korea, ASEAN-Japan, and ASEAN-China-Korea-Japan (ASEAN+3) content of the manufacturing sector was calculated. The table below shows that the ASEAN-Korea content increased local content to almost the same extent as did ASEAN-China content. On the other hand, ASEAN-Japan content was considerably greater than that of the other two, reflecting ASEAN’s greater dependency on Japan. It is notable that the contribution of the cumulation rule increased over the period 1990- 2000. For example, the difference between ASEAN+3 and local content in Malaysia increased from 10.1% to 21.8%.
ASEAN-Korea, -Japan, +3 cumulative local contents: Manufacturing sector
IND PHI THA MAL SIN AVE
AS-K (90)* 86.3 80.7 76.7 79.9 56.1 76.0 AS-J (90)** 88.4 82.6 81.8 84.2 66.3 80.7 AS+3 (90)*** 89.2 83.5 83.3 85.3 69.4 82.1 AS-K (00) 86.4 71.9 72.5 69.7 61.5 72.4 AS-J (00) 87.4 76.0 77.3 75.4 68.3 76.9 AS+3 (00) 89.0 79.1 80.1 78.9 72.0 79.8 * AS-K represents an ASEAN-Korea cumulative local content.
** AS-J represents an ASEAN-Japan cumulative local content.
*** AS+3 represents an ASEAN-China-Korea-Japan cumulative local content.
implies that the direct input-based local content in these three economies included overestimates of more than 14% relative to real local content.
When direct input-based local content is used, the real import content from ASEAN countries seems overestimated, while that from Japan and the U.S. appears underestimated. It can thus be seen that direct input-based local content tends to include an overestimate of real local content when countries do not have well-developed local supporting industries, and vice versa.
Table 6 Local and import contents (2000): Manufacturing sector (value added-based)
IND PHI THA MAL SIN CHN KOR TWN AVE
MAN 45.0 36.6 36.3 28.8 26.0 48.8 44.7 34.8 37.6 DOM 32.4 20.2 20.6 14.8 11.3 30.4 19.4 21.9 21.4 LC 77.5 56.8 56.9 43.6 37.3 79.3 64.0 56.7 59.0 ASEAN 1.3 3.4 3.1 7.3 6.5 1.0 2.4 3.7 3.6 NEA 2.1 4.5 4.2 6.3 5.2 2.5 2.4 3.6 3 JAP 2.3 7.6 7.7 10.5 10.4 2.6 5.3 9.5 7.0 USA 1.8 5.7 3.8 8.3 7.0 1.4 4.6 5.5 4 ROW 15.0 22.1 24.3 24.0 33.5 13.1 21.3 21.1 21.8 IC 22.5 43.2 43.1 56.4 62.7 20.7 36.0 43.3 41.0
Data: Asian International Input-Output Table (2000)
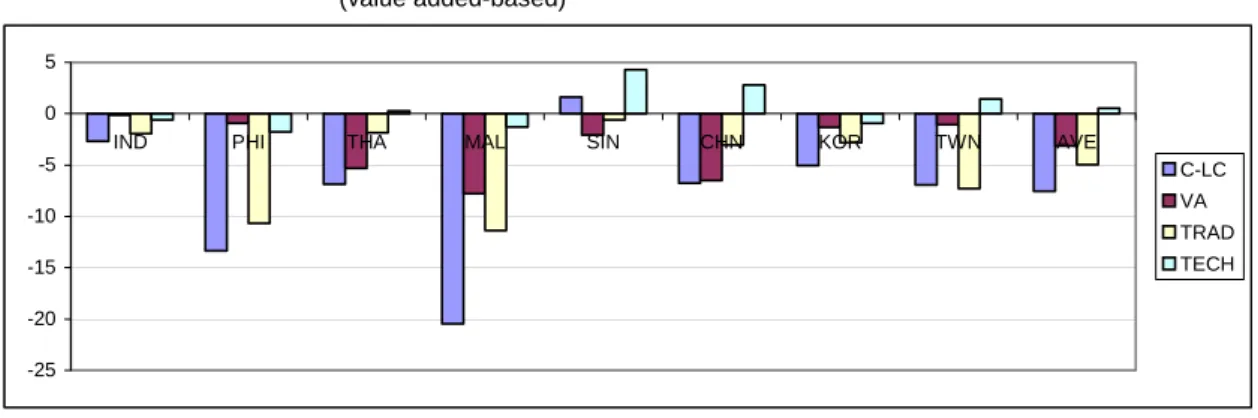
.8 .8
Figures 2 (a)-(e) correspond to Figures 1 (a)-(d), except for Figure 2 (c) that demonstrates the impact of changes in value added coefficients (see Equation 24). There are many similarities between the numbers for direct input and value added-based local content, but there are also notable differences. First, the impact of value added coefficient changes on import content was very small in all economies (see Figure 2 (c)). Second, the diversion of import shares away from Japan and the U.S. to East Asia, especially to ASEAN countries, became less clear when value added-based local content was used (see Figure 2 (d)).
Table 7 shows value added-based ASEAN and ASEAN-China cumulative local content. Value added-based content was considerably lower than direct input-based content in ASEAN countries. In particular, these differences were extremely large in Malaysia and Singapore, and they also increased over time. For example, in Malaysia, the difference between direct input and value added-based ASEAN cumulative local content increased from 12.3% to 16.8%.13
13 Regarding ASEAN-Korea, ASEAN-Japan, and ASEAN+3 content, it is notable that the differences between direct input-based and value added-based cumulative local content became smaller when Japan was incorporated into the scheme.
Figure 2 (a) Changes in local contents (1990-2000): Manufacturing sector (value added-based) *C-LC=VA+TRAD+TECH -25 -20 -15 -10 -5 0 5
IND PHI THA MAL SIN CHN KOR TWN AVE
C-LC VA TRAD TECH
Figure 2 (b) Changes in Import contents (1990-2000): Manufacturing sector* (value added-based)
* C-IC=ASEAN+NEA+JAP+USA+ROW
=VA (in Figure 2 (c)) + TRAD (in Figure 2 (d)) + TECH (in Figure 2 (e)) + ROW (in Figure 2 (b)) -5 0 5 10 15 20 25
IND PHI THA MAL SIN CHN KOR TWN AVE
C-IC ASEAN NEA JAP USA ROW
ASEAN-Korea, -Japan, +3 cumulative local contents: Manufacturing sector (value added-based)
IND PHI THA MAL SIN AVE
AS-K (90) 81.3 72.6 66.9 67.7 43.9 66.5 AS-J (90) 84.0 75.5 73.5 74.3 55.7 72.6 AS+3 (90) 84.9 76.6 75.2 75.8 58.9 74.3 AS-K (00) 79.5 62.2 61.2 52.9 45.4 60.2 AS-J (00) 81.0 67.7 67.8 61.4 54.3 66.4 AS+3 (00) 82.8 70.8 70.8 65.4 58.2 69.6
Figure 2 (c) Impacts of value added coefficients changes (1990-2000): Manufacturing sector (value added-based) *VA=ASEAN+NEA+JAP+USA -5 0 5 10 15 20 25
IND PHI THA MAL SIN CHN KOR TWN AVE
VA ASEAN NEA JAP USA
Figure 2 (d) Impacts of trade structural changes (1990-2000): Manufacturing sector (value added-based) * TRAD=ASEAN+NEA+JAP+USA -5 0 5 10 15 20 25
IND PHI THA MAL SIN CHN KOR TWN AVE
TRAD ASEAN NEA JAP USA
Figure 2 (e) Impacts of technological structural changes (1990-2000): Manufacturing sector (value added-based)
* TECH=ASEAN+NEA+JAP+USA
Data: Asian International Input-Output Tables (1990, 2000) -5 0 5 10 15 20 25
IND PHI THA MAL SIN CHN KOR TWN AVE
TECH ASEAN NEA JAP USA
Table 7 ASEAN and ASEAN-China cumulative local contents: Manufacturing sector (value added-based)
IND PHI THA MAL SIN AVE
LC (90) 80.1 70.1 63.8 64.0 35.7 62.8 AS (90) 80.9 71.9 66.1 67.1 42.7 65.8 AS-C (90) 81.4 72.2 67.1 67.9 44.7 66.7 LC (00) 77.5 56.8 56.9 43.6 37.3 54.4 AS (00) 78.7 60.2 60.1 50.9 43.9 58.7 AS-C (00) 79.7 61.2 62.0 52.9 46.3 60.4
Data: Asian International Input-Output Tables (1990, 2000)
4. Sector Analysis
As shown in Table 3, the electronics and automotive sectors demonstrated respectively the largest decline and the largest rise in local content between 1990 and 2000. This section includes focus on these two sectors as well as an exploration of the causes of these changes. However, due to limited space, only the analysis of direct input-based local content is viewed.
4. 1 Electronics Sector (1) Local Content
Table 10 shows that in 2000, local content of the electronics sector in the Philippines, Malaysia, and Thailand was below 40%. They thus had extremely high dependency on imported intermediate inputs. In addition to strong dependency on Japan and the U.S., the import content from both ASEAN and Northeast Asia was very high in the Philippines (8.3%, 8.6%), Thailand (11.6%, 10.1%), Malaysia (17.2%, 9.3%), and Singapore (10.8%, 6.5%). The Asian Table indicates that these four countries had strong linkages with each other. For example, Singapore and Malaysia electronics sectors imported respectively 8.2% and 10.7% of their total inputs from one another. As shown below, in addition to linkages with neighboring countries, linkages between ASEAN and Northeast Asia were strengthened. Consequently, the procurement of intermediate inputs in the electronics sector became rather diversified.
Table 8 Local and import contents (2000): Electronics sector
IND PHI THA MAL SIN CHN KOR TWN AVE
ELE 3.1 1.6 6.3 5.6 15.4 27.6 16.0 13.6 11.1 DOM 47.0 8.7 16.4 14.8 15.0 24.5 21.0 24.6 21.5 VA 30.5 24.2 16.4 16.1 19.8 23.2 26.4 19.8 22.0 LC 80.6 34.5 39.1 36.6 50.1 75.3 63.4 58.0 54.7 ASEAN 1.8 8.3 11.6 17.2 10.8 3.0 4.5 8.3 8.2 NEA 2.4 8.6 10.1 9.3 6.5 5.6 3.7 5.7 6.5 JAP 2.8 16.8 11.7 10.7 11.7 2.6 7.9 11.7 9.5 USA 1.4 12.7 8.6 11.4 6.8 1.8 8.3 5.7 7.1 ROW 11.0 19.2 18.8 14.8 14.1 11.6 12.2 10.6 14.0 IC 19.4 65.5 60.9 63.4 49.9 24.7 36.6 42.0 45.3
Figures 3 (a) and (b) show that all countries, except for Indonesia and Singapore, had increased import content. Import content from ASEAN and Northeast Asia increased considerably, while that from Japan and the U.S. decreased in countries such as Thailand, Singapore, and Taiwan. Similar tendencies were observed in other East Asian countries.
The impact of trade structural changes is more clearly demonstrated in Figure 3 (c). Here, the impact of technical changes was removed from import content changes. Figure 3 (c) shows the diversion of import shares moving away from Japan and the U.S. to East Asia. Note that inputs from Japan declined in all countries due to changes in trade structure. Further, the electronics sector in the Philippines, Thailand, and Malaysia strengthened linkages with Northeast Asia to a greater extent than with neighboring Southeast Asian countries (vice versa in Korea and Taiwan). These facts suggest that diversification in procurement of intermediate inputs in the electronics sector proceeded throughout East Asia over the period 1990-2000. Figure 3 (d) shows that in some ASEAN countries, technological changes had a strong effect on import content of the electronics industry.
Figure 3 (a) Changes in local contents (1990-2000): Electronics sector -25 -20 -15 -10 -5 0 5 10 15 20
IND PHI THA MAL SIN CHN KOR TWN AVE
C-LC VA TRAD TECH
Figure 3 (b) Changes in import contents (1990-2000): Electronics sector Figure 11 -20 -15 -10 -5 0 5 10 15 20 25
IND PHI THA MAL SIN CHN KOR TWN AVE
C-IC ASEAN NEA JAP USA ROW
Figure 3 (c) Impacts of trade structural changes (1990-2000): Electronics sector
-20 -15 -10 -5 0 5 10 15 20 25
IND PHI THA MAL SIN CHN KOR TWN AVE
TRAD ASEAN NEA JAP USA
Figure 3 (d) Impacts of technological structural changes (1990-2000): Electronics sector
Data: Asian International Input-Output Tables (1990, 2000) -20 -15 -10 -5 0 5 10 15 20 25
IND PHI THA MAL SIN CHN KOR TWN AVE
TECH ASEAN NEA JAP USA
(2) ASEAN and ASEAN China Cumulative Local Contents
Table 9 provides information on the ASEAN and ASEAN-China cumulative local content of the electronics sector. Although local content of the electronics sector in the Philippines, Thailand, and Malaysia declined over the period 1990-2000, ASEAN and ASEAN-China cumulative local content in 2000 was considerably greater than local content in these countries due to rising import content from ASEAN neighbors and China; in Malaysia, for example, the difference between local and ASEAN cumulative local content increased from 8.4% to 17.2%. However, ASEAN cumulative local content in these countries, which is the sum of local content and inputs from neighboring ASEAN countries, declined due to rising dependency on the outer world. ASEAN-China cumulative local content increased only in Thailand.14
Table 9 ASEAN and ASEAN-China cumulative local contents: Electronics sector
IND PHI THA MAL SIN AVE
LC (90) 66.1 52.2 40.5 56.2 47.3 52.5 AS (90) 69.2 58.4 51.2 64.6 55.5 59.8 AS-C (90) 69.6 58.4 51.4 64.9 55.8 60.0 LC (00) 80.6 34.5 39.1 36.6 50.1 48.2 AS (00) 82.4 42.7 50.8 53.8 61.0 58.1 AS-C (00) 83.2 43.3 54.5 55.7 63.3 60.0
Data: Asian International Input-Output Tables (1990, 2000)
4.2 Automotive Sector (1)Local Content
Table 10 shows that local content in the automotive sector was considerably larger than local content in the electronics sector. For example, local content of automotive industries in Korea, China, Indonesia, and Taiwan exceeded 80% to 90% in 2000. Unlike the electronics sector, import content from ASEAN and Northeast Asia was relatively
14 The table below shows the cumulative local content of the electronics sector in ASEAN-Korea, ASEAN-Japan, and ASEAN + 3 arrangements. As in the manufacturing sector, inclusion of Japan in such an arrangement appears to increase the cumulative content drastically. However, its impact declined over this period; that of the inclusion of Korea and China grew by a sizable magnitude.
ASEAN-Korea, -Japan, +3 cumulative local contents: Electronics sector
IND PHI THA MAL SIN AVE
AS-K (90) 70.5 59.4 52.7 65.7 57.9 61.2 AS-J (90) 77.3 75.7 66.5 73.9 74.3 73.6 AS+3 (90) 79.0 76.7 68.3 75.3 77.0 75.2 AS-K (00) 83.4 48.0 54.4 56.8 63.1 61.2 AS-J (00) 85.2 59.5 62.5 64.5 72.7 68.9 AS+3 (00) 87.0 65.3 69.9 69.4 77.2 73.8
small. That from Japan was predominantly large as seen for example in Thailand (17.5%).
Table 10 Local and import contents (2000): Automotive sector
IND PHI THA MAL SIN CHN KOR TWN AVE
AUTO 11.3 2.4 8.4 16.7 2.9 36.4 32.1 22.9 16.6 DOM 29.0 41.3 24.9 15.9 29.7 30.8 36.8 23.5 29.0 VA 43.4 22.6 26.5 35.9 26.0 23.8 23.4 34.0 29.5 LC 83.7 66.4 59.8 68.5 58.7 91.0 92.3 80.4 75.1 ASEAN 0.8 5.1 2.2 3.7 4.9 0.1 0.2 0.7 2.2 NEA 0.9 6.1 2.2 3.2 3.4 0.9 0.5 1.2 2 JAP 5.6 8.4 17.5 14.1 9.6 2.1 2.4 7.0 8.3 USA 0.8 1.9 1.7 2.2 4.1 0.4 1.3 1.5 1 ROW 8.3 12.2 16.7 8.3 19.3 5.5 3.4 9.3 10.4 IC 16.3 33.6 40.2 31.5 41.3 9.0 7.7 19.6 24.9
Data: Asian International Input-Output Table (2000)
.3 .7
Figure 4 (a) shows that with the exception of the Philippines, East Asian countries increased local content in the automotive sector. The Malaysian automotive sector, in particular, increased local content by 11.7%. The value added coefficient reduced local content, while technological and trade structural changes raised it in many countries.
In Figure 4 (b), it is notable that except for Taiwan, inputs from Japan declined. They fell more than 10% in the Philippines, Malaysia, and Singapore. On the other hand, inputs from the U.S. did not demonstrate such a clear tendency. In fact, they increased slightly in several countries. Thus, although import content from Japan was still dominant, there was a substantial shift in import content away from Japan (and the U.S., if any, to a lesser extent) to East Asia in the period 1990-2000. Further, the automotive sector in ASEAN increased inputs from neighboring ASEAN countries more than from Northeast Asia (vice versa in Northeast Asia).
Figure 4 (c) shows clearly the diversion of import shares away from Japan to East Asia. Diversion from the U.S. was more ambiguous. Figure 4 (d) shows that the impact of technological change was rather large in some ASEAN countries.
Figure 4 (a) Changes in local contents (1990-2000): Automotive sector -15 -10 -5 0 5 10 15 20
IND PHI THA MAL SIN CHN KOR TWN AVE
C-LC VA TRAD TECH
Figure 4 (b) Changes in import contents (1990-2000): Automotive sector
-20 -15 -10 -5 0 5 10 15
IND PHI THA MAL SIN CHN KOR TWN AVE
C-IC ASEAN NEA JAP USA ROW
Figure 4 (c) Impacts of trade structural changes (1990-2000): Automotive sector
-20 -15 -10 -5 0 5 10 15
PHI THA MAL SIN CHN KOR TWN AVE
TRAD ASEAN NEA JAP USA
Figure 4 (d) Impacts of technological structural changes (1990-2000): Automotive sector
Data: Asian International Input-Output Tables (1990, 2000) -20 -15 -10 -5 0 5 10 15
IND PHI THA MAL SIN CHN KOR TWN AVE
TECH ASEAN NEA JAP USA
(2) ASEAN and ASEAN-China Cumulative Local Content
Table 11 reflects the input structure of the automotive sector. Inputs from neighboring ASEAN countries and China appear relatively small. Thus, ASEAN and ASEAN-China content was not significantly greater than local content, although the difference between them increased over the period 1990-2000. Unlike the electronics sector, ASEAN and ASEAN-China cumulative local content in the automotive sector increased in all countries due to rising local and import content from neighboring countries.15
Table 11 ASEAN and ASEAN-China cumulative local contents: Automotive sec
IND PHI THA MAL SIN AVE
LC(90) 77.8 66.6 53.7 56.8 53.2 61.6 A(90) 78.3 67.2 55.0 57.5 57.1 63.0 A-C(90) 78.4 67.2 55.7 57.6 57.4 63.3 LC(00) 83.7 66.4 59.8 68.5 58.7 67.4 A(00) 84.5 71.5 61.9 72.2 63.5 70.7 A-C(00) 84.8 72.9 62.6 73.1 65.4 71.8
Data: Asian International Input-Output Tables (1990, 2000)
4.3 Factors Affecting Local Content
As seen above, there was a strong contrast in trends of local content in the electronics and automotive sectors. Regarding factors that affect local content, Baba (2005) pointed out that (1) characteristics of parts and components (especially transport cost and architecture), and (2) industrial policies in East Asia (whether import substitution or export-oriented) are important determinants of the development of local supporting industry. Using his analytical framework, the above phenomena may be explained as follows:
15 Compared with the electronics sector, impact of the inclusion of Japan is quite large in the automotive sector. For example, in 1990, the difference between the ASEAN-Japan and the ASEAN cumulative local content in Malaysia was as large as 26.5%; that for ASEAN-China content was only 0.1%. However, as seen in Figure 4(b), import content from Japan declined over this time, and so did the impact of the inclusion of Japan in the cumulative content. Import content from China and Korea increased only slightly in this period.
ASEAN-Korea, -Japan, +3 cumulative local contents: Automotive sector
IND PHI THA MAL SIN AVE
AS-K (90) 78.7 69.1 55.5 57.6 57.3 63.6 AS-J (90) 90.1 89.3 75.7 84.0 77.6 83.3 AS+3 (90) 90.8 91.2 77.0 84.2 78.2 84.3 AS-K (00) 84.8 74.2 62.6 73.3 64.5 71.9 AS-J (00) 90.1 79.8 79.4 86.3 73.1 81.7 AS+3 (00) 90.7 84.1 80.8 88.3 76.0 84.0
(1) Characteristics of Parts and Components
Transport costs for parts and components are important factors in the determination of local content. For example, parts and components in the automotive industry (body parts, engine parts, brakes, suspension assemblies, etc.) are much more bulky and are heavier than those in the electronics industry (magnetic heads, ICs, PCBs, condensers, etc.). Therefore, automotive assemblers have stronger incentives to save on transport costs by procuring their parts locally.16 In fact, the study shows that parts suppliers of the Japanese automotive industry, the dominant automotive producer in Southeast Asia, tend to locate near their assemblers. This is because such geographical proximity not only lowers the transport and inventory costs (or facilitates “just-in time deliveries” as in case of Toyota) but also facilitates product development coordination between part suppliers and assemblers (Dyer, 1994, 1996).
In addition to relatively low transport costs, modular architecture has become common in the electronics industry (PCs and cell phones for example). Since modular architecture has led to standardized specifications (especially interfaces between modules or components), parts and components can be readily substituted for imports. On the other hand, integral architecture is more common in the automotive industry where parts and components are not necessarily standardized (Fujimoto, 2004). Thus, as Dyer pointed out, geographical proximity is important for facilitating the development of specific parts and components.
(2) Industrial policy in East Asia
The automotive industry has been strategically important due to strong linkages with supporting industries. In fact, until recent years, many East Asian countries heavily protected automotive parts suppliers as well as assemblers. For example, the Thai government introduced the local content requirement policy in 1971, and until it was abolished in 2000, it made a valuable contribution to raising the local content of the Thai automotive industry (Terdudomtham, 2000). Further, because there was a lack of competition in the domestic market, the automotive industry did not need to import parts and components to increase competitiveness.
Brand-to-Brand Complementation (BBC) and ASEAN Industrial Cooperation (AICO) schemes, which were initiated respectively in 1988 and 1996, reduced trade
16 Within the electronics industry, transport costs affect the procurement of parts and components. Letchumanan and Kodama (2000) demonstrated that weights of parts in the electronics industry are positively correlated with the percentage of local procurement; the heavier the parts, the higher the percentage of local procurement.
barriers of automotive parts and components within ASEAN. They thus seem to have contributed to increasing import content of the automotive industry from neighboring ASEAN countries (see Figure 4 (b)).
Export-oriented industries in East Asia have been given privileges over other industries. These have included unlimited access to imported intermediate inputs and exemption of import duty. Thus, the electronics industry, which was one of the most successful export-oriented industries in East Asia, did not have much incentive to raise the share of local procurement. Further, due to fierce competition in the international market, they needed to import electronics parts in order to strengthen competitiveness. These factors appear to have promoted diversification of the procurement of parts and components in the electronics industry.
5. Conclusion
After reviewing the RoO in AFTA and the ASEAN-China FTA, various kinds of local content were measured using the Asian international input-output tables. Major findings in this study can be summarized as follows:
(1) The manufacturing sector had relatively low local content vis-à-vis primary industry and non-tradable goods and services. Among all industries, the electronics and automotive industries had respectively the largest decline and the largest rise in local content in the period 1990-2000.
(2) In the manufacturing sector, all countries other than Singapore had reduced local content. This was primarily due to trade structural changes. Regarding import content, although Japan and the U.S. remained key suppliers of intermediate inputs, diversion of import shares from Japan and the U.S. to East Asian countries was observed in the manufacturing sector. Similar tendencies (especially diversion from Japan) were more clearly demonstrated in the electronics and automotive sectors. (3) Value added-based local content of the manufacturing sector was 6.7% to 14.9%
lower than direct input-based local content. In other words, direct input-based local content, which were adopted in the RoO in FTAs, led to an overestimate of the real local content. Similarly, the real import content from ASEAN countries was also generally overestimated, while direct input-based import content led to an underestimate of the real dependency on Japan and the U.S.
(4) Due to a decline in local content in the 1990’s, local content of the electronics sectors in 2000 was below 40% in the Philippines, Thailand, and Malaysia, although their ASEAN and ASEAN-China cumulative local content exceeded this threshold. At the same time, the procurement of electronics parts and components was diversified. They thus had fairly large dependency on East Asian countries as well as on Japan
and the U.S.
(5) Due to a rise in local content in the 1990’s, the local content of the automotive sector in Korea, China, Indonesia, and Taiwan exceeded 80% to 90% in 2000. In addition, dependency on Japan was quite large, although this dependency had fallen sharply in the 1990’s.
(6) The trend of local content over the period 1990-2000 in the electronics and automotive sectors can be explained by looking at the characteristics of parts and components in each industry as well as industrial policies in East Asia. BBC and the AICO schemes in ASEAN also seem to have helped increase procurement of automotive parts and components from neighboring ASEAN countries.
(7) Use of the cumulation rule in AFTA and the ASEAN-China FTA tends to increase local content of industry when said industry has large import content from other FTA member countries. For example, the cumulation rule increased local content of the electronics industry more significantly than local content of the automotive industry. Due to rising dependency on neighboring ASEAN countries and China, the contribution of the cumulation rule increased in the 1990’s. This trend is further expected to accelerate as trade barriers in East Asia continue to be removed due to the implementation of FTAs and other trade facilitation arrangements.
Technical Note
Decomposition Analysis of Local Content
In decomposition analysis, using input-output tables for two points of time, factors which have affected output, value added, balance of payments, etc., can be found for each industry. Decomposition analysis was applied in this study. International input-output tables were used to investigate the factors of change in local content. 1. Direct Input-Based Decomposition Analysis
In decomposition analysis of direct input-based local content, changes in local content are decomposed into three factors: (1) a change in value added coefficients, (2) a change in trade structure, and (3) a change in technology. The first factor is found by the following simple formula:
v
v
v
=
t+−
tΔ
1 (11)is found by a change in input coefficient matrices between two points in time:
A
A
A
Δ
=
t+1−
t (12)where , and denotes the amount of Commodity i produced in Country
R and needed by Country S per each unit output of Commodity j. Next, using data
obtainable from the international input-output tables, an input coefficient may be expressed as a product of the following two coefficients:
]
[
a
ijRS=
A
a
ijRSa
RSij 17a
t
a
Sij RS ij RS ij=
&
~
(13) wherea
S ij~
represents a “technological input coefficient” denoting the sum of domesticand imported Commodity i needed by Country S per unit output of Commodity j. A “trade coefficient” reflects which fraction of intermediate demand for Commodity i
exercised by Sector j in Country S is satisfied by Country R (import share of Country R).
t
&
ijRSAlternatively, Equation (13) may be expressed in matrix form:
A
T
A
=
&
⊗
~
(14) where[
t
RS]
, ij&
&
=
T
A
~
=
[
a
~
ijS]
, and⊗
stands for the Hadamard product (cell by cellmultiplication).
Substituting Equations (14) into (12) yields the following:
A
Δ
T
A
T
Δ
A
T
A
T
A
T
A
T
A
T
A
T
A
Δ
~
~
~
~
~
~
~
~
1 1 1 1 1 1 1⊗
+
⊗
=
⊗
−
⊗
+
⊗
−
⊗
=
⊗
−
⊗
=
+ + + + + + +&
&
&
&
&
&
&
&
t t t t t t t t t t t t t t . (15) Alternatively, Equation (12) may be written asA
T
Δ
A
Δ
T
A
Δ
=
&
t+1⊗
~
+
&
⊗
~
t. (16)17 See Hoen (2000, p. 138) for the technique of decomposition analysis, especially that of international input-output. Hoen provides an illuminating example of this technique. Although he employed the technique for a different purpose, some of the techniques used in this study were also used in his.
Averaging Equations (15) and (16) gives
)
)
(
2
1
)
(
2
1
~
~
~
1 1A
Δ
T
T
A
A
T
Δ
A
Δ
⊗
+
+
+
⊗
=
+ +&
&
&
t t t t (17) where the first and second terms show respectively an impact of the above mentioned Factor 2, a change in trade structure (change in trade coefficients or import shares ), and Factor 3, a change in technology (change in technological input coefficientsT
Δ &
A
Δ ~
).2. Value-Added-Based Decomposition Analysis
Decomposition of value added-based local content is more complicated, but a similar technique can be employed. A change in an element in Matrix in Equation (8) can be expressed as follows:
Γ
L
Δ
V
V
L
L
V
Δ
L
V
L
V
Γ
Γ
Γ
Δ
)
(
2
1
)
(
2
1
t 1 t t 1 t t t 1 t 1 t t 1 tˆ
ˆ
ˆ
ˆ
ˆ
+
+
+
=
−
=
−
=
+ + + + + (18) where is a diagonal value added coefficient matrix at time t, ,, and