Alcohol consumption and cognitive function in
elderly Japanese men.
著者
SIDDIQUEE Ali Tanweer, KADOTA Aya, FUJIYOSHI
Akira, MIYAGAWA Naoko, SAITO Yoshino, SUZUKI
Harumitsu, KONDO Keiko, YAMAUCHI Hiromi, ITO
Takahiro, SEGAWA Hiroyoshi, TOOYAMA Ikuo,
MIURA Katsuyuki, UESHIMA Hirotsugu
journal or
publication title
Alcohol (Fayetteville, N.Y.)
volume
85
page range
145-152
year
2020-06
URL
http://hdl.handle.net/10422/00012676
doi: 10.1016/j.alcohol.2020.01.001(https://doi.org/10.1016/j.alcohol.2020.01.001)
Alcohol consumption and cognitive function in elderly
Japanese men
Abstract
Although heavy alcohol consumption has been identified as a risk factor for adverse cognitive functioning, it currently remains unclear whether moderate alcohol consumption exerts similar effects. Observational studies previously reported the potential benefits of moderate alcohol consumption on cognition, particularly in the elderly; however, these effects have not yet been demonstrated in Asian populations. The aim of the present study was to investigate the relationship between alcohol consumption levels and global and domain-specific cognitive functions in cognitively intact elderly Japanese men. Cross-sectional data from the Shiga Epidemiological Study of Subclinical Atherosclerosis (SESSA), an ongoing prospective, population-based study in Shiga, Japan, were used to examine the relationship between alcohol consumption and cognitive function. Men (n = 585) aged ≥65 years provided information on their weekly consumption of alcohol, and the data obtained were used to construct categories of never, ex- (quit before interview), very light (<14 g/day), light (14–23 g/day), moderate (>23–46 g/day), and heavy (>46 g/day) drinkers. Cognitive function was measured using the Cognitive Abilities Screening Instrument (CASI). A fractional logistic regression model adjusted for age, education, body mass index, smoking, exercise, hypertension, diabetes, and dyslipidemia showed that the CASI scores for global and domain-specific cognitive functions were not significantly different between all subgroups of current drinkers and never-drinkers. However, the CASI score of ex-drinkers (multivariable adjusted mean CASI score [SD]) was significantly lower Ali Tanweer Siddiqueea, Aya Kadotaa,b, [email protected], Akira Fujiyoshia,c, Naoko Miyagawab,d, Yoshino Saitob, Harumitsu Suzukic, Keiko Kondob, Hiromi Yamauchia, Takahiro Itob, Hiroyoshi Segawaa, Ikuo Tooyamae, Katsuyuki Miuraa,b, Hirotsugu Ueshimaa,b, for the SESSA Research Group
aCenter for Epidemiologic Research in Asia, Shiga University of Medical Science, Otsu, Japan bDepartment of Public Health, Shiga University of Medical Science, Otsu, Japan
cDepartment of Hygiene, School of Medicine, Wakayama Medical University, Kimiidera, Japan
dInternational Center for Nutrition and Information, National Institute of Biomedical Innovation, Health and
Nutrition, Shinjuku-ku, Tokyo, Japan
eMolecular Neuroscience Research Center, Shiga University of Medical Science, Otsu, Japan
Corresponding author. Department of Public Health, Shiga University of Medical Science, Seta Tsukinowa-cho, Otsu, Shiga, 520-2192, Japan. Fax: +81 77 543 4800.
than that of never-drinkers in the global [never vs. ex: 90.16 (2.21) vs. 88.26 (2.58)] and abstraction and judgment domains [never vs. ex: 9.48 (0.46) vs. 8.61 (0.57)]). The present results do not suggest any beneficial or adverse relationship between current alcohol consumption levels and cognitive functioning (both global and domain specific) in elderly Japanese men; however, low cognitive function among ex-drinkers warrants future investigations to identify the factors causing drinkers to quit.
Keywords
: Alcohol; Cognitive function; Elderly; General population; JapaneseIntroduction
While most diseases causally impacted by alcohol consumption have a dose–response relationship (Rehm et al., 2010), this relationship remains unclear for cognitive decline (Sabia et al., 2014) and dementia (Sabia et al., 2018; Schwarzinger, Pollock, Hasan, Dufouil, & Rehm, 2018). Heavy alcohol consumption is a leading modifiable risk factor for cognitive decline and dementia; however, the overall relationship remains ambiguous due to the potential protective effects of moderate alcohol consumption on cognitive function (Xu et al., 2017). Moreover, the amount of alcohol consumed may have different effects on global and domain-specific cognitive functions (Topiwala et al., 2017). Observational studies proposed a J- or U-shaped relationship between alcohol consumption and cognitive impairment in the elderly in Western countries, indicating the potential beneficial effects of moderate alcohol consumption over no drinking (Lobo et al., 2010; Lyu & Lee, 2012; Reas, Laughlin, Kritz-Silverstein, Barrett-Connor, & McEvoy, 2016; Sabia et al., 2018). However, limited information is currently available on the relationship between alcohol consumption and cognitive functioning in Asian populations. In contrast to findings obtained in Western countries, no beneficial cognitive functioning or protective effects against cognitive decline have been associated with moderate alcohol consumption in Asian populations (Au Yeung et al., 2012; Ge et al., 2018; Lyu & Lee, 2014; Sun et al., 2018). However, these studies did not define a similar standard volume for moderate alcohol consumption or did not comprehensively assess cognitive function by including all domain-specific abilities.
The aim of the present study was to investigate the relationship between alcohol consumption and cognitive scores among cognitively intact (clinically) elderly Japanese men. We hypothesized that moderate alcohol consumption may be associated with better cognitive functioning than that in never-drinkers. To elucidate the relationship between alcohol consumption and cognitive functioning, global and domain-specific cognitive functions were examined.
Materials and methods
Study population and setting
We conducted a cross-sectional study from the Shiga Epidemiological Study of Subclinical Atherosclerosis (SESSA), which is an ongoing prospective, population-based study in Kusatsu, Japan. Between 2006 and 2008, 2379 Japanese men between 40 and 79 years of age were randomly selected based on age strata and invited to participate in the study, with 1094 participating at baseline (Fujiyoshi et al., 2016). The baseline study did not include cognitive function testing; however, in a follow-up between the years 2012 and 2015, 816 male participants underwent cognitive screening (participation rate of 75%) using the Cognitive Abilities Screening Instrument (CASI), and 814 had complete CASI data. After excluding men who were younger than 65 years (n = 213), cognitively impaired (n = 12), and missing data (n = 4), 585 participants were eligible to be included
in the present study. All participants provided written informed consent and the present study was approved by the Institutional Review Board of Shiga University of Medical Science.
Cognitive assessment
The CASI (Version J-1.0) was applied to measure the cognitive function of participants by trained interviewers. The CASI was designed for use in cross-cultural studies on Japanese and Japanese-American elderly individuals and has also been tested for differential item functioning related to a test language (Gibbons et al., 2009). It is one of only a few screens that has robust validity in community samples and elicits information on all key cognitive domains (Cullen, O'Neill, Evans, Coen, & Lawlor, 2007). The CASI is a 40-item test of cognitive functioning and has a score range of 0–100, with higher scores reflecting better performance. A CASI score <74 indicates cognitive impairment (Galanis et al., 2000). All the interviews were conducted using an examination sheet that was designed to enhance adherence to the original protocol. Three raters (Akira Fujiyoshi, Naoko Miyagawa, and Yoshino Saito) independently assessed CASI scores based on the recorded responses of the participants. The raters gave feedback as needed to a trained interviewer to keep consistency of the interview. In case of an uncertainty in rating, the three raters discussed and adjudicated. The intraclass correlation coefficient across the raters was 0.977 based on a recorded sample of 20 participants. We excluded participants with a CASI score <74 because data on alcohol consumption from these participants may not have been valid.
In addition to global cognitive function score, CASI also provides quantitative assessments on attention (score range of 0–8), concentration (score range of 0–10), orientation (score range of 0–18), short-term memory (score range of 0–12), long-term memory (score range of 0–10), language abilities (score range of 0–10), visual construction (score range of 0–10), list-generating fluency (score range of 0–10), and abstraction and judgment (score range of 0–12) (Teng et al., 1994).
Classification of alcohol consumption
Information on alcohol consumption was acquired from a self-reported questionnaire. We categorized drinking status into three groups: never, ex-, and current drinkers. “Never-drinkers” were respondents who answered that they had never drunk alcohol, “ex-drinkers” used to drink before, but had already quit before the interview, and “current drinkers” had drunk alcohol in the past week or month. Current drinkers were asked how frequently they drank in a typical week (for those who drank ≥ once per week) or month (for those who drank less than once per week, but more than once per month).
Detailed alcohol consumption data were collected among current drinkers by asking the type (e.g., wine and beer), number (e.g., number of beer cans), and portion size of alcohol consumed. We then calculated ethanol consumption per week (g/week) using the following conversion equation:
We used the ethanol concentration provided by the Japan Ministry of Health, Labour and Welfare source. Mean ethanol consumption per day was calculated from ethanol consumption per week. Based on the average amount of ethanol per day, we categorized current drinkers into very light (<14 g/day), light (14–23 g/day), moderate Ethanol (g/week) = number of days/week consumed × number consumed × portion size × concentration × density of ethanol to water (constant) + other ethanol
e.g., for beer: Ethanol (g/week) = number of days/week consumed × number of beers × beer bottle size (633/500/350 mL) × 0.05 (concentration) × 0.8 (constant)
(>23–46 g/day), and heavy (>46 g/day). We considered “one drink” (14 g of ethanol), a value equal to a “standard” drink in Western countries, and “gou” (23 g of ethanol), a “standard” drink in Japan, when making these groups (Murakami & Hashimoto, 2019).
Covariate assessment
Data were collected on socio-demographic and lifestyle factors, including smoking (never, ex, and current) and exercise (number of days per week of leisure time physical activity), by a self-administered questionnaire. Medical histories of hypertension and diabetes were recorded along with corresponding medication use. Height and weight were measured. Body mass index (BMI) was calculated as weight (kg) divided by height squared (m2). We also measured blood pressure using an automated sphygmomanometer (BP-8800; Omron Health Care Co., Ltd., Tokyo, Japan). The mean of two consecutive measurements on the right arm with participants in a seated position after a 5-min rest was used as the blood pressure value. We defined hypertension as systolic blood pressure (SBP) ≥140 mmHg, diastolic blood pressure (DBP) ≥90 mmHg, and/or receiving antihypertensive medication. Blood samples were collected for fasting blood sugar, hemoglobin A1c (HbA1c), and serum lipids. Diabetes mellitus was defined as HbA1c ≥ 6.5% in the National Glycohemoglobin Standardization Program (NGSP) (Kashiwagi et al., 2012), fasting blood glucose ≥126 mg/dL, or the use of anti-diabetic medications. Total cholesterol and triglycerides were measured using enzymatic assays, and high-density lipoprotein cholesterol (HDL-C) was assessed using a direct method. Lipid measurements were standardized according to the protocol for the US Centers for Disease Control and Prevention/Cholesterol Reference Method Laboratory Network. Low-density lipoprotein cholesterol (LDL-C) was estimated using the Friedewald formula (it was treated as missing in the case of a triglyceride concentration >400 mg/dL) ( Friedewald, Levy, & Fredrickson, 1972). Dyslipidemia was defined as LDL-C ≥3.6 mmol/L (140 mg/dL), HDL-C <1.0 mmol/L (40 mg/dL), or medication use.
Statistical analysis
The chi-square test and analysis of variance (ANOVA) were used to compare participant characteristics by alcohol consumption groups. We used a fractional logistic regression model to examine whether cognitive scores assessed by the CASI differed according to drinking groups. To apply the fractional logistic model, we divided each CASI score (dependent variable) by 100 (i.e., the proportion of correct responses) and used it as a continuous variable that fell between 0 and 1. In model 1, the CASI (fractions) was a dependent variable and alcohol consumption was an independent variable (never, ex, very light, light, moderate, and heavy categories), and associated coefficients (β) were examined using non-drinkers as a reference category. In model 2, we adjusted for age and education. In model 3, model 2 was further adjusted for smoking, exercise, and BMI, and in model 4, model 3 was further adjusted for hypertension, diabetes, and dyslipidemia. Multivariable-adjusted mean CASI scores for the different drinking categories were also calculated. We performed the same analysis for domain-specific cognitive function. p < 0.05 was considered to be significant. We used SAS software version 9.4 for Windows (SAS Institute Inc., Cary, North Carolina, United States) for all statistical analyses.
Results
The demographic and health characteristics of participants according to the different alcohol consumption categories are shown in Table 1. Among 585 participants, 453 were current drinkers (77%), 96 were never-drinkers (16%), and 36 were ex-never-drinkers (6%). Heavy never-drinkers were younger, whereas ex-never-drinkers were the oldest. Exercise and smoking status significantly differed among the drinking groups. Never-drinkers had the lowest SBP and were the least hypertensive (Table 1). HDL-C and triglycerides significantly differed among the
drinking groups, whereas dyslipidemia did not. HDL-C levels were significantly higher among the light to heavy drinking groups compared to both never- and past drinkers. Triglycerides levels were significantly higher among the heavy drinkers compared to both very light and moderate drinking groups, but were not significantly different from never- or past drinkers. Diabetes did not differ significantly among the drinking groups.
Table 1
Characteristics of study participants (585 men aged ≥65 years) by alcohol consumption levels, 2012–2015, Shiga, Japan. Never-drinker (n = 96) Ex-drinker (n = 36) Current drinker (n = 453) p value b Very lighta (<14 g/day) (n = 175) Lighta (14– 23 g/day) (n = 70) Moderatea (>23–46 g/day) (n = 132) Heavya (>46 g/day) (n = 76) Age, years 72.3 (±4.4) 73.6 (±3.8) 72.3 (±4.4) 72.1 (±3.9) 71.9 (±4.4) 70.3 (±4.2) 0.016 Education, years 12.2 (±2.2) 11.8 (±2.4) 12.8 (±2.4) 12.9 (±2.6) 12.5 (±2.4) 12.6 (±2.3) 0.099 BMI, kg/m2 23.3 (±3.1) 22.9 (±2.6) 23.1 (±2.3) 23.7 (±3.2) 23.0 (±2.4) 23.2 (±2.6) 0.672 SBP, mmHg 129 (±17) 133 (±17) 131 (±15) 132 (±17) 137 (±17) 135 (±18) 0.004 HDL-C, mg/dL 52 (±13.3) 53 (±13.4) 57 (±14.2) 61 (±18.9) 64 (±17.8) 64 (±17.9) <0.001 Triglycerides, mg/dL 106 (75– 130) 104 (72– 132) 99 (69–130) 99 (69–142) 97 (73–140) 123 (80– 176) 0.006 Smoking (%) <0.001 Non 25 (26.0) 3 (8.3) 48 (27.4) 9 (12.9) 24 (18.2) 4 (5.3) Ex 53 (55.2) 27 (75.0) 106 (60.6) 52 (74.3) 80 (60.6) 56 (74.7) Current 18 (18.8) 6 (16.7) 21 (12.0) 9 (12.9) 28 (21.2) 15 (20.0) Exercise, days/week 2.1 (±2.4) 2.6 (±2.9) 2.9 (±2.6) 2.8 (±2.6) 3.4 (±2.8) 2.9 (±2.9) 0.022 Hypertension (%) 17 (17.7) 11 (30.5) 56 (32.0) 26 (37.1) 57 (43.2) 32 (42.1) 0.002 Diabetes (%) 31 (32.3) 11 (30.5) 49 (28.0) 18 (25.7) 24 (18.2) 21 (28.0) 0.223 Dyslipidemia (%) 40 (41.7) 14 (38.9) 71 (40.6) 23 (32.9) 48 (36.4) 24 (31.6) 0.655
Abbreviations: BMI = Body mass index; SBP = Systolic blood pressure; HDL-C = High-density lipoprotein cholesterol. Hypertension: defined as systolic/diastolic blood pressure ≥140/90 mmHg or medication use; diabetes mellitus: defined as HbA1c ≥ 6.5% in the National Glycohemoglobin Standardization Program (NGSP), fasting blood glucose ≥126 mg/dL, or the use of antidiabetic medications; dyslipidemia: defined as LDL-cholesterol ≥3.6 mmol/L (140 mg/dL), HDL-cholesterol <1.0 mmol/L (40 mg/dL), or medication use.
i The table layout displayed in this section is not how it will appear in the final version. The representation below is solely purposed for providing corrections to the table. To preview the actual presentation of the table, please view the Proof.
Table Footnotes
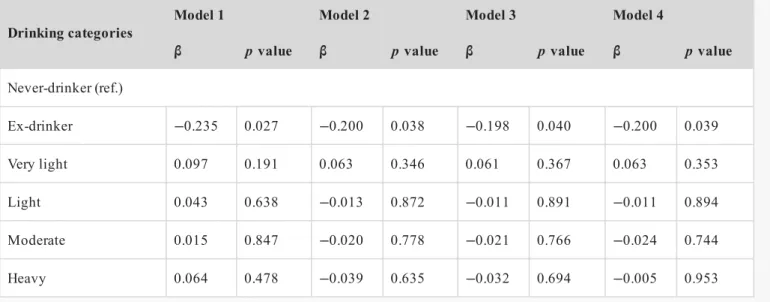
Ex-drinkers had significantly lower cognitive functioning than non-drinkers in the unadjusted model (Model 1: β = −0.235, p = 0.027) (Table 2). These results remained essentially the same when analyses were repeated with additional adjustments for factors related to alcohol drinking or cognitive function, including age and education (Model 2: β = −0.200, p = 0.038) and further adjustments for BMI, smoking, and exercise (Model 3: β = −0.198, p = 0.040), withand a fully adjusted model including hypertension, diabetes, and dyslipidemia (Model 4: β = −0.200, p = 0.039) (Table 2). We also calculated the multivariable adjusted mean (SD) CASI score, which revealed that CASI scores were significantly lower for ex-drinkers than for never-drinkers [never vs. ex in Model 1: 90.05 (4.90) vs. 87.47 (5.24), Model 2: 90.14 (2.21) vs. 88.25 (2.57), Model 3: 90.14 (2.24) vs. 88.24 (2.61) and Model 4: 90.16 (2.21) vs. 88.26 (2.58)] (Table 3). The CASI scores of any subgroup of current drinkers were not significantly different from those of never-drinkers (Table 3). In a sensitivity analysis, we combined very light drinkers and light drinkers into one group, and similar results were obtained (results not shown).
Continuous variables are expressed as means (±standard deviation [SD]), except triglycerides (median [25%–75%]); other values are n (%).
Average alcohol consumption/day. a
Based on an ANOVA for continuous variables and the chi-square test for categorical variables. b
Table 2
Relationship between CASI scores and drinking volumes (fractional logistic regression modela) among 585 men aged ≥65 years.
Drinking categories Model 1 Model 2 Model 3 Model 4
β p value β p value β p value β p value
Never-drinker (ref.) Ex-drinker −0.235 0.027 −0.200 0.038 −0.198 0.040 −0.200 0.039 Very light 0.097 0.191 0.063 0.346 0.061 0.367 0.063 0.353 Light 0.043 0.638 −0.013 0.872 −0.011 0.891 −0.011 0.894 Moderate 0.015 0.847 −0.020 0.778 −0.021 0.766 −0.024 0.744 Heavy 0.064 0.478 −0.039 0.635 −0.032 0.694 −0.005 0.953
Abbreviation: CASI = cognitive ability screening instrument. Model 1: unadjusted.
Model 2: adjusted for age (continuous) and years of education (continuous).
Model 3: Model 2+ adjusted for BMI (continuous), smoking (never, past, current), exercise (number of days per week of leisure time physical activity).
Model 4: Model 3+ hypertension (yes/no), diabetes (yes/no), and dyslipidemia (yes/no).
i The table layout displayed in this section is not how it will appear in the final version. The representation below is solely purposed for providing corrections to the table. To preview the actual presentation of the table, please view the Proof.
Table Footnotes
Table Footnotes
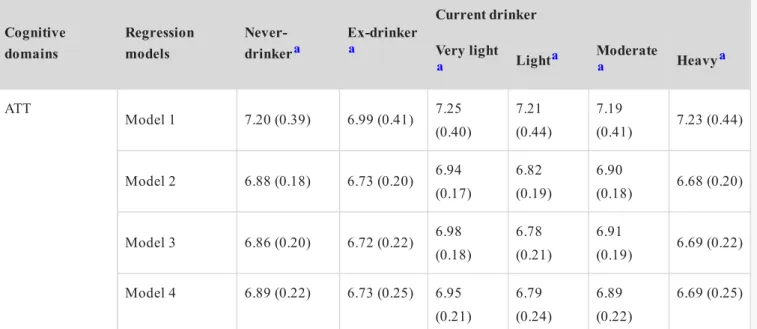
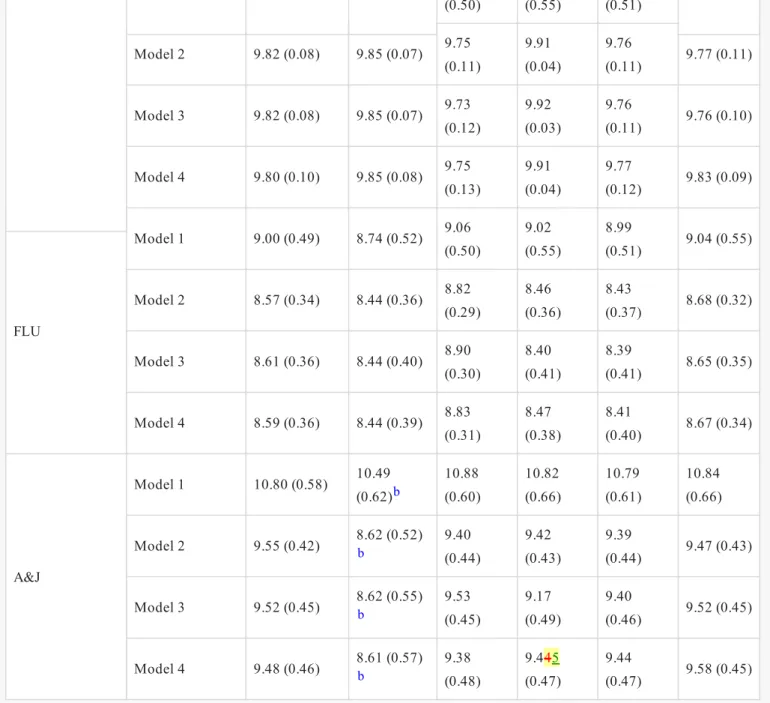
Domain-specific results are shown in Table 4. No correlations associations were observed in any of the CASI domains (attention, concentration, orientation, short-term memory, long-term memory, language abilities, visual construction, list-generating fluency, and abstraction and judgment) among the subgroups of current drinkers and never drinkers. However, in the abstraction and judgment domain, cognitive functioning was significantly lower for ex-drinkers than for never-drinkers in all four models (Model 1: β = −0.465, p = 0.003; Model 2: β = −0.426, p = 0.005; Model 3: β = −0.413, p = 0.005; Model 4: β = −0.395, p = 0.009) (Table 4). We also calculated the multivariable adjusted mean (SD) score of all domains by drinking categories (Table 5). Abstraction and judgment domain scores were significantly lower for ex-drinkers than for never-drinkers, as shown in Table 5 [never vs. ex, expressed as means (SD) in Model 1: 10.80 (0.58) vs. 10.49 (0.62), Model 2: 9.55 (0.42) vs. 8.62 (0.52), Model 3: 9.52 (0.45) vs. 8.62 (0.55), Model 4: 9.48 (0.46) vs. 8.61 (0.57)].
Fractions of CASI score (between 0 and 1) by dividing each CASI score by 100, were assigned as dependent variable in the fractional logistic regression model.
a
Table 3
Multivariable adjusted mean (SD) CASI scores by drinking volumes among 585 men aged ≥65 years.
Regression models Never-drinkera Ex-drinkera Current drinker
Very lighta Lighta Moderatea Heavya Model 1 90.05 (4.90) 87.47 (5.24)b 90.68 (5.05) 90.21 (5.56) 89.95 (5.13) 90.40 (5.51) Model 2 90.14 (2.21) 88.25 (2.57)b 90.68 (2.10) 90.04 (2.23) 89.96 (2.24) 89.81 (2.27) Model 3 90.14 (2.24) 88.24 (2.61)b 91.04 (2.05) 89.47 (2.37) 89.95 (2.27) 89.83 (2.30) Model 4 90.16 (2.21) 88.26 (2.58)b 90.69 (2.10) 90.05 (2.23) 89.91 (2.26) 90.08 (2.28) Abbreviations: SD = standard deviation; CASI = cognitive ability screening instrument.
Model 1: unadjusted.
Model 2: adjusted for age (continuous) and years of education (continuous); Model 3: Model 2+ adjusted for BMI (continuous), smoking (never, past, current), exercise (number of days per week of leisure time physical activity);
Model 4: Model 3+ hypertension (yes/no), diabetes (yes/no), and dyslipidemia (yes/no).
i The table layout displayed in this section is not how it will appear in the final version. The representation below is solely purposed for providing corrections to the table. To preview the actual presentation of the table, please view the Proof.
Values are presented as means (SD). a
Significantly lower than ‘Never-drinker’ by a multivariable adjusted fractional logistic regression model (p < 0.05). b
Table 4
Relationship between domain-specific CASI scores and drinking volumes (fractional logistic regression modela,b) among 585 men aged ≥65 years.
Current drinker
Ex-drinker Very Light Light Moderate Heavy
β p value β p value β p value β p value β p value
ATT Model 1 −0.182 0.336 0.097 0.457 −0.015 0.927 0.050 0.736 −0.118 0.438 Model 2 −0.150 0.425 0.065 0.618 −0.060 0.702 0.019 0.889 −0.190 0.212 Model 3 −0.138 0.465 0.120 0.367 −0.088 0.551 0.048 0.725 −0.167 0.280 Model 4 −0.162 0.392 0.069 0.596 −0.102 0.526 0.003 0.980 −0.194 0.220 CCT Model 1 −0.223 0.398 −0.033 0.853 −0.134 0.540 0.084 0.666 0.272 0.245 Model 2 −0.170 0.510 −0.085 0.632 −0.216 0.311 0.038 0.843 0.128 0.577 Model 3 −0.207 0.422 −0.007 0.967 −0.298 0.139 0.029 0.878 0.105 0.652 Model 4 −0.242 0.352 −0.096 0.592 −0.285 0.190 −0.053 0.790 0.068 0.776 ORT Model 1 −0.232 0.642 0.230 0.529 −0.023 0.957 −0.160 0.655 −0.470 0.213 Model 2 −0.236 0.639 0.237 0.520 −0.019 0.965 −0.165 0.647 −0.505 0.188 Model 3 −0.250 0.621 0.337 0.390 −0.253 0.528 −0.265 0.472 −0.521 0.189 Model 4 −0.280 0.584 0.130 0.729 −0.198 0.658 −0.384 0.308 −0.638 0.116 LTM Model 1 −0.310 0.782 −0.232 0.765 1.053 0.466 −0.108 0.897 −0.954 0.229 Model 2 −0.291 0.794 −0.250 0.746 1.026 0.475 −0.125 0.880 −0.998 0.210 Model 3 −0.089 0.932 −0.226 0.754 1.455 0.278 0.1828 0.815 −0.688 0.360 Model 4 −0.011 0.991 −0.069 0.925 1.388 0.307 0.219 0.790 −0.446 0.574 STM Model 1 −0.290 0.095 0.252 0.037 0.160 0.284 0.083 0.509 0.122 0.400 Model 2 −0.246 0.137 0.209 0.069 0.088 0.537 0.036 0.763 −0.022 0.871 Model 3 −0.230 0.162 0.222 0.057 0.077 0.563 0.043 0.715 −0.019 0.887 Model 4 −0.235 0.154 0.198 0.085 0.096 0.501 0.027 0.824 0.016 0.909 LAN Model 1 0.357 0.508 0.142 0.652 0.760 0.154 0.561 0.129 0.569 0.197 Model 2 0.335 0.517 0.147 0.627 0.605 0.180 0.510 0.150 0.272 0.522 Model 3 0.332 0.520 0.224 0.474 0.264 0.495 0.458 0.202 0.202 0.637 Model 4 0.354 0.506 0.163 0.605 0.632 0.177 0.502 0.183 0.333 0.469 VC Model 1 0.099 0.886 −0.297 0.470 0.772 0.262 −0.251 0.564 −0.073 0.886 Model 2 0.156 0.811 −0.347 0.374 0.672 0.302 −0.310 0.452 −0.283 0.562
solely purposed for providing corrections to the table. To preview the actual presentation of the table, please view the Proof.
Table Footnotes Model 3 0.148 0.817 −0.447 0.245 0.848 0.185 −0.340 0.406 −0.314 0.516 Model 4 0.250 0.682 −0.264 0.472 0.816 0.180 −0.164 0.681 0.159 0.754 FLU Model 1 −0.129 0.619 0.250 0.166 −0.035 0.869 −0.077 0.673 0.224 0.312 Model 2 −0.102 0.696 0.227 0.210 −0.086 0.690 −0.115 0.527 0.093 0.675 Model 3 −0.130 0.617 0.278 0.134 −0.166 0.408 −0.169 0.3564 0.038 0.862 Model 4 −0.119 0.653 0.218 0.234 −0.095 0.665 −0.144 0.449 0.071 0.757 A&J Model 1 −0.465 0.003 −0.028 0.798 −0.009 0.945 −0.051 0.652 0.019 0.888 Model 2 −0.426 0.005 −0.073 0.488 −0.066 0.613 −0.080 0.464 −0.040 0.756 Model 3 −0.413 0.005 0.003 0.977 −0.172 0.153 −0.061 0.583 0.0003 0.998 Model 4 −0.395 0.009 −0.051 0.630 −0.018 0.892 −0.022 0.850 0.051 0.702
Abbreviations: CASI = cognitive ability screening instrument; ATT = attention; CCT = concentration; ORT = orientation; LTM = long-term memory; STM = short-term memory; LAN = language; VC = visual construction; FLU = fluency; A&J = abstraction and judgment.
Model 1: unadjusted.
Model 2: adjusted for age (continuous) and years of education (continuous); Model 3: Model 2+ adjusted for BMI (continuous), smoking (never, past, current), exercise (number of days per week of leisure time physical activity);
Model 4: Model 3+ hypertension (yes/no), diabetes (yes/no), and dyslipidemia (yes/no).
Fractions of domain-specific CASI scores, made by dividing by the upper range of the respective domains, were assigned as the dependent variable in the fractional logistic regression model.
a
Reference group is ‘Never-drinker’. b
Table 5
Multivariable adjusted mean (SD) domain-specific CASI scores by drinking volumes among 585 men aged ≥65 years. Cognitive domains Regression models Never-drinkera Ex-drinker a Current drinker Very light
a Lighta Moderatea Heavya
ATT Model 1 7.20 (0.39) 6.99 (0.41) 7.25 (0.40) 7.21 (0.44) 7.19 (0.41) 7.23 (0.44) Model 2 6.88 (0.18) 6.73 (0.20) 6.94 (0.17) 6.82 (0.19) 6.90 (0.18) 6.68 (0.20) Model 3 6.86 (0.20) 6.72 (0.22) 6.98 (0.18) 6.78 (0.21) 6.91 (0.19) 6.69 (0.22) Model 4 6.89 (0.22) 6.73 (0.25) 6.95 (0.21) 6.79 (0.24) 6.89 (0.22) 6.69 (0.25) i The table layout displayed in this section is not how it will appear in the final version. The representation below is
solely purposed for providing corrections to the table. To preview the actual presentation of the table, please view the Proof.
CCT Model 1 9.00 (0.49) 8.74 (0.52) 9.06 (0.50) 9.02 (0.55) 8.99 (0.51) 9.04 (0.55) Model 2 8.90 (0.35) 8.73 (0.40) 8.82 (0.37) 8.68 (0.41) 8.94 (0.34) 9.02 (0.32) Model 3 8.90 (0.39) 8.69 (0.45) 8.90 (0.39) 8.59 (0.48) 8.93 (0.38) 9.00 (0.36) Model 4 8.94 (0.40) 8.70 (0.47) 8.85 (0.43) 8.65 (0.49) 8.89 (0.41) 9.00 (0.38) ORT Model 1 16.20 (0.88) 15.74 (0.94) 16.32 (0.91) 16.23 (1.00) 16.19 (0.92) 16.27 (0.99) Model 2 17.73 (0.02) 17.66 (0.02) 17.79 (0.01) 17.73 (0.02) 17.68 (0.02) 17.56 (0.03) Model 3 17.75 (0.08) 17.68 (0.10) 17.82 (0.05) 17.67 (0.10) 17.67 (0.10) 17.58 (0.13) Model 4 17.76 (0.09) 17.69 (0.12) 17.79 (0.08) 17.71 (0.11) 17.65 (0.13) 17.56 (0.17) LTM Model 1 9.00 (0.49) 8.74 (0.52) 9.06 (0.50) 9.02 (0.55) 8.99 (0.51) 9.04 (0.55) Model 2 9.95 (0.004) 9.94 (0.006) 9.94 (0.005) 9.98 (0.001) 9.95 (0.005) 9.89 (0.012) Model 3 9.95 (0.03) 9.94 (0.03) 9.93 (0.03) 9.98 (0.007) 9.95 (0.02) 9.90 (0.05) Model 4 9.94 (0.04) 9.94 (0.05) 9.94 (0.05) 9.98 (0.01) 9.95 (0.03) 9.91 (0.07) STM Model 1 10.80 (0.58) 10.49 (0.62) 10.88 (0.60) 10.82 (0.66) 10.79 (0.61) 10.84 (0.66) Model 2 8.96 (0.77) 8.39 (0.85) 9.40 (0.69) 9.15 (0.74) 9.04 (0.76) 8.91 (0.78) Model 3 8.95 (0.78) 8.42 (0.86) 9.42 (0.70) 9.12 (0.76) 9.05 (0.77) 8.91 (0.79) Model 4 8.97 (0.78) 8.42 (0.86) 9.38 (0.71) 9.17 (0.75) 9.03 (0.77) 9.00 (0.78) LAN Model 1 9.00 (0.49) 8.74 (0.52) 9.06 (0.50) 9.02 (0.55) 8.99 (0.51) 9.04 (0.55) Model 2 9.73 (0.16) 9.81 (0.12) 9.77 (0.14) 9.85 (0.09) 9.84 (0.10) 9.79 (0.12) Model 3 9.74 (0.16) 9.81 (0.12) 9.79 (0.13) 9.80 (0.13) 9.83 (0.10) 9.79 (0.13) Model 4 9.73 (0.17) 9.81 (0.12) 9.77 (0.14) 9.85 (0.09) 9.83 (0.10) 9.80 (0.12)
Table Footnotes
Discussion
In this cross-sectional study on elderly Japanese men, no relationships were observed between alcohol consumption levels and global and domain-specific cognitive functioning. However, the global CASI score and abstraction and judgment domain score were significantly lower for ex-drinkers than for never-drinkers. To the best of our knowledge, this cross-sectional population-based study is the first in Japan to examine the relationship between alcohol consumption levels and cognitive functioning among elderly Japanese men.
VC Model 1 9.00 (0.49) 8.74 (0.52) 9.06 (0.50) 9.02 (0.55) 8.99 (0.51) 9.04 (0.55) Model 2 9.82 (0.08) 9.85 (0.07) 9.75 (0.11) 9.91 (0.04) 9.76 (0.11) 9.77 (0.11) Model 3 9.82 (0.08) 9.85 (0.07) 9.73 (0.12) 9.92 (0.03) 9.76 (0.11) 9.76 (0.10) Model 4 9.80 (0.10) 9.85 (0.08) 9.75 (0.13) 9.91 (0.04) 9.77 (0.12) 9.83 (0.09) FLU Model 1 9.00 (0.49) 8.74 (0.52) 9.06 (0.50) 9.02 (0.55) 8.99 (0.51) 9.04 (0.55) Model 2 8.57 (0.34) 8.44 (0.36) 8.82 (0.29) 8.46 (0.36) 8.43 (0.37) 8.68 (0.32) Model 3 8.61 (0.36) 8.44 (0.40) 8.90 (0.30) 8.40 (0.41) 8.39 (0.41) 8.65 (0.35) Model 4 8.59 (0.36) 8.44 (0.39) 8.83 (0.31) 8.47 (0.38) 8.41 (0.40) 8.67 (0.34) A&J Model 1 10.80 (0.58) 10.49 (0.62)b 10.88 (0.60) 10.82 (0.66) 10.79 (0.61) 10.84 (0.66) Model 2 9.55 (0.42) 8.62 (0.52)b 9.40 (0.44) 9.42 (0.43) 9.39 (0.44) 9.47 (0.43) Model 3 9.52 (0.45) 8.62 (0.55)b 9.53 (0.45) 9.17 (0.49) 9.40 (0.46) 9.52 (0.45) Model 4 9.48 (0.46) 8.61 (0.57)b 9.38 (0.48) 9.445 (0.47) 9.44 (0.47) 9.58 (0.45) Abbreviations: SD = standard deviation; CASI = cognitive ability screening instrument; ATT = attention; CCT = concentration; ORT = orientation; LTM = long-term memory; STM = short-term memory; LAN = language; VC = visual construction; FLU = fluency; A&J = abstraction and judgment.
Model 1: unadjusted.
Model 2: adjusted for age (continuous) and years of education (continuous); Model 3: Model 2+ adjusted for BMI (continuous), smoking (never, past, current), exercise (number of days per week of leisure time physical activity).
Model 4: Model 3+ hypertension (yes/no), diabetes (yes/no), and dyslipidemia (yes/no).
Values are presented as means (SD). a
Significantly lower than ‘Never-drinker’ by a multivariable adjusted fractional logistic regression model (p < 0.05). b
While the majority of studies conducted to date that investigated the relationship between cognitive scores and alcohol consumption levels used a general linear model (GLM), we herein used a fractional logistic regression model, which is methodologically more robust in this context (Papke & Wooldridge, 1996). The bounded nature of almost all the batteries and screening tools used to measure cognitive function makes it theoretically inappropriate to be used as an outcome variable for volume of alcohol as an independent variable because it may result in predictions falling outside the boundary when GLM is applied. In contrast, a fractional logistic model avoids predictions falling outside the CASI score ranging between 0 and 100.
Consistent with previous findings, including those on Asian populations, the present results revealed that cognitive performance was not better with moderate alcohol consumption (Au Yeung et al., 2012; Dufouil, Ducimetière, & Alpérovitch, 1997; Ge et al., 2018; Lyu & Lee, 2014; Sun et al., 2018). However, a considerable number of previous studies reported that light to moderate alcohol consumption in older adults was associated with a lower risk of dementia than that in abstainers in Western populations (Lobo et al., 2010; Lyu & Lee, 2012; Reas et al., 2016; Sabia et al., 2018). The potential beneficial effects of moderate drinking may have been observed in studies that included abstainers with ex-drinkers, who might be considered ‘sick quitters’ (Bond et al., 2005; Lobo et al., 2010). In the present study, we separated ex- and never-drinkers to prevent contamination and also adjusted for common chronic conditions. Although, few studies that excluded ex-drinkers from the reference group of never-ex-drinkers still observed the protective effects of moderate alcohol consumption after adjustments for social and lifestyle factors (Belmadani, Kumar, Schipma, Collins, & Neafsey, 2004; Golde, 2003; Lau, Ioannidis, Terrin, Schmid, & Olkin, 2006). However, more recent studies lack to report such findings after separating ex-drinkers from never drinkers. Another possible reason for the positive relationship between moderate alcohol consumption and better cognition is the inclusion of alcohol consumption data from cognitively impaired participants. Self-reported alcohol data from the cognitively impaired may not be valid (Lyu & Lee, 2012; Reas et al., 2016). In the present study, we excluded those who were cognitively impaired in order to ensure that alcohol consumption data were valid. Previous studies that reported potential beneficial effects may not have controlled for important confounding factors, such as physical activity and BMI, which are markers of moderation of lifestyle associated with moderate alcohol consumption (Dufouil et al., 1997 ). Furthermore, other studies emphasized the importance of controlling for factors including the socioeconomic status, prior intelligence, and educational levels of participants, which may influence alcohol intake behavior ( Cooper et al., 2009; Corley et al., 2011). In the present study, although we adjusted for years of education, the residual confounding effects of other social and lifestyle factors cannot be ruled out.
Although heavy drinking is consistently reported to be a risk factor for cognitive decline and dementia in older adults (Neafsey & Collins, 2011; Topiwala et al., 2017), we did not obtain any evidence of low cognitive functioning among heavy drinkers. The reason for this may be that heavy drinkers were younger than the other groups in our sample. However, this effect persisted after controlling for age. Furthermore, the cut-off value used for heavy drinking in the present study (>46 g/day) was slightly lower than that used in a previous study (Bond et al., 2005). The effect of alcohol on cognition also depends on an individual's genetically influenced alcohol processing capacity, such that individuals with higher genetic ability to process alcohol show better cognitive ability with higher levels of consumption (Ritchie et al., 2014). A large proportion of Asian populations including Japan are known to have a genetically polymorphic aldehyde dehydrogenase (ALDH) enzyme that is deficient and fails complete regular alcohol metabolism, making these populations more vulnerable to alcohol's adverse effects (Zakhari, 2006). Although a Mendelian randomization study (using ALDH2 genotype as an instrumental variable) in southern Chinese men did not find any significant difference in cognitive functioning in
individuals with lower genetic propensity to metabolize alcohol to those with normal metabolic ability (Au Yeung et al., 2012), our present study is unable to test such a hypothesis due to lack of genetic data.
The present result showing significantly lower cognitive function among ex-drinkers is consistent with previous findings (Horvat et al., 2015; Lyu & Lee, 2014). Low cognitive functioning among ex-drinkers may have been confounded by poor health. Alcohol intake is a risk factor for hypertension among the Japanese population ( Nakamura et al., 2007), and hypertension is also associated with subclinical findings in the brain, such as silent brain infarction, white matter lesions, and brain atrophy (Debette et al., 2011; Nakanishi et al., 2019). In the present study, adjustments for diagnosed chronic conditions, such as hypertension, diabetes, and dyslipidemia, had little effect on the association of low cognitive functioning among ex-drinkers. However, we did not control for other factors that may affect alcohol intake behavior, such as stroke or depression. Furthermore, the reverse causality phenomenon cannot be completely ruled out.
In the present study, similar results were obtained for global and domain-specific cognitive function. No relationships were observed among any of the domain cognitive scores and the amount of alcohol consumed by current drinkers. This result is consistent with the findings of a previous study that investigated the relationship between alcohol consumption and two unique domains of cognition (fluid intelligence and crystallized intelligence); none of the domains was associated with non-excessive or excessive drinking in men (Lyu & Lee, 2012). However, another study reported lower cognitive scores in phonemic fluency, but not semantic fluency, among more frequent drinkers (Gross et al., 2011). In the present study, scores in the abstraction and judgment domain were lower for ex-drinkers than for never-drinkers. Since ex-drinkers in the present study were the oldest among all study participants, some initial deterioration may have only been observed in abstraction and judgment, which are closely associated with executive function and sensitive to age-associated early cognitive decline (Belmadani et al., 2004). Alternatively, previous findings suggest that some executive deficits are more resistant than other cognitive abilities to recovery even after the cessation of heavy drinking (Mann, Günther, Stetter, & Ackermann, 1999; Zinn, Stein, & Swartzwelder, 2004). The low score in the abstraction and judgment domain among ex-drinkers in the present study may indicates that they had been long-term heavy drinkers before quitting, which resulted in some impairment in these domains. However, we did not obtain sufficient information to examine this hypothesis in our data set. Additionally, lack of sufficient evidence from recent studies limits us to substantiate on this hypothesis.
The present study has some limitations. We did not obtain data on the amount of alcohol previously consumed by ex-drinkers, and the amount of binge drinking in the current drinkers. Furthermore, our alcohol data were generated from self-reported measures that typically underestimate actual consumption (Stockwell et al., 2004). In addition, since this was a cross-sectional study, changes in cognitive function, particularly executive function ability, may have affected alcohol consumption, creating a spurious association or bias toward the null. Another limitation is that the present study was limited to males with relatively low participation rate and small sample size, so results need to be cautiously interpreted and may not be generalizable, especially for women. Moreover, we did not obtain data on the apolipoprotein E4 (APOE ε4) genotype, which has been found to be directly associated with worse cognitive functioning independent of confounders where men are even more vulnerable ( Lyall et al., 2019).
In conclusion, the present results do not suggest any beneficial or adverse relationship between alcohol consumption levels and cognitive functioning in current elderly drinkers over that in never-drinkers. While no potential causative factor(s) of low cognitive performance were identified among ex-drinkers, further studies
(preferably inclusive of women) are warranted to clarify whether this low cognitive functioning was due to factors that caused drinkers to become non-drinkers.
Source of funding
The SESSA (Shiga Epidemiological Study of Subclinical Atherosclerosis) has been supported by the Japan Society for the Promotion of Science (JSPS) KAKENHI Grant Number JP13307016, JP17209023, JP21249043, JP23249036, JP25253046, JP15H02528, JP18H04074, JP23590790, JP19H03898 from the Ministry of Education, Culture, Sports, Science, and Technology Japan, and by grant, R01HL068200 from the National Institute of Health (NIH), USA and from Glaxo-Smith Kline GB. The present study was planned and analyzed by the authors. The funders had no role in the study design, data collection and analysis, interpretation of results, the decision to publish, or preparation of the manuscript.
Author contribution
A.T.S., A.K., A.F., I.T., K.M., H.U.: design and conceptualization study. N.M., Y.S., H.S., K.K., H.Y., T.I., H.S.: major role in data collection. A.T.S.: performed the statistical analysis and drafted the manuscript. All authors critically revised the manuscript for important intellectual content and approved the final manuscript.
Declaration of Competing Interest
The authors report no disclosures related to the manuscript.
Acknowledgments
The authors are deeply indebted to the study participants, staff members, and investigators of the SESSA study.
Appendix A
Supplementary data
Supplementary data to this article can be found online at https://doi.org/10.1016/j.alcohol.2020.01.001.
References
i The corrections made in this section will be reviewed and approved by a journal production editor. The newly added/removed references and its citations will be reordered and rearranged by the production team.
Au Yeung, S.L., Jiang, C.Q., Cheng, K.K., Liu, B., Zhang, W.S., & Lam, T.H., et al. (2012). Evaluation of moderate alcohol use and cognitive function among men using a Mendelian randomization design in the Guangzhou biobank cohort study. American Journal of Epidemiology, 175, 1021–1028. doi:10.1093/aje/kwr462.
Belmadani, A., Kumar, S., Schipma, M., Collins, M.A., & Neafsey, E.J. (2004). Inhibition of amyloid-beta-induced neurotoxicity and apoptosis by moderate ethanol preconditioning. Neuroreport, 15, 2093– 2096. doi:10.1097/00001756-200409150-00019.
Bond, G.E., Burr, R.L., McCurry, S.M., Rice, M.M., Borenstein, A.R., & Larson, E.B. (2005). Alcohol and cognitive performance: A longitudinal study of older Japanese Americans. The Kame project.
International Psychogeriatrics, 17, 653–668. doi:10.1017/s1041610205001651.
Cooper, C., Bebbington, P., Meltzer, H., Jenkins, R., Brugha, T., & Lindesay, J.E., et al. (2009). Alcohol in moderation, premorbid intelligence and cognition in older adults: Results from the psychiatric morbidity survey. Journal of Neurology, Neurosurgery, and Psychiatry, 80, 1236–1239. doi:10.1136/jnnp.2008.163964.
Corley, J., Jia, X., Brett, C.E., Gow, A.J., Starr, J.M., & Kyle, J.A., et al. (2011). Alcohol intake and cognitive abilities in old age: The lothian birth cohort 1936 study. Neuropsychology, 25, 166–175. doi:10.1037/a0021571.
Cullen, B., O’Neill, B., Evans, J.J., Coen, R.F., & Lawlor, B.A. (2007). A review of screening tests for cognitive impairment. Journal of Neurology, Neurosurgery, and Psychiatry, 78, 790–799. doi:10.1136/jnnp.2006.095414.
Debette, S., Seshadri, S., Beiser, A., Au, R., Himali, J.J., & Palumbo, C., et al. (2011). Midlife vascular risk factor exposure accelerates structural brain aging and cognitive decline. Neurology, 77, 461–468. doi:10.1212/WNL.0b013e318227b227.
Dufouil, C., Ducimetière, P., & Alpérovitch, A. (1997). Sex differences in the association between alcohol consumption and cognitive performance. EVA Study Group. Epidemiology of Vascular Aging. American Journal of Epidemiology, 146, 405–412. doi:10.1093/oxfordjournals.aje.a009293.
Friedewald, W.T., Levy, R.I., & Fredrickson, D.S. (1972). Estimation of the concentration of low-density lipoprotein cholesterol in plasma, without use of the preparative ultracentrifuge. Clinical Chemistry, 18, 499–502.
Fujiyoshi, A., Miura, K., Kadowaki, S., Azuma, K., Tanaka, S., & Hisamatsu, T., et al. (2016). Lifetime cigarette smoking is associated with abdominal obesity in a community-based sample of Japanese men: The Shiga Epidemiological Study of Subclinical Atherosclerosis (SESSA). Preventive Medicine Reports, 4, 225–232. doi:10.1016/j.pmedr.2016.06.013.
Galanis, D.J., Joseph, C., Masaki, K.H., Petrovitch, H., Ross, G.W., & White, L. (2000). A longitudinal study of drinking and cognitive performance in elderly Japanese American men: The Honolulu-Asia aging study. American Journal of Public Health, 90, 1254–1259. doi:10.2105/ajph.90.8.1254.
Ge, S., Wei, Z., Liu, T., Wang, J., Li, H., & Feng, J., et al. (2018). Alcohol use and cognitive functioning among middle-aged and older adults in China: Findings of the China health and retirement longitudinal study baseline survey. Alcoholism: Clinical and Experimental Research, 42, 2054–2060. doi:10.1111/acer.13861.
Gibbons, L.E., McCurry, S., Rhoads, K., Masaki, K., White, L., & Borenstein, A.R., et al. (2009). English language equivalence of the cognitive abilities screening instrument among Japanese-Americans. International Psychogeriatrics, 21, 129–137. doi:10.1017/S1041610208007862.
Golde, T.E. (2003). Alzheimer disease therapy: Can the amyloid cascade be halted?. The Journal of Clinical Investigation, 111, 11–18. doi:10.1172/JCI17527.
Gross, A.L., Rebok, G.W., Ford, D.E., Chu, A.Y., Gallo, J.J., & Liang, K.Y., et al. (2011). Alcohol consumption and domain-specific cognitive function in older adults: Longitudinal data from the johns Hopkins precursors study. The Journals of Gerontology. Series B, Psychological Sciences and Social Sciences, 66, 39–47. doi:10.1093/geronb/gbq062.
Horvat, P., Richards, M., Kubinova, R., Pajak, A., Malyutina, S., & Shishkin, S., et al. (2015). Alcohol consumption, drinking patterns, and cognitive function in older Eastern European adults. Neurology, 84, 287–295. doi:10.1212/wnl.0000000000001164.
Kashiwagi, A., Kasuga, M., Araki, E., Oka, Y., Hanafusa, T., & Ito, H., et al. (2012). International clinical harmonization of glycated hemoglobin in Japan: From Japan diabetes society to national Glycohemoglobin standardization Program values. Journal of Diabetes Investigation, 3, 39–40. doi:10.1111/j.2040-1124.2012.00207.x.
Lau, J., Ioannidis, J.P.A., Terrin, N., Schmid, C.H., & Olkin, I. (2006). The case of the misleading funnel plot. BMJ, 333, 597–600. doi:10.1136/bmj.333.7568.597.
Lobo, E., Dufouil, C., Marcos, G., Quetglas, B., Saz, P., & Guallar, E., et al. (2010). Is there an association between low-to-moderate alcohol consumption and risk of cognitive decline?. American Journal of Epidemiology, 172, 708–716. doi:10.1093/aje/kwq187.
Lyall, D.M., Cox, S.R., Lyall, L.M., Celis-Morales, C., Cullen, B., & Mackay, D.F., et al. (2019). Association between APOE e4 and white matter hyperintensity volume, but not total brain volume or white matter integrity. Brain Imaging and Behavior. doi:10.1007/s11682-019-00069-9.
Lyu, J., & Lee, S.H. (2012). Gender differences in the link between excessive drinking and domain-specific cognitive functioning among older adults. Journal of Aging and Health, 24, 1380–1398. doi:10.1177/0898264312459346.
Lyu, J., & Lee, S.H. (2014). Alcohol consumption and cognitive impairment among Korean older adults: Does gender matter?. International Psychogeriatrics, 26(2), 335–340. doi:10.1017/s1041610213001919. Mann, K., Günther, A., Stetter, F., & Ackermann, K. (1999). Rapid recovery from cognitive deficits in abstinent alcoholics: A controlled test-retest study. Alcohol and Alcoholism, 34, 567–574. doi:10.1093/alcalc/34.4.567.
Murakami, K., & Hashimoto, H. (2019). Associations of education and income with heavy drinking and problem drinking among men: Evidence from a population-based study in Japan. BMC Public Health, 19, 420. doi:10.1186/s12889-019-6790-5.
Nakamura, K., Okamura, T., Hayakawa, T., Hozawa, A., Kadowaki, T., & Murakami, Y., et al. (2007). The proportion of individuals with alcohol-induced hypertension among total hypertensives in a general Japanese population: NIPPON DATA90. Hypertension Research, 30, 663–668. doi:10.1291/hypres.30.663.
Nakanishi, K., Jin, Z., Homma, S., Elkind, M.S.V., Rundek, T., & Schwartz, J.E., et al. (2019). Night-time systolic blood pressure and subclinical cerebrovascular disease: The cardiovascular Abnormalities and brain lesions (CABL) study. European Heart Journal Cardiovascular Imaging, 20, 765–771. doi:10.1093/ehjci/jey221.
Neafsey, E.J., & Collins, M.A. (2011). Moderate alcohol consumption and cognitive risk. Neuropsychiatric Disease and Treatment, 7, 465–484. doi:10.2147/ndt.s23159.
Papke, L.E., & Wooldridge, J.M. (1996). Econometric methods for fractional response variables with an application to 401 (K) plan participation rates. Journal of Applied Econometrics, 11, 619–632.
Reas, E.T., Laughlin, G.A., Kritz-Silverstein, D., Barrett-Connor, E., & McEvoy, L.K. (2016). Moderate, regular alcohol consumption is associated with higher cognitive function in older community-dwelling adults. The Journal of Prevention of Alzheimer’s Disease, 3, 105–113. doi:10.14283/jpad.2016.89.
Rehm, J., Baliunas, D., Borges, G.L., Graham, K., Irving, H., & Kehoe, T., et al. (2010). The relation between different dimensions of alcohol consumption and burden of disease: An overview. Addiction, 105, 817–843. doi:10.1111/j.1360-0443.2010.02899.x.
Ritchie, S.J., Bates, T.C., Corley, J., McNeill, G., Davies, G., & Liewald, D.C., et al. (2014). Alcohol consumption and lifetime change in cognitive ability: A gene × environment interaction study. Age (Dordrecht, Netherlands), 3. doi:10.1007/s11357-014-9638-z. 9638–9638.
Sabia, S., Elbaz, A., Britton, A., Bell, S., Dugravot, A., & Shipley, M., et al. (2014). Alcohol consumption and cognitive decline in early old age. Neurology, 82, 332–339. doi:10.1212/WNL.0000000000000063.
Sabia, S., Fayosse, A., Dumurgier, J., Dugravot, A., Akbaraly, T., & Britton, A., et al. (2018). Alcohol consumption and risk of dementia: 23 year follow-up of Whitehall II cohort study. BMJ, 362. doi:10.1136/bmj.k2927. k2927–k2927.
Schwarzinger, M., Pollock, B.G., Hasan, O.S.M., Dufouil, C., & Rehm, J. (2018). Contribution of alcohol use disorders to the burden of dementia in France 2008–13: A nationwide retrospective cohort study. Lancet Public Health, 3, e124–e132. doi:10.1016/S2468-2667(18)30022-7.
Stockwell, T., Donath, S., Cooper-Stanbury, M., Chikritzhs, T., Catalano, P., & Mateo, C. (2004). Under-reporting of alcohol consumption in household surveys: A comparison of quantity-frequency, graduated-frequency and recent recall. Addiction, 99, 1024–1033. doi:10.1111/j.1360-0443.2004.00815.x.
Sun, L., Xu, H., Zhang, J., Li, W., Nie, J., & Qiu, Q., et al. (2018). Alcohol consumption and subclinical findings on cognitive function, biochemical indexes, and cortical anatomy in cognitively normal aging han Chinese population. Frontiers in Aging Neuroscience, 10, 182. doi:10.3389/fnagi.2018.00182.
Teng, E.L., Hasegawa, K., Homma, A., Imai, Y., Larson, E., & Graves, A., et al. (1994). The cognitive abilities screening instrument (CASI): A practical test for cross-cultural epidemiological studies of dementia. International Psychogeriatrics, 6, 45–58. doi:10.1017/s1041610294001602. discussion 62. Topiwala, A., Allan, C.L., Valkanova, V., Zsoldos, E., Filippini, N., & Sexton, C., et al. (2017). Moderate alcohol consumption as risk factor for adverse brain outcomes and cognitive decline: Longitudinal cohort study. BMJ, 357, j2353. doi:10.1136/bmj.j2353.
Xu, W., Wang, H., Wan, Y., Tan, C., Li, J., & Tan, L., et al. (2017). Alcohol consumption and dementia risk: A dose–response meta-analysis of prospective studies. European Journal of Epidemiology, 32, 31– 42. doi:10.1007/s10654-017-0225-3.
Queries and Answers
Query: Your article is registered as a regular item and is being processed for inclusion in a regular issue of the
journal. If this is NOT correct and your article belongs to a Special Issue/Collection please contact [email protected] immediately prior to returning your corrections.
Answer: This article is for regular issue of the journal. Thank you.
Query: Please confirm that given names and surnames have been identified correctly and are presented in the desired
order and please carefully verify the spelling of all authors' names.
Answer: Yes
Query: Editor comment: Is the sentence correct?
Answer: Thank you very much for the comment. We have made necessary correction. Query: Editor comment: Thank you very much for your edit. The sentence is correct. Answer: Thank you very much for the comment. We have made necessary correction.
Zakhari, S. (2006). Overview: How is alcohol metabolized by the body?. Alcohol Research & Health, 29, 245–254.
Zinn S Stein R & Swartzwelder H S (2004) Executive functioning early in abstinence from alcohol
Highlights
• Current drinking was not associated with low cognitive function in elderly Japanese men. • Ex-drinkers’ global cognitive scores were lower compared to never-drinkers.
• Low abstraction and judgment functioning were observed in ex-drinkers vs. never-drinkers.
Appendix A
Supplementary data
The following is the supplementary data to this article: Multimedia Component 1
Multimedia component 1 Multimedia Component 2 Multimedia component 2
Query: Editor comment: Is this the correct word?
Answer: Thank you very much for the comment. Yes, it is a correct word.
Query: Editor comment: Thank you very much for your comment. Yes, it is a correct word. Answer: Thank you very much for the comment. Yes, it is a correct word.
Query: Have we correctly interpreted the following funding source(s) and country names you cited in your article:
SESSA (Shiga Epidemiological Study of Atherosclerosis), Japan; Japan Society for the Promotion of Science (JSPS) KAKENHI, Japan; Ministry of Education, Culture, Sports, Science, and Technology Japan, Japan; NIH, Japan; Glaxo-Smith Kline GB, Japan?