Scientific paper
Analytical Study on the Effect of Different Shear Reinforcement Shapes
on Shear Failure Behavior and Shear Resistance Mechanism of RC
Beams
Keisuke Kawamura
1*, Hikaru Nakamura
2, Masashi Takemura
3and Taito Miura
4Received 19 January 2021, accepted 13 May 2021 doi:10.3151/jact.19.571
Abstract
The authors have reported from experimental investigation that the use of closed stirrups, U-shaped stirrups and rod-shaped reinforcements as shear reinforcements in reinforced concrete (RC) beams results in clear differences in internal crack patterns and maximum strength. In this study, simulations of the experimental beams were performed using a three-dimensional rigid-body spring model, demonstrating that the behavior observed in the experiments is a me-chanical phenomenon that can be reproduced numerically. Using the stress distribution over the beam cross section ob-tained from the analysis, the beam and arch action components of shear resistance are decoupled and considered from the perspective of the shear resistance mechanism. Further, through analysis of additional cases, the role of the upper and lower horizontal legs of the shear reinforcement, the effect of end anchorages on rod-shaped reinforcements were clari-fied.
1. Introduction
In recent years, as the amount of reinforcements required to meet design calculations has increased due to changes in seismic design standards, reinforcing bar arrangement work is often difficult because of the high-density bar arrangement. As one solution to this problem, the use of mechanical anchorage methods is being actively pro-moted (Wright et al. 1997; Thompson et al. 2002). There are some cases where the shear reinforcement effect of mechanical anchorage bars has been experimentally verified (Lubell et al. 2009; Ferreira et al. 2014; Le-quesne et al. 2018). Further, in post-construction strengthening of existing RC members whose shear strength is found to be insufficient when checked against the latest design criteria, special plate-anchored rein-forcement systems (PHBs) suitable for installation from one side or in confined spaces may be used (Kawamura
et al. 2013, 2020; Kumagai et al. 2017). As a result, a
variety of different shear reinforcement types are now finding practical application in RC beams as new tech-nologies are being developed to meet various needs. In order to use these technologies effectively, it is important to study the structural performance from a new
perspec-tive, without being limited by conventional structural details. However, although the influence of the vertical legs of shear reinforcing systems can be calculated from the shear reinforcement ratio determined from their cross-sectional area (fib 2013; ACI 2015; JSCE 2018), there has been no clarification of the effect of the hori-zontal legs of these reinforcing systems oriented in the width direction on the shear failure behavior of RC beams. Similarly, the influence of differences in the cross-sectional location of the vertical legs is not known.
In the previous report (Kawamura et al. 2021), dif-ferences in the shear failure behavior of RC beams with three different shapes of shear reinforcement (closed stirrup, U-shaped stirrup, and rod-shaped reinforce-ments) were discussed on the basis of beam loading tests. It was shown that even if the shear reinforcement ratio determined by the cross-sectional area of the vertical legs is almost the same, different shear reinforcement systems result in clear differences in internal crack patterns and beam deformation in the width direction. There were two mechanisms for out-of-plane displacement; dilatancy due to compression failure of the concrete and splitting behavior due to the development of a vertical crack along the axial direction. The conclusion was that the share of shear force borne by the concrete and the shear rein-forcement at the maximum load varies, and there is a resulting difference in the maximum load. Since shear failure of RC beams is generally a highly variable phe-nomenon, the experiments were carried out on one specimen in each case. Therefore, it is significant to conduct an analytical study to verify the validity of the results obtained.
It is known that the shear resistance mechanism of RC beams consists of beam and arch actions, and that truss action accounts for part of beam action when shear re-inforcement is present (Park et al. 1975). There are study 1Research Engineer, Infrastructure Technology Research
Department, Advanced Center of Technology, Taisei Corporation, Yokohama, Japan. *Corresponding author,
E-mail: [email protected]
2Professor, Department of Civil and Environmental Engineering, Nagoya University, Nagoya, Japan.
3Graduate Student, Department of Civil and Environ-mental Engineering, Nagoya University, Nagoya, Japan. 4Associate Professor, Department of Civil and Environ-mental Engineering, Nagoya University, Nagoya, Japan.
cases in which these shear resistance mechanisms have been decoupled from the results of loading tests on RC beam specimens using reinforcement strain measure-ments (Kim et al. 1999; Nakamura et al. 2006; Yamada 2019; Gunawan et al. 2020). On the other hand, it is possible to evaluate these mechanisms directly using numerical methods that allow visualization of stresses at specific positions (Fu et al. 2017, 2020; Nakamura et al. 2018; Yamada 2019). Nakamura et al. (2018) discussed the shear resistance mechanism of RC beams with shear reinforcements using a three-dimensional rigid-body spring model (3-D RBSM) (Yamamoto et al. 2008), showing that it can evaluate the shear failure behavior of RC members with high accuracy. This work clarified that the shear resistance mechanism at the maximum load consists of beam action, which is mostly truss action, and concrete arch action, regardless of the shear span to depth ratio. It may be possible to explain in detail the effect of different shear reinforcement shapes on the shear failure behavior of RC beams by considering these shear resis-tance mechanisms.
In this study, numerical analysis with 3-D RBSM is used to verify mechanically the behavior confirmed in the loading tests of RC beam specimens with various shear reinforcement shapes as a parameter. Using the cross-sectional stress distributions obtained by the analysis, the beam and arch actions are decoupled and the truss action is calculated. From these results, the influ-ence of different shear reinforcement shapes on the shear resistance mechanism of RC beams is discussed. In par-ticular, this study focuses on the behavior of the case with rod-shaped reinforcements, where significant differences were observed in internal crack patterns and shear ca-pacity from the experiments. In the experiment, the role of the upper horizontal leg of the shear reinforcement was discussed based on the experimental results, but the lower horizontal leg may also affect the internal crack patterns. It is also possible that the anchorage at each end of a rod-shaped reinforcement may affect the shear re-inforcement effect. Thus, the effects of the upper and lower horizontal legs in the shear reinforcement and the anchorages at the two ends of the rod-shaped rein-forcement on the shear resistance mechanism are sys-tematically considered by analytical study.
2. Analytical method
2.1 Three-dimensional rigid-body spring model (3-D RBSM)
The analytical method used in this study is 3-D RBSM (Yamamoto et al. 2008), which enables to directly ex-press discontinuous behaviors of concrete, such as cracking and fracturing. It has been verified by several studies that this method can reproduce the crack propa-gation and shear failure behavior of RC members with good accuracy (Yamamoto et al. 2010, 2014; Gedik et al. 2012; Fu et al. 2017, 2020; Nakamura et al. 2018).
As shown in Fig. 1, the target concrete is discretized into rigid body elements of random shape generated by a Voronoi tessellation. Springs connect the elements. This method of discretization reduces the dependence of element shapes on the failure propagation behavior. A three-dimensional rigid body displacement with six de-grees of freedom is set at the center of gravity of each element. A spring system is placed at the center of grav-ity of the triangle formed by the center of gravgrav-ity of the element boundary surface and vertexes. The spring sys-tem consists of one vertical spring that models the uni-axial compression/tension behavior of the concrete and two shear springs that model the shear-slip behavior. In this model, by arranging multiple spring systems on one boundary surface of an element, it is possible to express the moment transfer between adjacent elements without the use of rotating springs. The references (Yamamoto et
al. 2008, 2010) provide details of how constitutive
models are modeled using spring systems and various material parameter identification methods.
2.2 Modeling of reinforcement components The reinforcement components are modeled by discrete reinforcement elements (Bolander et al. 2002). As shown in Fig. 2, beam elements are used as the model and zero-size link elements that provide a load transfer mechanism between concrete particles and beam nodes are arranged at the node of the beam element. A bilinear model is used as the stress-strain relationship of the beam element, in which the secondary gradient after yielding is 1/100 of the Young's modulus of the rein-forcement. The bond stress-slip relationship proposed by Usman et al. (2020) is used for the link elements. As
Vertex of boundary face
Spring location
Springs at integration point
Nucleus
(a) Rigid-body spring model (b) Voronoi tessellation Fig. 1 Three-dimensional rigid-body spring model (3-D RBSM).
shown in Fig. 3, the shape of the initial curve of this model is close to that proposed by Shima et al. (1987), and the model is combined to the fib model (fib 2013) for maximum bond stress and subsequent softening behavior. It has been verified that this model can simulate the dif-ference in bond behavior in concrete according to the diameter of the reinforcement and the concrete cover thickness by using it in combination with 3-D RBSM that can directly express cracking (Usman et al. 2020).
3. Analysis for loading tests of RC beam specimens
3.1 Experiment outline
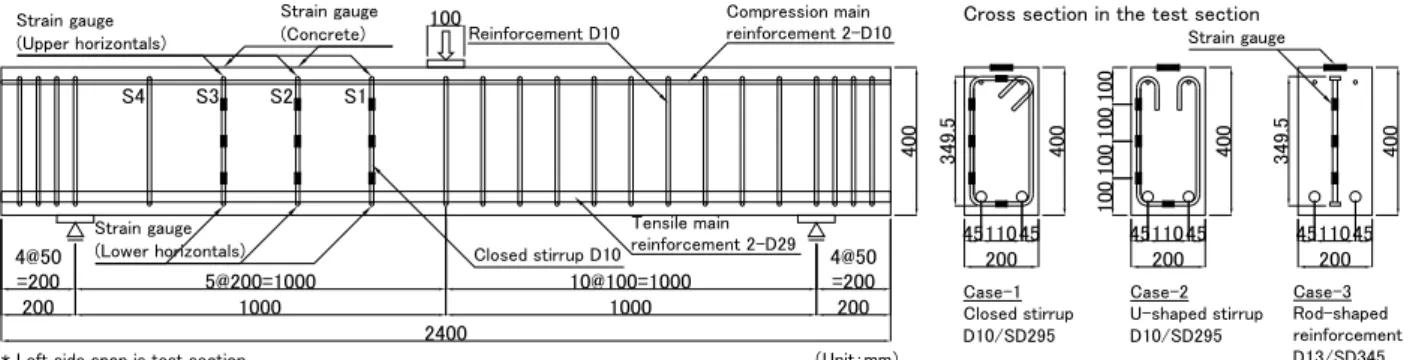
In the previously-reported experiments (Kawamura et al. 2021), the authors conducted a static monotonic loading test of three RC beams failed in shear, as outlined in Fig. 4. The specimen beams all measured 200 mm wide × 400 mm height × 2400 mm total length and had a shear span to depth ratio /a d = 2.86. In each case, a different design of shear reinforcement was arranged at 200 mm spacing in the shear span of the test section. The shear reinforcement had been designed to ensure that shear
failure occurred in the test section. In the figure, the shear reinforcements in the test section are designated as S1 to S4 arranged from the loading point end. In Case-1, the shear reinforcements were closed stirrups, in Case-2 U-shaped stirrups were used, while rod-shaped forcements were used in Case-3. Rod-shaped rein-forcement is a plate anchoring type shear reinrein-forcement (PHB) in which circular steel plates with a thickness of 9 mm and a diameter of 28 mm are frictionally welded to both ends (Kawamura et al. 2020). The PHBs were ar-ranged independently from the main reinforcements for the case of post-construction shear strengthening. The shear reinforcement consisted of SD295/D10 for Cases-1 and 2, and SD345/D13 for Case-3. The shear rein-forcement ratio pw in the test section is 0.36% in both Case-1 and Case-2, and 0.32% in Case-3. Tables 1 and 2 show the material properties of the reinforcement and concrete used in the experiment. The variation in the product of reinforcement ratio pw and yield strength
wy
f of the shear reinforcement among the three cases is
about 3%, and this reinforcement design allows the dif-ference in pw to be neglected. Please refer to the pre-vious report (Kawamura et al. 2021) for further details of
this experiment. 3.2 Analysis outline
Figure 5 shows the analytical model used to simulate the concrete and reinforcement of the RC beam specimen tested in the experiment. The concrete is divided ran-domly into rigid particle elements with an average size of 20 mm.
In order to consider the effect of drying shrinkage that
200 1000 1000 200 2400 5@200=1000 10@100=1000 4@50 =200 40 0 100 (Unit:mm) * Left side span is test section.
4@50 =200
S1 S2 S3
* Side view shows Case-1.
Case-1 Closed stirrup D10/SD295 Case-3 Rod-shaped reinforcement D13/SD345 Case-2 U-shaped stirrup D10/SD295 S4 Compression main reinforcement 2-D10 Tensile main reinforcement 2-D29 Reinforcement D10 Closed stirrup D10 4511045200 40 0 4511045 200 40 0 4511045 200 40 0
Cross section in the test section
Strain gauge 10 0 10 0 10 0 10 0 34 9. 5 34 9. 5 Strain gauge (Upper horizontals) Strain gauge (Lower horizontals) Strain gauge (Concrete)
Fig. 4 RC beam specimen (Kawamura et al. 2021). Zero-size link
Beam element Reinforcement direction
Fig. 2 Modeling of reinforcement.
Table 1 Material properties of reinforcing steel. Reinforcement type Material Diameter Yield strength Tension reinforcement SD490 D29 537 N/mm2 Closed stirrup SD295 D10 370 N/mm2 U-shaped stirrup SD295 D10 370 N/mm2 Rod-shaped PHB SD345 D13 403 N/mm2 τ s τmax 0.4τmax s1 s2 s3 s1=0.9mm s2=2.0mm
s3=cclear(spacing of rebar ribs)
Fig. 3 Bond stress-slip relationship.
Table 2 Compressive strength of concrete.
Case-1 Case-2 Case-3
Compressive
may have occurred in the experimental test specimens, concrete tensile strength was back calculated such that the load at bending crack initiation and the initial change in crack width would match the experimental results (Okamura et al. 1991).
The shear reinforcements in Cases-1 and 2 were modeled without the hooks. The link elements placed at intersections of vertical and horizontal legs and the end of the beam element modeling the U-shaped stirrup in Case-2 are fixed end conditions. The PHB shear rein-forcement in Case-3 has a small circular plate at each end for anchoring, but it is not easy to consider the cross-sectional changes of the end plates because the geometry modeling method is based on beam elements without considering the thickness of the rebar. Therefore, this plate shape is not modeled; instead the link element positioned at the end of the beam element modeling the PHB provides a fixed end condition. Therefore, it is noted that local bearing stress from plate is not consid-ered in the analysis. Except for the link elements with these fixed conditions, the bond stress-slip relationship shown in Fig. 3 is applied to all other elements.
3.3 Load-displacement relationships
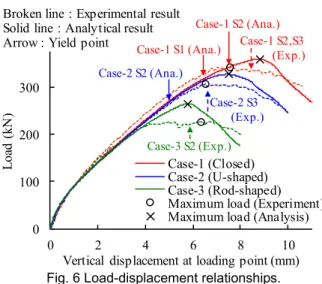
The relationships between load and vertical displacement at the loading point in each case are shown in Fig. 6, together with the experimental results. The timing at which the diagonal cracks occurred is almost in agree-ment with the experiagree-ment, and member stiffness is in close agreement with the experimental results. The tim-ing of shear reinforcement yieldtim-ing is indicated by ar-rows in the figure. Compared with the experiment, there are some differences in the position and timing of yielding, which is considered to be due to the difference
in the diagonal cracks position shown in Section 3.4. Shear failure occurred in all cases, both in the experiment and analysis. The maximum loads are shown in Table 3, with the analytical results being slightly higher in all cases. However, the variation in the maximum load ac-cording to shear reinforcement shape is in proportion to the experimental results. That is, in comparison with Case-1 (closed stirrups), the maximum load was 9% lower in Case-2 (U-shaped stirrups) and 26% lower in Case-3 (rod-shaped reinforcement). Comparing the load reduction rate for Case-1 with the experimental results, Case-2 was almost the same, and Case-3 was slightly smaller. In the experiment of Case-3, the local bearing pressure from the anchor plates was also considered as a factor of cracking that led to the decrease in the shear capacity. However, this point was not considered in the analysis, so the difference from the experiment may have been slightly larger. The crack patterns will be discussed later.
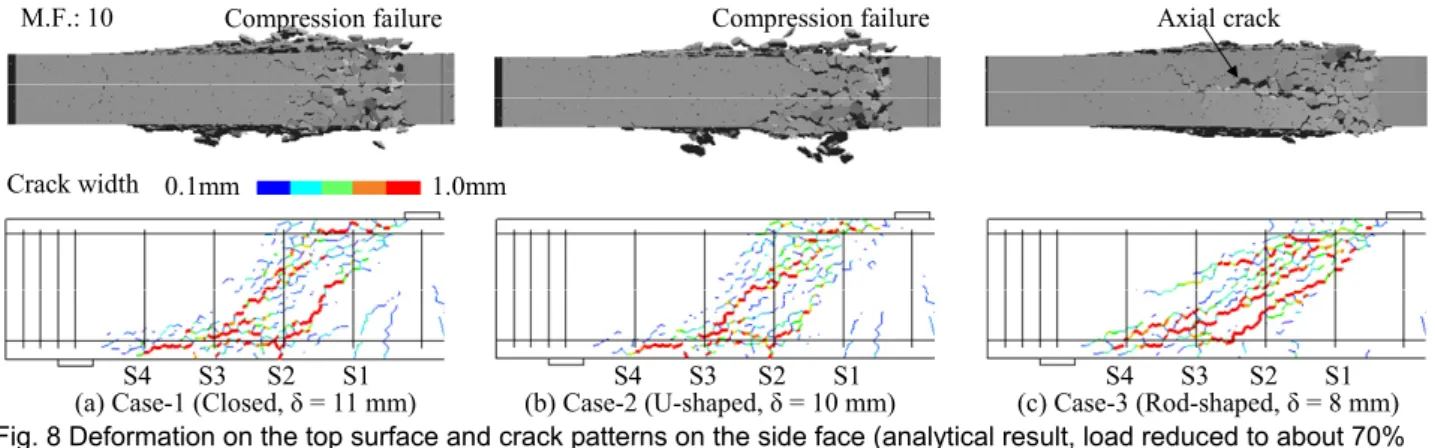
3.4 Surface cracks
Figure 7 shows the crack patterns on the side and top surfaces of the test section at the end of the experiment after unloading. Figure 8 shows the deformation of the top surface and the crack patterns on the side face of each case at the point when the load had decreased by about 70% from maximum in the analysis. Comparing these with the experimental results, the locations of the di-agonal cracks is slightly different, but the crack patterns are almost the same. On the top surface in Cases-1 and 2, compression failure occurs near the loading point; whereas in Case-3, with the rod-shaped reinforcement an axial crack forms at the widthwise center as in the ex-periment. This axial crack is a characteristic feature, confirmed in the experiment, of positioning a single shear-reinforcing bar in the center of the cross section in the width direction. The occurrence of the same crack observed in experiment in the numerical analysis con-firms that this behavior is mechanical.
3.5 Internal crack patterns
Figures 9 to 11 show the state of deformation and in-ternal crack patterns at the same time point in the analysis as Fig. 8. The cross sections shown in each case corre-spond to the positions of shear reinforcements S1 to S4. In the figure, the cracks observed on the cut surfaces of S2 and S4 in the experiment are also shown. In addition, a photograph of a characteristic vertical crack observed
* Case-1 (closed stirrup reinforcement) shown Fig. 5 Analytical model.
0 100 200 300 0 2 4 6 8 10 Lo ad (k N )
Vertical displacement at loading point (mm) Case-1 (Closed) Case-2 (U-shaped) Case-3 (Rod-shaped) Maximum load (Experiment) Maximum load (Analysis) Broken line : Experimental result
Solid line : Analytical result Arrow : Yield point
Case-2 S2 (Ana.) Case-1 S1 (Ana.) Case-1 S2 (Ana.) Case-1 S2,S3 (Exp.) Case-2 S3 (Exp.) Case-3 S2 (Exp.)
Fig. 6 Load-displacement relationships.
Table 3 Maximum loads. Case-1
(Closed) (U-shaped) Case-2 (Rod-shaped)Case-3 Maximum load 343 kN 306 kN 227 kN Exp. Decline ratio* - 0.89 0.66
Maximum load 360 kN 327 kN 264 kN Ana. Decline ratio* - 0.91 0.73
*Decline ratio shows the ratio of the maximum load to Case-1.
in the section between S2 and S3 in Case-3 is also shown. Figure 12 shows how cracks propagate at the S2 cross section as vertical displacement (δ) increases (δ = 3, 5, 7 mm). The internal crack patterns differ greatly depending on the shear reinforcement shapes.
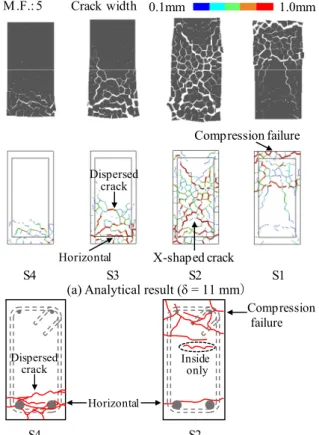
In Case-1, diagonal cracks first occur within the closed stirrup and propagate toward both side faces (Fig. 12). In the cut surface after the test, a diagonal crack observed only in the center of the width direction, which was considered to have propagated from the inside of the stirrup, so the analytical results are similar to the ex-perimental results [Fig. 9(b)]. After the maximum load, compression failure occurs near the loading point and wide X-shaped cracks form inside the stirrups, but it is confirmed that the spread of deformation is confined by the closed stirrups [Fig. 9(a)].
In Case-2, diagonal cracks occur within the U-shaped stirrup and propagate from its position towards the two side faces, similar to that in Case-1 (Fig. 12). The crack pattern after the maximum load is similar to that of Case-1 [Fig. 10(a)]. However, differences are visible in the S1 cross section, where spread in the width direction is relatively large near the top surface, and in the S2 cross section, where wide diagonal cracks propagate almost horizontally. There is a crack that propagates vertically from the top corner as if it wraps around the inside of the compression main reinforcement as observed similar to that in the experiment [Fig. 10(b)]. With no upper hori-zontal leg in the stirrup, it is inferred that confinement is
lacking in this region.
Case-3 with rod-shaped reinforcements is quite dif-ferent from Cases-1 and 2. Diagonal cracks first occur near the two side faces (Fig. 12). It is inferred that this results from the position of the vertical shear reinforce-ment, which is in the center of the cross section, not near the side faces. These cracks that form near the side faces propagate inward in the width direction, but they avoid the vertical rod-shaped reinforcement in the center and form radial cracks. These results demonstrate that the crack propagation favors regions without shear rein-forcements. These cracks reach at the top surface above the rod-shaped reinforcements and form as the axial cracks on the top surface of the beam similar to that in the experiment [Fig. 11(b)]. After the maximum load, the deformation was such that it caused an axial split down the center of the beam, and widthwise deformation oc-curred over the entire height of the beam [Fig. 11(a)]. This analysis clearly shows that when rod-shaped rein-forcements are arranged only in the center of the cross section, concrete is not confined by the shear rein-forcement except in this immediate area and would cause greater deformation. In the experiment, it is assumed that the local bearing pressure from the end plates also had an effect, but this was not considered in the analysis. In the analysis, local pressure is introduced by fixed condition of point at the end of rebar and the pressure will be smaller than the local bearing pressure from plate area. Therefore, the timing of the crack propagation to the top
S1 S2 S3 S4 Side Top S1 S2 S3 S4 Side Top S1 S2 S3 S4 Side
Top Compression failure Axial crack
Crack * Thick lines : Diagonal cracks that are wider and more dominant with respect to shear failure than others. (a) Case-1 (Closed) (b) Case-2 (U-shaped) (c) Case-3 (Rod-shaped)
Fig. 7 Crack patterns on the side and top of the test section; experimental results after unloading (Kawamura et al. 2021). M.F.: 10 Compression failure Compression failure Axial crack
0.1mm 1.0mm
Crack width
S4 S3 S2 S1 S4 S3 S2 S1 S4 S3 S2 S1 (a) Case-1 (Closed, δ = 11 mm) (b) Case-2 (U-shaped, δ = 10 mm) (c) Case-3 (Rod-shaped, δ = 8 mm) Fig. 8 Deformation on the top surface and crack patterns on the side face (analytical result, load reduced to about 70% below maximum).
surface may have been slightly delayed.
The characteristics of these internal crack patterns are the same as those observed experimentally, and the analysis was able to reproduce the three-dimensional crack propagation behavior of RC beams and contributed to understand the internal crack propagation process in detail.
3.6 Width-direction concrete strain on top sur-face
Figure 13 shows the change in concrete strain in the width direction on the top surface in Case-3 (rod-shaped reinforcement) together with the experimental results. The timing at which strain rapidly increases due to the occurrence of axial cracking on the top surface above S2 corresponds with the maximum load. That is, the analy-sis demonstrates that once an axial crack propagates along the top surface, no further shear force can be re-sisted. The timing of this axial cracking is slightly later in the analysis than in the experiment, reason of which is already discussed in Section 3.5, and this explains for the slightly higher maximum load in the analysis. Further, as in the experiment, the rapid increase in strain occurs first on the surface above S2 and then above S3, confirming that the axial crack on the top surface propagates from the loading point end to the support end. The strain de-creases from vertical displacement of about 3 mm. This behavior is the same as the strain change confirmed in the
Compression failure X-shaped crack Horizontal Dispersed crack 0.1mm 1.0mm Crack width M .F.: 5 S4 S3 S2 S1 (a) Analytical result (δ = 11 mm)
Inside only Horizontal Dispersed crack Compression failure S4 S2
(b) Experimental result (after the experiment) Fig. 9 Deformation and internal crack patterns (Case-1, Closed stirrups).
Go inward Compression failure
Dispersed crack 0.1mm 1.0mm Crack width M .F.: 5 S4 S3 S2 S1 Horizontal
(a) Analytical result (δ = 10 mm)
Vertical cracks Go inward Dispersed crack S4 S2 Horizontal Compression failure
(b) Experimental result (after the experiment) Fig. 10 Deformation and internal crack patterns (Case-2, U-shaped stirrups).
Propagated to the top surface
Radial Radial 0.1mm 1.0mm Crack width M.F.: 5 S4 S3 S2 S1 Vertical crack
(a) Analytical result (δ = 8 mm)
(b) Experimental result (after the experiment) Fig. 11 Deformation and internal crack patterns (Case-3, Rod-shaped reinforcements).
experiment, and it can be understood as a stress release caused by propagation of the diagonal cracks.
4. Discussion of shear resistance mechanism
4.1 Study outline
The numerical simulations of loading tests on RC beam specimens with different shear reinforcement shapes yielded the same variations in the maximum load and crack distribution as observed in the experiments. This means that the variations in behavior can be considered as a mechanical phenomenon that is numerically repro-ducible.
In the previous report (Kawamura et al. 2021), based on the measurements of shear reinforcement vertical strain, the contributions of the concrete and the shear reinforcement to resisting shear force are discussed. Here, using the cross-sectional stress distributions obtained from the numerical analysis using 3-D RBSM, it is also possible to discuss mechanisms such as beam and arch actions. So, the influence of shear reinforcement shape on shear failure behavior is discussed from the viewpoint of shear resistance mechanism.
4.2 Decoupling of shear resistance mecha-nisms
It is known that the shear resistance mechanism of an RC member consists of beam and arch actions (Park et al. 1975), and that these can be decoupled using analytical results obtained by 3D-RBSM (Fu et al. 2017, 2020;
Nakamura et al. 2018).
In the RC beam subjected to shear loading, the bend-ing moment M acting on the section can be expressed by Eq. (1). ( ) 2 C C S S S C C C T j M = T +C ⋅ +C ⋅j +T ⋅j (1)
where, TS is the tensile force of the main reinforcement, S
C is the compressive force of the main reinforcement, C
C is the compressive force of the concrete, TC is the tensile force of the concrete, jS is the distance between the main reinforcements, jCC is the distance between the gravity center of concrete compressive stress and the beam axis, and jTC is the distance between the gravity center of concrete tensile stress and the beam axis.
Figure 14 shows a conceptual diagram of the shear resistance mechanism when considering the stress state in the small region dx in the axial direction. The shear force V obtained by differentiating Eq. (1) with respect to coordinate axis x in the beam axial direction can be
expressed by Eq. (2), where it is decoupled into the beam action Vb given by Eq. (3) and the arch action Va given by Eq. (4). These equations are applicable when the main reinforcements are arranged horizontally in a straight line. M V b a d V V dx = = + (2) Direction of propagation Direction of propagation Direction of propagation δ=3mm δ=5mm δ=7mm Case-1 (Closed) Case-2 (U-shaped) Case-3 (Rod-shaped) 0.1mm 1.0mm Crack width
Fig. 12 Crack propagation at cross section S2.
Cs Cc Tc Ts Cs+dCs Cc+dCc Tc+dTc Ts+dTs dx dCs dCc dTc dTs dx Vb Vb jCc jTc Cc Tc Cc Tc dx Va Va djCc djTc
(a) State of equilibrium (b) Beam action (c) Arch action
Fig. 14 Conceptual diagram of shear resistance mechanism (Nakamura et al. 2018).
0 100 200 300 -200 0 200 400 0 2 4 6 8 Lo ad ( kN ) C on cre te s tra in (μ ) Vertical displacement (mm) Broken line: Experimental result Solid line: Analytical result
Red line : Top of S2
Blue line : Top of S3
Fig. 13 Strain change in width direction of top surface (Case-3, Rod-shaped).
2 C C S S S C C b C T dT dC j dC dT V j j dx dx dx dx ⎛ ⎞ =⎜ + ⎟⋅ + ⋅ + ⋅ ⎝ ⎠ (3) C C C T C C dj dj Va C T dx dx = ⋅ + ⋅ (4)
This shows that the state of equilibrium illustrated in Fig. 14(a) can be decoupled into the beam action shown in Fig. 14(b) and the arch action shown in Fig. 14(c). Beam action is a mechanism that resists a shear force through changes in the tensile and compressive forces of the main reinforcement and the compressive and tensile forces of the concrete. Arch action is where a shear force is resisted by changes in the distance between the gravity center of concrete compressive stress and the beam axis, and changes in the distance between the gravity center of concrete tensile stress and the beam axis.
The main reinforcement stress, concrete compressive stress, and its action point are extracted for each cross section from the 3D-RBSM analysis results, and the beam and arch actions are decoupled using the above formula for two cross sections adjacent to each other at
the dx interval in the axial direction. In this study, dx
= 50 mm.
In RC beams with shear reinforcement, it is known that part of the beam action component of shear resis-tance consists of truss action (Park et al. 1975). In other words, it is considered that the beam action can be de-coupled into truss action by the shear reinforcement and shear force borne by the concrete. Here, the shear force borne by truss action is calculated from Eq. (5) based on truss theory assuming a diagonal crack propagation angle of 45 degrees. w w S A j d V s σ ⋅ ⋅ ⋅ = (5)
where Aw is the total area of shear reinforcement placed in interval s , σ is the stress of the shear reinforce-w ment, j d⋅ is the moment arm length, j = 1/1.15, d
is the effective depth, and s is the spacing of shear
reinforcement.
4.3 Difference in shear resistance mechanism depending on shear reinforcement shapes The shear resistance mechanism is decoupled for each of the three cases and the results are shown in Figs. 15 to 17. In each case, the figures on the left hand side show the distribution in the axial direction of the individual shear
force components carried by beam action, arch action, and truss action [Figs. 15(a), 16(a) and 17(a)] and those on the right hand side show the relationship between the individual shear force components (averaged over the entire shear span in the axial direction) and the vertical displacement at the loading point [Figs. 15(b), 16(b) and 17(b)]. In carrying out the averaging, shear force values are excluded within 50 mm of the loading point and the support, where changes in concrete compressive force and reinforcement tensile force are extremely large. The three distributions in each case shown in Figs. 15(a), 16(a) and 17(a) are at the corresponding cases for spe-cific time as marked by the black circles in Figs. 15(b), 16(b) and 17(b). Since the sum of the shear force com-ponents of the beam and arch actions is almost the same as the external shear force, it is considered that the shear resistance mechanism has been properly decoupled. The contribution of truss action is calculated using the value of the maximum stress generated in each shear rein-forcement. The truss actions shown in Figs. 15(b), 16(b) and 17(b) are the average values for shear reinforcement at positions S1 to S3. The decoupled shear forces at the maximum load are shown in Table 4. Here, VS, which is the contribution of the shear reinforcement, is the shear force borne by truss action, and VC, which is the con-tribution of concrete, is the external loads minus VS. The contents of Case-3' and onwards in the table are ex-plained in Section 5.
In Case-1, with the closed stirrups, the shear force is borne mostly by concrete beam action when vertical displacement δ = 1 mm (before the occurrence of di-agonal cracking). The contribution of arch action in-creases after the occurrence of diagonal cracking. The arch action contribution has a relatively large distribution near the loading point. In addition, the beam action con-tribution remains almost constant, though the truss action contribution, which is a part of it, increases. In other words, during the loading process, the contribution made by concrete beam action falls. At the maximum load, it is confirmed that the shear reinforcements near the loading point have yielded, and arch action by the concrete and truss action by the shear reinforcements bear the full shear force. This is the same result as obtained in pre-vious research (Nakamura et al. 2018) on RC beams with different dimensions.
In Case-2, with the U-shaped stirrups, the change in load borne by each shear resistance mechanism is similar to Case-1. The truss action contribution at the maximum load is almost the same as Case-1, but the arch action
Table 4 Shear components at the maximum load. Case-1 (Closed) Case-2 (U-shaped) Case-3 (Rod-shaped) Case-3' (No anchorage) Case-4 (U, reverse) Case-5 (Rod, 2 rows) Case-6 (Alternate) Beam 60 kN 61 kN 36 kN 35 kN 40 kN 39 kN 54 kN Arch 114 kN 99 kN 90 kN 88 kN 109 kN 93 kN 98 kN Truss 76 kN 74 kN 43 kN 35 kN 67 kN 62 kN 52 kN Max. load* 180 kN 164 kN 132 kN 127 kN 155 kN 137 kN 157 kN *Maximum shear force (= 1/2 × Maximum load).
contribution is 13% lower. As shown in Fig. 10, the difference of Case-2 from Case-1 is that there is a large deformation spreads in the width direction near the top surface and cracks propagate vertically in the cross sec-tion. These differences are considered as a result of the presence or absence of confinement by an upper hori-zontal leg of the shear reinforcement, which leads to differences in the crack patterns and in the axial stress distribution in the concrete cross section. As a result, VS is almost the same as in Case-1, but VC is lower.
In Case-3, with the rod-shaped reinforcements, the overall trend of changes in load borne by each shear resistance mechanism is similar to Cases-1 and 2. The contribution of arch action and truss action at the maximum load are smaller than in both Cases-1 and 2. The reduced arch action contribution is thought to result from reduced transmission of compressive stress in the axial direction due to the outward expansion in the width
direction, as shown in Fig. 11. As shown in Section 3.5, the crack patterns in the cross section of Case-3 are dif-ferent from the other cases due to the difdif-ferent locations of the vertical leg of the shear reinforcements. It is thought that the reason for the reduced truss action con-tribution is that cracks propagate up and down the rod-shaped reinforcement in the cross section, and the diagonal cracks that become dominant in failure do not intersect with the shear reinforcement. The use of rod-shaped reinforcements as shear reinforcement leads to both VC and VS being lower than in Case-1. This is the same conclusion reached from the experimental re-sults (Kawamura et al. 2021). The arch action
contribu-tion decreases in the order of Case-1, Case-2, and Case-3, probably because confinement by the shear reinforce-ment horizontal legs decreases in that order.
0 100 200 0 200 400 600 800 She ar for ce (kN ) Shear force Beam+Arch Beam Arch Truss δ=1mm 0 200 400 600 800 δ=4mm
Distance from loading point (mm)0 200 400 600 800 1000 δ=6mm 0 100 200 0 2 4 6 8 10 Vertical displacement (mm) Shear force Beam+Arch Beam Arch Truss
(a) Distribution of beam, arch, and truss action in the axial direction (b) Shear force-displacement relationship Fig. 17 Decoupled shear resistance mechanism (Case-3, Rod-shaped).
0 100 200 0 200 400 600 800 She ar forc e (kN ) Shear force Beam+Arch Beam Arch Truss δ=1mm 0 200 400 600 800 δ=4mm
Distance from loading point (mm)0 200 400 600 800 1000 δ=9mm 0 100 200 0 2 4 6 8 10 Vertical displacement (mm) Shear force Beam+Arch Beam Arch Truss
(a) Distribution of beam, arch, and truss action in the axial direction (b) Shear force-displacement relationship Fig. 15 Decoupled shear resistance mechanism (Case-1, Closed).
0 100 200 0 200 400 600 800 She ar forc e (kN ) Shear force Beam+Arch Beam Arch Truss δ=1mm 0 200 400 600 800 δ=4mm
Distance from loading point (mm)0 200 400 600 800 1000 δ=7.5mm 0 100 200 0 2 4 6 8 10 Vertical displacement (mm) Shear force Beam+Arch Beam Arch Truss
(a) Distribution of beam, arch, and truss action in the axial direction (b) Shear force-displacement relationship Fig. 16 Decoupled shear resistance mechanism (Case-2, U-shaped).
5. Effect of upper and lower horizontal legs and end anchorages of shear reinforcement on shear resistance mechanism
5.1 Study outline
In addition to the three cases designed to replicate the earlier experiment, analyses were carried out in addi-tional cases to investigate the effects of the upper and lower horizontal legs of the shear reinforcement in the width direction of the RC beam on the shear resistance mechanism. Furthermore, the effect of the anchorages at the ends of the rod-shaped reinforcements is studied.
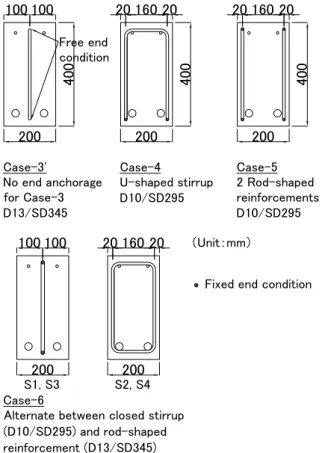
In these four additional cases, the axial shear rein-forcement interval was held at 200 mm, and the shear reinforcement shapes and positions are as shown in Fig. 18. Case-3' has the same arrangement as Case-3 with the rod-shaped reinforcement in the center of the width di-rection, but without the anchorage of the ends. Here, the link elements at the ends of rod-shaped reinforcement were modeled to be free end conditions. Case-4 has U-shaped stirrups in inverted orientation when compared with Case-2, providing a case like the closed stirrup of Case-1 but without a lower horizontal leg. Case-5 is like a closed stirrup with no upper and lower horizontal legs; that is, the shear reinforcement consists of rod-shaped reinforcements arranged in two rows in the cross section. Case-6 represents an alternating arrangement, with rod-shaped reinforcements at S1 and S3 and closed stir-rups at S2 and S4. This situation where two types of shear reinforcements are arranged occurs when post-construction
shear strengthening (Kawamura et al. 2013, 2020) is conducted on an existing RC structure with a small amount of shear reinforcement. In the analysis, the link elements at all shear reinforcement ends in Case-4 to 6 are defined as fixed end conditions. In these four addi-tional cases, the material properties of shear reinforce-ment are the same as in Cases-1, 2 and 3. The diameter of the shear reinforcement is D13/SD345 for one row in the cross section and D10/SD295 for two rows in order to match the amount of reinforcement with that in the other cases.
5.2 Analytical results of shear capacity and crack patterns
Figure 19 shows the relationship between the load and the vertical displacement at the loading point for the four new cases, together with the results for Cases-1, 2 and 3. The curves before and after the occurrence of diagonal cracking are similar to Cases-1, 2 and 3, but the results indicate that rigidity and the maximum load differ among the cases. In Cases-4 and 5, where the shear reinforce-ment yielded in the analysis, the timing is indicated by arrows in the figure.
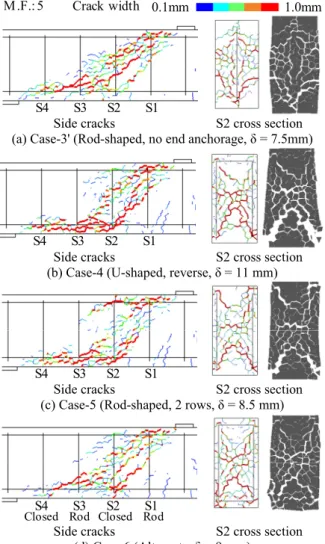
Figure 20 shows the cracking on the side face at the time when the load has decreased by about 70% from the maximum load, along with the cracks and deformations in the cross section at the S2 shear reinforcement point. Figure 21 shows the results of decoupling the shear resistance mechanisms in each case, and the decoupled shear forces at the maximum load are shown in Table 4.
In Case-3', where rod-shaped reinforcement ends are not anchored, the failure situation is similar to that in Case-3 (where there are end anchorages), but the maximum load is 4% lower. This is mainly due to the decrease in VS. This demonstrates that the VS contri-bution is increased by anchoring the ends, as with plate-anchored PHBs. 200 400 Case-3' No end anchorage for Case-3 D13/SD345 (Unit:mm) 20 160 20 200 400 200 400 Case-4 U-shaped stirrup D10/SD295 Case-5 2 Rod-shaped reinforcements D10/SD295 Case-6
Alternate between closed stirrup (D10/SD295) and rod-shaped reinforcement (D13/SD345) 200 200 20 160 20 20 160 20 100 100 100 100 S1, S3 S2, S4
Fixed end condition Free end
condition
Fig. 18 Cross sections of additional cases for analysis.
0 100 200 300 0 2 4 6 8 10 Lo ad (k N )
Vertical displacement at loading point (mm)
Case-1 (Closed) Case-2 (U-shaped) Case-3 (Rod-shaped) Case-3' (No end anchorage) Case-4 (U-shaped, reverse) Case-5 (Rod-shaped, 2 rows) Case-6 (Alternate)
Additional 4 cases
All analytical results
Case-4 S1 : yield
Case-4 S2 : yield
Case-5 S1 : yield
Case-5 S2 : yield
Case-4, with no lower horizontal leg, has lower rigid-ity after diagonal crack occurrence than Cases-1 and 2. The maximum load is 14% lower than in Case-1, a slightly greater reduction in load than in Case-2, which has no upper horizontal leg. In the failure situation, a crack that expands from the center of the cross section to near the lower end of the shear reinforcement opens wide, and the lower half of the beam expands greatly in the width direction. In Case-2, which has no upper horizontal leg, the arch action contribution decreases, but in Case-4, which has no lower horizontal leg, the beam action con-tribution decreases. It is considered that the influence of lack of confinement in the region surrounding the main tensile reinforcement is apparent.
Case-5, with no upper or lower horizontal leg, has a lower maximum load than Cases-2 and 4, both of which have one horizontal leg. In the failure situation, diagonal cracks that occur at the center of the cross section are wide open as they extend to the vicinity of the upper and lower ends of the rod-shaped reinforcements. As a result, widthwise deformation occurs over the entire height of the beam. Compared with Case-1, which has closed stirrups, both the beam and arch action contributions are
reduced. In addition, as in Case-3, where one PHB is arranged in the center, the diagonal cracks do not inter-sect with the shear reinforcement, leading to reduced VS. On the other hand, though rod-shaped reinforcements are both arranged as the sole shear reinforcements for Case-3 as well as for Case 5, the location of these bars are dif-ferent between the cases. In Case-3, one bar is arranged in the center of the width direction, while in Case-5, the bars are placed near both sides. This indicates that there is a clear difference in the crack patterns in the cross-section. Looking at the top surface, axial cracks occurred on the top surface in Case-3, but no axial cracks occurred in Case-5 because the crack propagated toward the corner. As a result, wide cracks appeared along the tensile and compressive reinforcements in the side of Case-5. The maximum load of Case-3 with axial cracks on the top surface is 4% lower than that of Case-5, in-dicating that the difference in the position of the rod-shaped reinforcements in the width direction also influences the shear failure behavior.
Case-6, in which rod-shaped reinforcements and closed stirrups are arranged alternately, results in the maximum load intermediate between Case-1 (closed) and Case-3 (rod-shaped). The contributions of the beam and arch actions are also intermediate between the two cases.
These analytical studies show that the contribution made by arch action decreases when there is no upper horizontal leg to confine the compression side of the RC beam, while the beam action contribution decreases when there is no lower horizontal leg to confine the ten-sion side. This clarifies the functions of the upper and lower horizontal legs of the stirrups. In addition, it is
0.1mm 1.0mm
Crack width M.F.: 5
S4 S3 S2 S1
Side cracks S2 cross section (a) Case-3' (Rod-shaped, no end anchorage, δ = 7.5mm)
S4 S3 S2 S1
Side cracks S2 cross section (b) Case-4 (U-shaped, reverse, δ = 11 mm)
S4 S3 S2 S1
Side cracks S2 cross section (c) Case-5 (Rod-shaped, 2 rows, δ = 8.5 mm)
S4 S3 S2 S1
Closed Rod Closed Rod
Side cracks S2 cross section (d) Case-6 (Alternate, δ = 9 mm)
Fig. 20 Side face cracking and S2 cross section defor-mation and cracks.
0 100 200 0 2 4 6 8 10 Sh ea r fo rc e ( kN ) Vertical displacement (mm) Shear force Beam+Arch Beam Arch Truss (a) Case-3' (Rod, no end anchorage)
0 100 200 0 2 4 6 8 10 Sh ea r fo rc e ( kN ) Vertical displacement (mm) Shear force Beam+Arch Beam Arch Truss (b) Case-4 (U-shaped, reverse) 0 100 200 0 2 4 6 8 10 Sh ea r fo rc e ( kN ) Vertical displacement (mm) Shear force Beam+Arch Beam Arch Truss (c) Case-5 (Rod-shaped, 2 rows) 0 100 200 0 2 4 6 8 10 Sh ea r fo rc e ( kN ) Vertical displacement (mm) Shear force Beam+Arch Beam Arch Truss (d) Case-6 (Alternate, Rod and Closed) Fig. 21 Decoupled shear resistance mechanisms.
shown that VS decreases when the rod-shaped rein-forcements have no end anchorages, thereby clarifying the effect of the end anchorages. Furthermore, it is clari-fied that the difference in the position of the rod-shaped reinforcements in the width direction also influences the shear failure behavior.
5.3 Out-of-plane displacement on side face near the top surface
In this section, the relationship between the shear rein-forcement shapes and the out-of-plane displacement is discussed based on the analytical results in Case-1 (closed stirrups), Case-3 (rod-shaped reinforcements), and Case-6 (alternate arrangement). Figure 22 shows the out-of-plane displacements near the top surface at the time before and after the maximum load occurred in the load-displacement relationship (Figs. 6 and 19). The experimental results in Cases-1 and 3 at the same vertical displacement are also shown.
In Case-1 with closed stirrups, the displacement in-creases locally due to compressive failure near the loading point after the maximum load. Although the displacement obtained from analysis is slightly larger than the experimental result due to the different load values, the range with large displacement is still in agreement with the experiment.
In Case-3 with rod-shaped reinforcements, the dis-placement increased significantly in a wide range from the loading point to the location around S3 after reaching the maximum load. This behavior is not caused by compressive failure, but by the vertical cracking in the cross-section since the shear reinforcements do not have any horizontally restraining parts. As in Case-1, the area where relatively large displacement occurred is in good agreement with the experiment.
In Case-6, with alternating rod-shaped reinforcements and closed stirrups, the range of significant displacement increases, and the amount of displacement lies between the displacement of Cases-1 and 3. Additionally, the displacement decreases remarkably around the location of S2. It is considered that the closed stirrup arranged at the S2 position prevented the propagation of vertical cracking. The suppression of vertical crack propagation and the horizontal displacement results in a larger
maximum load.
It is shown that there is a difference in the out-of-plane displacement of RC beams depending on the shear re-inforcement shapes and its arrangement, and that also influences the maximum load, behavior of which is similar to what is discussed in Section 4.3. This indicates that the reinforcement arrangement and the shape to suppress the horizontal displacement are important to ensure the shear capacity calculated by a design equation.
6. Conclusions
In this study, the effect of different shear reinforcement shapes on the shear failure behavior of RC beams and shear resistance mechanism is investigated analytically using 3-D RBSM to simulate experimental loading tests on RC beam specimens. The main conclusions obtained are as follows. It should be noted that this study was carried out using RC beams of small width in relation to cross-sectional height. As a result, the effect of defor-mation in the width direction is likely to be readily ap-parent. Confirmation is needed as to whether the shear failure behavior would be different in the case of rela-tively wide beam members and wall members with large width constraints. In addition, this study was carried out under the condition of a d = 2.86. If the shear failure / mode differs at various values of /a d, a further study is necessary.
(1) As in the experiment, the maximum load obtained from analysis is greatest for a beam with closed stir-rups, followed by U-shaped stirrups and then rod-shaped reinforcements.
(2) Internal crack patterns differ greatly depending on the shear reinforcement shape. If deformation occurs in the beam width direction, the shear capacity is re-duced. This is similar to the behavior confirmed in the experiment, and it was shown that this is a me-chanical phenomenon that can be reproduced nu-merically.
(3) By decoupling the shear resistance mechanism, dif-ferences in the arch action contribution at the maxi-mum load were made clear. Arch action is affected by the internal crack pattern and deformation in the width direction. It is inferred that the confinement by
-2 -1 0 1 2 3 LP S1 S2 S3 S4 SP W idt h di sp . (m m ) Position δ=6mm Ana. δ=9mm Ana. S1,S3 : Rod-shaped S2,S4 : Closed SP: Support point LP: Loading point -2 -1 0 1 2 3 LP S1 S2 S3 S4 SP W idt h di sp . (m m ) Position δ=5mm Exp. δ=8mm Exp. δ=5mm Ana. δ=8mm Ana. -2 -1 0 1 2 3 LP S1 S2 S3 S4 SP W idt h di sp . (m m ) Position δ=7mm Exp. δ=10mm Exp. δ=7mm Ana. δ=10mm Ana.
: Range with large displacement before and after maximum load
(a) Case-1 (Closed) (b) Case-3 (Rod-shaped) (c) Case-6 (Alternate) Fig. 22 Out-of-plane displacement on the side face near the top surface.
the horizontal legs of the shear reinforcement has a great influence on this. Additionally, it was shown that, in the case of a rod-shaped reinforcement ar-ranged in the center of cross section width, diagonal cracks do not intersect with the shear reinforcement and VS decreases, the same conclusion as observed in the experimental study.
(4) It was clarified that if the shear reinforcement has no upper horizontal leg to confine the compression side of the RC beam, arch action is reduced. If there is no lower horizontal leg confining the tension side, then beam action is reduced. Further, it was clarified that
S
V decreases when rod-shaped reinforcement with-out end anchorages is used.
(5) Even if the same rod-shaped reinforcement is used as the shear reinforcement but the bars are arranged in different positions in the width direction, the crack patterns in the cross section and the shear capacity are different. The analytical results show that the differ-ence in the position also infludiffer-ences the shear failure behavior.
(6) From the analytical result of the case with alternating closed stirrups and rod-shaped reinforcements, it was shown that there was a close relationship between the shear capacity and the deformation of RC beams spreading in the width direction. This indicates that the combination with closed stirrups is better rebar arrangement to demonstrate the ability of rod-shaped reinforcement, when the reinforcement is applied for shear strengthening.
References
ACI, (2015). “Building code requirements for reinforced
concrete (ACI Code-318M-14).” Farmington Hills,
Michigan, USA: American Concrete Institute. Bolander, J. E. and Hong, G. S., (2002). “Rigid-body-spring
network modeling of prestressed concrete members.”
ACI Structural Journal, 99(5), 595-604.
Ferreira, M. P., Melo, G. S., Regan, P. E. and Vollum, R. L., (2014). “Punching of reinforced concrete flat slabs with double-headed shear reinforcement.” ACI
Structural Journal, 111(2), 363-374.
fib, (2013). “fib model code for concrete structures 2010.” Lausanne, Switzerland: Fédération Internationale
du Béton.
Fu, L., Nakamura, H., Yamamoto, Y. and Miura, T., (2017). “Investigation of influence of section pre-crack on shear strength and shear resistance mechanism of RC beams by experiment and 3-D RBSM analysis.”
Journal of Advanced Concrete Technology, 15(11),
700-712.
Fu, L., Nakamura, H., Yamamoto, Y. and Miura, T., (2020). “Effect of various structural factors on shear strength degradation after yielding of RC members under cyclic loads.” Journal of Advanced Concrete
Technology, 18(4), 211-226.
Gedik, Y. H., Nakamura, H., Yamamoto, Y., Ueda, N. and Kunieda, M., (2012). “Effect of stirrups on the
shear failure mechanism of deep beams.” Journal of
Advanced Concrete Technology, 10(1), 14-30.
Gunawan, D., Okubo, K., Nakamura, T. and Niwa, J., (2020). “Shear capacity of RC beams based on beam and arch actions.” Journal of Advanced Concrete
Technology, 18(3), 241-255.
JSCE, (2018). “Standard specifications for concrete
structures - Design.” Tokyo: Japan Society of Civil
Engineers. (in Japanese)
Kawamura, K., Fukuura, N., Okamoto, S. and Shindoh, T., (2013). “Seismic retrofitting method for underground reinforced concrete structures by embedding plate anchored shear reinforcement bars.” In: Proceedings
of the 3rd International Conference on Sustainable Construction and Technologies - SCMT3, Kyoto 18-21
August 2013. Tokyo: Japan Concrete Institute, 290. Kawamura, K., Hata, A., Kanno, M. and Yoshihara, K.,
(2020). “New high-workability seismic retrofitting techniques for existing reinforced concrete structures.”
Internet Journal of Society for Social Management Systems, 12(2), 108-118.
Kawamura, K., Takemura, M., Nakamura, H. and Miura, T., (2021). “Experimental study on the effect of different shear reinforcement shapes on shear failure behavior and internal crack pattern of RC beams.”
Journal of Advanced Concrete Technology, 19(1),
82-94.
Kim, D., Kim, W. and White, R. N., (1999). “Arch action in reinforced concrete beams - A rational prediction of shear strength.” ACI Structural Journal, 96(4), 586-593.
Kumagai, K., Nakamura, T., Sakamoto, J., Takeda, H. and Niwa, J., (2017). “Effect of post shear reinforcing methods with plate and head anchored shear reinforcing bars.” In: D. A. Hordijk and M. Luković, Eds. Proceedings of the 2017 fib Symposium, Maastricht, The Netherlands 12-14 June 2017. Berlin: Springer, 667-675.
Lequesne, R. D., O’Reilly, M., Darwin, D., Lepage, A., Al-Sabawy, A., Guillen, E. and Spradling, D., (2018). “Use of headed bars as shear reinforcement (SM report No. 126).” Lawrence, Kansas. USA: University of Kansas Center for Research, Inc.
Lubell, A. S., Bentz, E. C. and Collins, M. P., (2009). “Headed shear reinforcement assemblies for one-way shear.” ACI Structural Journal, 106(6), 878-886. Nakamura, E. and Watanabe, H., (2006). “Shear resisting
mechanism in RC beams with fractured stirrups.” In:
Proceedings of the 22nd US-Japan Bridge Engineering Workshop, Seattle, Washington, USA 23-28 October
2006, 50-60.
Nakamura, H., Iwamoto, T., Fu, L., Yamamoto, Y., Miura, T. and Gedik, Y. H., (2018). “Shear resistance mechanism evaluation of RC beams based on arch and beam actions.” Journal of Advanced Concrete
Technology, 16(11), 563-576.
Okamura, H. and Maekawa, K., (1991). “Nonlinear
concrete.” Tokyo: Gihodo Shuppan.
Park, R. and Paulay, T., (1975). “Reinforced concrete
structures.” New York: John Wiley & Sons.
Shima, H., Chou, L. L. and Okamura, H., (1987). “Micro and macro models for bond in reinforced concrete.”
Journal of the Faculty of Engineering, The University of Tokyo, Series B, 39(2), 133-194.
Thompson, M. K., Jirsa, J. O., Breen, J. E. and Klingner, R. E., (2002). “Anchorage behavior of headed
reinforcement - Literature review (Research report No.
1855-1).” Austin, Texas, USA: University of Texas at Austin.
Usman, F., Nakamura, H., Miura, T. and Yamamoto, Y., (2020). “Proposal of bond behavior simulation model by using discretized Voronoi mesh for concrete and beam element for reinforcement.” Cement and Concrete
Composites, 110(7), 103593.
Wright, J. L. and McCabe, S. L., (1997). “The development
length and anchorage behavior of headed reinforcing bars (SM report No. 44).” Lawrence, Kansas, USA:
University of Kansas Center for Research, Inc. Yamada, Y., (2019). “An analytical study on interactions
of artificial cracks and holes contributing to increases in the shear strengths of RC beams.” Journal of
Advanced Concrete Technology, 17(10), 579-591.
Yamamoto, Y., Nakamura, H., Kuroda, I. and Furuya, N., (2008). “Analysis of compression failure of concrete by three-dimensional rigid body spring model.”
Journal of JSCE, Ser. E, 64(4), 612-630. (in
Japanese)
Yamamoto, Y., Nakamura, H., Kuroda, I. and Furuya, N., (2010). “Analysis of uniaxial compression failure of confined concrete by three dimensional rigid body spring model.” Journal of JSCE, Ser. E, 66(4), 433-451. (in Japanese)
Yamamoto, Y., Nakamura, H., Kuroda, I. and Furuya, N., (2014). “Crack propagation analysis of reinforced concrete wall under cyclic loading using RBSM.”
European Journal of Environmental and Civil Engineering, 18(7), 780-792.