熊本大学学術リポジトリ
Solvent and pressure effects on the photoluminescence in porous Si
journal or
publication title
Journal of Applied Physics
volume 78
number 5
page range 3520‑3522
year 1995‑09‑01
その他の言語のタイ トル
ポーラスシリコンのフォトルミネッセンスに対する 液媒体および圧力の効果
URL http://hdl.handle.net/2298/9651
doi: 10.1063/1.359988
Reprinted from
OURNALOF
APPLIED PHYSICS
Vol. 78, No. 5, 1 September 1995
Solvent and pressure effects on the photoluminescence in porous Si
Noritaka Kuroda, Yashuhiro Matsuda, Shinya Nakajima, and lori Taketsu
Institute for Materials Research, Tohoku University, 2-1-1 Katahira, Aoba-ku, Sendai 980-77, Japan Norio Ookubo
NEC Fundamental Research Laboratories, 4-1-1 Miyazaki, Miyamae-ku, Kawasaki 216, Japan pp. 3520-3522
AMERICAN INSTITUTE 2£PHYSICS
Solvent and pressure effects on the photoluminescence in porous Si Noritaka Kuroda,a) Yashuhiro Matsuda, Shinya Nakajima, and lori Taketsu
Institute for Materials Research, Tohoku University, 2-1-1 Katahira, Aoba-ku, Sendai 980-77, Japan Norio Ookubo
NEC Fundamental Research Laboratories, 4-1-1 Miyazaki, Miyamae-ku, Kawasaki 216, Japan (Received 15 March 1995; accepted for publication 16 May 1995)
The photoluminescence band in porous Si is found to shift monotonically toward lower energy at a rate of -(18±5) meV/GPa if a hydrostatic pressure of up to 5 GPa is applied with liquid argon, in contrast to a convex behavior of the shift observed when a methanol-ethanol mixture is used as the pressure-transmitting medium. The data show that the electronic energy gap relevant to the luminescence is intrinsically reduced by the hydrostatic compression but has a distinct solvatochromic character. © 1995 American Institute of Physics.
Photoluminescence (PL) in porous Si is known to be
sensitive to hydrostatic pressure.1"6 Despite a great deal of
effort, the pressure dependence of the peak position is not established yet because the reported data differ from author to author. We meet similar difficulty in identifying the origin of the PL itself. So far a variety of experimental studies have provided evidence for the quantum size effect of Si
nanocrystallites.7 Nevertheless, since the characteristics of
PL are critically dependent on sample preparation and pro cessing methods, there remain alternative arguments about
the origin of PL.8'9
It has been realized that porous Si is adsorbent of or ganic molecules, and that the PL spectrum is affected by the
adsorption.10"13 This phenomenon suggests that PL has a sol
vatochromic character originating from contact interaction between the pore surface and organic solvent. In a high- pressure optical experiment, an organic fluid such as a mix ture of methanol and ethanol is usually used as the pressure- transmitting medium. Therefore, the observed pressure effects could partly be due to the solvatochromic effects.
In this article we present new data on the solvent and hydrostatic pressure effects. In the pressure experiment we employ condensed argon, as well as a methanol-ethanol mixture, for the first time as the pressure-transmitting me dium. Since argon is inert and known to function well as the hydrostatic medium not only in the liquid phase but also in the solid phase above 1.2 GPa, it allows one to explore the intrinsic effects of hydrostatic pressure. Our concern is to see how the pressure dependence of PL is influenced by the sol- vatochromism.
Free-standing porous Si films with a weight porosity of 65% are prepared from p-type (100) substrates with a resis tivity of 10 fl cm by the same method as described in Refs.
6 and 11. The thickness of the films ranges from 10 to 100 /jm. We deal mainly with the samples for which no inten tional oxidation is made during the preparation. In this article we refer to those unoxidized samples unless otherwise noted.
For the sake of comparison we deal with the following two kinds of oxidized samples: one is obtained by illuminating the as-grown films with a tungsten-halogen lamp for 24 h
"^Electronic mail; [email protected]
while immersing them in water at room temperature; another sample is obtained by exposing as-grown films to O2 atmo sphere at 750 °C for 30 s. The samples are evacuated for at least 1 h prior to the PL measurement.
Pressure is generated with a diamond anvil cell. To liq uefy argon in the pressure cell we have the argon gas flowing in the diamond anvil cell while cooling the cell with liquid nitrogen. The detail of the apparatus will be described
elsewhere.14 The 488 nm light of an Ar-ion laser is used to
excite the luminescence. The luminescent light is collected with an infrared microscope (Olympus IR), and is fed into a polychromator (Ritu MC30ND) through an optical cable of bundled silica fibers. The dispersed light is detected with, a CCD camera (Photometries CH250). The spectral sensitivity of the system is calibrated using a standard lamp (Optronic OL245C). The value of pressure is obtained by the ruby- fluorescence method. All the measurements are performed at room temperature.
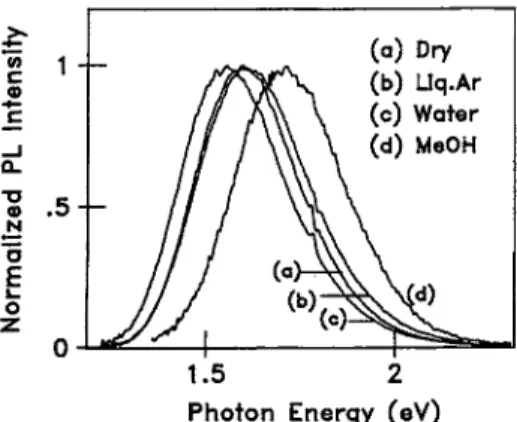
Figure 1 shows the PL spectra taken while keeping the samples dry, wetted with water and methanol, and immersed in liquid argon at 0.3 GPa. At 1 atm the peak position of the dry sample is located around 1.6 eV. We note that at a suffi ciently low pressure liquid argon does not cause significant changes in the spectrum, as expected. Water and benzene cause only a small shift of ±0.05 eV at most. If methanol is occluded, on the other hand, the spectrum shifts toward higher energy by about 0.14 eV; furthermore, the intensity is reduced by an order of magnitude. Similar changes occur also if ethanol is occluded. Figures 2 and 3 show the peak position and intensity, respectively, relative to the values of dry samples at 1 atm, where the electric dipole moment of solvent molecule is chosen as the variable. The solvato- chromism due to methanol and ethanol is remarkable. In Figs. 2 and 3 are plotted for comparison the results concern ing the main PL band of oxidized samples. In the oxidized samples the solvent effects are weak and rather independent of the species of the solvent. Evidently the pore surface is protected from solvents by oxide.
Figure 4 shows the PL spectra at several pressures in the environments of argon and a methanol-ethanol 4:1 mixture.
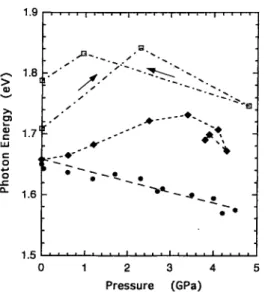
We see that the peak position exhibits a weak red shift if the sample is pressurized with argon. As shown in Fig. 5 the pressure coefficient of the shift is -(18±5) meV/GPa. In
3520 J. Appl. Phys. 78 (5), 1 September 1995 0021 -8979/95/78(5)/3520/3/$6.00 © 1995 American Institute of Physics
PLIntensity
o z.o
1 -
.5-
0-
- i
1.5 Photon
(a) Dry
\ (b) Uq.Ar
y \ (c) Water
^\ V (d) MeOH
2 Energy (eV)
10 L| !■..,,■■■
FIG. 1. Normalized PL spectra of unoxidized porous Si taken while keeping the sample (a) dry at 1 atm, (b) immersed in liquid Ar at 0.3 GPa, and wetted with (c) water and (d) methanol at 1 atm. The relative normalization factors are 1.0,0.54,0.69, and 0.07 for (a), (b), (c), and (d), respectively, within the accuracy of ±30%.
contrast, if the methanol-ethanol mixture is used, the peak position shifts toward higher energies with increasing pres sure, reaching a maximum around 2 GPa followed by a low- energy shift at higher pressures. In addition, the intensity is reduced further. Compared to the results obtained with argon, it is apparent that pressure enhances the solvatochromism due to the methanol-ethanol mixture. To see the effects of adsorption of water, we have measured PL of the unevacu- ated samples, which may be adsorbed with atmospheric moisture, by using argon as the pressure medium. An ex ample of the results is shown in Fig. 5.f The peak position clearly exhibits blue shift, while the degree depends on samples.
In the present experiment we monitor the near-edge in terband absorption spectrum whenever the experimental con dition is changed. In all the cases only a subtle change occurs in the photon energy and exponential slope of the interband
150 ■ i .... i ... . i
-50
\
Benzene Ethanol Methanol-
1 2
Dipole Moment (Debye)
FIG. 2. Shift of the peak position of PL of (O) unoxidized, (D) illumination-oxidized, and (0) rapid-thermal-oxidized samples vs dipole moment of the solvent molecule.
0.01
b
Benzene Ethanol Methanol
1 2
Dipole Moment (Debye)
FIG. 3. Relative peak intensity of PL of (O) unoxidized, (□) illumination-
♦ oxidized, and (O) rapid-thermal-oxidized samples vs dipole moment of the solvent molecule.
absorption spectrum of an Urbach-type.6 The pressure coef
ficient of the energy gap is estimated to be smaller than —30 meV/GPa. Furthermore, there appear no clear features of subsidiary absorption around the photon energy of the peak position of PL.
Under hydrostatic pressures of the methanol-ethanol mixture the peak energy of PL almost always shows a maxi mum around 2 GPa, as shown in Figs. 4 and 5. The blue shift of order of 0.1 eV at 2 GPa cannot be ascribed to the size effect of nanocrystallites, as mentioned below. In the previ ous studies, therefore, this phenomenon has been interpreted
in terms of the Jahn-Teller effect2 and band-crossover effect3 in nanocrystallites. It is evident, however, from the
present results that the phenomenon is not an intrinsic pres sure effect but is dominated by the contact interaction be tween alcohol and the pore surface. Undoubtedly the remark able reduction of the PL intensity results from dissipation of photoexcited electrons and holes caused by this interaction.
R
VjLMe 2.3
^Me 0 3
-eD
0) 0)
1.5 2
Photon Energy (eV)
FIG. 4. PL spectra of the unoxidized sample under several pressures of argon (Ar) and methanol-ethanol mixture (Me). Numerals denote values of pressure in GPa. A sharp feature R around 1.79 eV is due to the R lines of ruby.
J. Appl. Phys., Vol. 78, No. 5, 1 September 1995 Kuroda et al. 3521
2 3 4 5 Pressure (GPa)
FIG. 5. Peak position of PL vs pressure. The points marked by • and ♦ are the data of the H2O-£ree and H2O-adsorbed samples, respectively, under pressure of argon; D are the data under pressure of a methanol-ethanol mixture. The data at 0 GPa of • and ♦ are taken at 1 atm before liquefying argon in the diamond anvil cell.
The blue shift observed when the H2O-adsorbed sample is compressed with argon must be dominated also by the con tact interaction, which may be related to the large electric dipole moment of the water molecule.
The optical energy gap of amorphous and crystalline Si
has a comparatively weak pressure dependence of —1015 and
— 14 meV/GPa,16 respectively: The eilergy gap of a nano-
crystallite Si is expected to have a negative pressure coeffi cient slightly smaller than the value of crystalline Si, i.e.,
about —10 meV/GPa.5 Our findings of the weak sensitivity
of the PL energy of the H2O free, unoxidized samples to the hydrostatic pressure of argon is reconciled with the notion that PL originates from the nanocrystallites and/or amor phous matrix. The negative pressure coefficient of the ab sorption edge is also in favor of this notion. Another striking finding of the present experiment is the fact that the PL en ergy of the unoxidized samples under pressure is very sensi tive to the pressure-transmitting medium as well as the sur face condition. This fact affirms that the surface of pores is essential to the luminescence processes.
At present a widely accepted empirical model for the luminescence origin is the bound states supported by an in- terfacial, structurally relaxed, Si layer between the core and
surface of nanocrystallites.9'17'18 In addition, the concept of
quantum percolation has been theoretically put forward to explain the stretched-exponential decay behavior of the
afterglow.19*20 This concept concerns the percolation of pho-
toexcited electrons in random networks of -Si-Si- back-
bonds of pores19 or among randomly aggregate nanocrystallites.20 One may easily imagine that the relax
ation processes of electrons are influenced strongly by the presence of polar molecules nearby the percolation paths.
Viewed from the high sensitivity of the peak position and intensity of PL to the polar molecules such as methanol, particularly under high pressures, the quantum percolation concept seems to give a good basis of physical and practical considerations.
Recently Zemari et al.4 have found that PL persists even
in the metallic phase obtained by applying a very high pres sure up to 15 GPa. It is unknown if in that circumstances the above-mentioned interfacial Si layer or the networks of the backbonds remain untransformed and still support the bound states. Therefore, a firm identification of the surface states responsible for PL must await detailed studies on the prop erties of the high-pressure phase.
In conclusion, surface states play an essential role in the luminescence processes of porous Si and thus methanol and ethanol cause a high degree of solvatochromism on the PL spectrum. The behavior of the PL spectrum under the envi ronment of argon demonstrates that the energy gap of the surface states is reduced intrinsically by hydrostatic pressure.
1W. Zhou, H. Shen, J. F. Harvey, R. A. Lux, M. Dutta, F. Lu, C. H. Perry, R. Tsu, N. M. Kalkhoran, and F. Namavar, Appl. Phys. Lett. 61, 1435 (1992).
2X. S. Zhao, P. D. Persans, J. Schroeder, and Y. J. Wu, Mater. Res. Soc.
Symp. Proc. 283, 127 (1993).
3J. M. Ryan, P. R. Wamsley, and K. L. Bray, Appl. Phys. Lett. 63, 2260 (1993).
4J. Zeman, M. Zigone, G. Martinez, and G. L. J. A. Rikken, Europhys. Lett.
26, 625 (1994).
5 J. Camassel, E. Massone, L. Lyapin, J. Allegre, P. Vicente, A. Foucaran, A.
Raymond, and J. L. Robert, Proceedings of the 21st International Confer ence on the Physics of Semiconductors, Beijing, 1992 (World Scientific, Singapore, 1992), p. 1463.
6N. Ookubo, Y. Matsuda, and N. Kuroda, Appl. Phys. Lett. 63, 346 (1993).
7D. J. Lockwood, Solid State Commun. 92, 101 (1994); see also the refer
ences therein.
8G. G. Qin and Y. Q. Jia, Solid State Commun. 86, 559 (1993).
9L. Tsybeskov and P. M. Fauchet, Appl. Phys. Lett. 64, 1983 (1994).
10J. M. Lauerhaas, G. M. Credo, J. L. Heinrich, and M. J. Sailor, Mater. Res.
Soc. Symp. Proc. 256, 137 (1992).
11N. Ookubo, Y. Matsuda, Y. Ochiai, and N. Kuroda, Mater. Sci. Eng. B 20, 324 (1993).
12J. K. M. Chun, A. B. Bocarsly, T. R. Cottrell, J. B. Benziger, and J. C. Yee, Mater. Res. Soc. Symp. Proc. 283, 329 (1993).
13M. Ben-Chorin and A. Kux, Appl. Phys. Lett. 64, 481 (1994).
14 Y. Matsuda and N. Kuroda (unpublished).
15 B. Welber and M. H. Brodsky, Phys. Rev. B 16, 3660 (1977).
16 B. Welber, C. K. Kim, M. Cardona, and S. Rodriquez, Solid State Com mun. 17, 1021 (1975).
l7F. Koch, Mater. Res. Soc. Symp. Proc. 298, 319 (1993).
18 V. Petrova-Koch, T. Muschik, A. Kux, B. K. Meyer, F. Koch, and V.
Lehmann, Appl. Phys. Lett 61, 943 (1992).
19 S. Sawada, N. Hamada, and N. Ookubo, Phys. Rev. B 49, 5236 (1994).
20 M. Ceschini and L. Pavesi, Proceedings of the 22nd International Confer ence on the Physics of Semiconductors, Vancouver, 1994, edited by D. J.
Lockwood (World Scientific, Singapore, 1995), Vol. 3, p. 2165.
3522 J. Appl. Phys., Vol. 78, No. 5, 1 September 1995 Kuroda et al.