研究ノート
How Does a Trilateral Free Trade Agree- ment Lead to Export Growth? Implications from an Analysis of Japan’s Position as an Outsider to the China-Korea Bilateral FTA
i)Iwao Tanaka / Lihong Fang
Japan and South Korea export numerous similar commodities to China. Out of 50 major commodities of the HS 4-digit classifications, 31 were overlapping in 2017. This means that there is severe competition facing both Japanese and Korean firms in the Chinese market. China and Korea agreed on a bilateral Free Trade Agreement (FTA) in 2015, and since then, Japan has been outside of the FTA. Although a Japan-China-Korea trilateral FTA was also proposed and has been dis- cussed at the administrative level since the early 2000s, it has not yet been completed. This study, therefore, aims at theoretically investigat- ing how Japanese industries could be paying the cost as an outsider to the bilateral FTA or could be benefiting from the trilateral FTA.
For this purpose, our focus is particularly placed on the pattern of comparative advantage of Japan and Korea in China. We calculate the revealed comparative advantage (RCA) index and the elasticity of substitution for those 31 commodities. Using the estimated elasticities, we conducted a simulation analysis on how much of the actual de- crease in Japanese exports to China could be attributed to the substi-
Abstract
Key Words: Trade diversion, Comparative advantage, Elasticity of sub- stitution, Japan-China-Korea FTA, Exports to China 1. Introduction
Regional trade agreements have been burgeoning around the world in our modern age. Many countries are now involved in multiple Free Trade Agreements (FTAs), and some FTAs are about to converge into an even larger arrangement, frequently called a mega FTA. One such example is the Trans-Pacific Partnership agreement (TPP). When Mr. Trump be- came president of the United States in 2017, however, the U.S. decided to withdraw from the TPP. This incident implied that the U.S. appeared to turn its policy from freer trade to a more protectionist approach, and that there are costs and benefits when making a preferential trade agreement.
The Japanese government had often argued whether TPP could bring more benefits than costs to its economy before the agreement was signed among 11 countries.
When we evaluate the welfare effects of FTA, trade creation and trade tution by Korean exports between 2013 and 2017. Our HS 6-digit com- modity analysis shows that for some type of polyesters (HS390799)
and plastics (HS392010) exported from Japan, about 3 and 11 percent- age of the decreases, respectively, could be attributed to exports di- verted to Korea. Since these commodities have lower RCA indices in terms of the Chinese market compared to the world market with low- er elasticity of substitution, the potential competitiveness of Japanese exports would be overlooked under the bilateral FTA, and if the tri- lateral or even larger FTA came into effect, their exports might grow.
(JEL Classification Code: F15, F17)
diversion effects are of importance. But it is also indispensable to see the costs of being outside of an agreement for the third country. For example, China and Korea made a bilateral FTA effective in December 2015. On the other hand, to date, Japan does not have a bilateral FTA either with China or Korea. The three countries have long been trying to make the trilateral FTA since 2001 but have not yet concluded it. Japan is currently outside of the China-Korea FTA, and its economy is expected to be negatively im- pacted by being a third country. Data shows that trade between China and Korea has increased, whereas the trade between Japan and China, and between Japan and Korea have both decreased in recent years. Ac- cording to the Ministry of Foreign Affairs of Japan, the Japanese Govern- ment considers that the trilateral FTA is purported to be beneficial for the Japanese economy. This is because China and Korea both have a sig- nificant GDP in the world standings and they are the first and third big- gest trading partners with Japan. Madhur (2013) argues that the agree- ment can be one of the steps toward an even larger agreement, such as the Regional Comprehensive Economic Partnership (RCEP) and Free Trade Area of the Asia-Pacific (FTAAP).ii) Thus, Japan should pay more attention to speeding up the process of negotiations toward the trilateral agreement. This study aims at investigating to what extent the bilateral China-Korea FTA has a negative effect on Japanese exports and how the FTA could provide evidence to support a trilateral or even larger trade agreement.
Welfare analysis is the main analytical tool of a preferential trade agree- ment. In the literature, Caves, Frankel, and Jones (2002) explain that the welfare effects of an FTA and Customs Union (CU) are the total of trade creation and trade diversion effects and terms of trade effect. Baldwin and Venables (1995) show that the free trade welfare effects are decomposed
into three parts: the effects in terms of perfect competition, which corre- spond to what Caves et al. explained, the effects of increasing returns-to- scale and imperfect competition, and the effects of accumulation of factors.
Based on those theories, Melchior (2018) conducts estimation and simula- tion with a world trade model. Clausing (2001) analyzed the trade creation and trade diversion effects of the U.S.-Canada FTA and concluded that the former effects exceeded the latter. A macro impact of the Japan-China-Ko- rea trilateral FTA has also been estimated in studies, one of which reports that welfare gains would be about 20 billion U.S. dollars for Japan while welfare loss to the U.S. would amount to nearly 4 billion U.S. dollars (Abe, Urata, and NIRA, 2008). Ishikawa, Umada, and ITI (2015) show that the trilateral FTA would increase the Japanese real GDP by 0.75%, compared to the FTAAP that would increase it by 1.36%, and the TPP which in- creasing it by 0.54%. Concerning the impact of the China-Korea FTA on the third country, Okuda (2010) and Okuda and Watanabe (2011) show that the overall impact on Japanese economy would be about negative 7 billion U.S. dollars.
Various kinds of manufacturing commodities are commonly exported to China both from Japan and Korea. In this circumstance the China-Korea FTA induces the condition of competition to change in a different way for Japanese and Korean firms. A trade theory simply suggests that under free trade, an industry with a comparative advantage increases its export, whereas an industry without a comparative advantage decreases it. We suppose that a Japanese industry which does not have a comparative ad- vantage over a Korean counterpart in China but does have a comparative advantage in the world may have decreased its export by being outside of the bilateral FTA, or by being diverted to Korean exports. If Japan joins with the two countries in some free trade arrangement, the industry
would be able to increase its export to China since the industry is already competitive worldwide.
In the empirical analysis, we first calculate a revealed comparative ad- vantage (RCA) index to measure the relative competitiveness of Japanese exports over Korea. It is possible that a Japanese industry is competitive but forced to reduce exports by tariffs being kept high while tariffs for Korea are being reduced due to the FTA. Thus, we calculate RCA in two ways: one is for the world, and the other for China. We then estimate the elasticity of substitution between Japanese exports and Korean ones to China. Using these estimated elasticities, we conduct a simulation on how much of the Japanese export was decreased because of the tariff reduction of China’s imports from Korea. Based on the HS 4-digit commodity classifi- cations, we find that 8 Japanese industries out of 31 have lower values of RCA in China while having higher values of RCA in the world market.
The simulated amount of export decrease due to the trade diversion is computed at the HS 6-digit commodity classifications and shown as a ratio over the actual export decrease. We find that for some type of polyesters
(HS390799) and plastics (HS392010), the ratios are about 3 and 11%, re- spectively, which implies that these industries may experience a negative impact of being an outsider to the bilateral FTA. The past studies rarely consider the pattern of comparative advantage in their FTA analyses, and thus, we argue that our study can add new insights to the literature.
The rest of the paper is as follows. The next section presents the recent trends in GDP and trade for Japan, China, and Korea. The research frame- work is given in Section 3, and the results of data analysis and simulation are shown in Section 4, and Section 5 concludes the paper.
2. Trends in real GDP and international trade among Japan, China, and Korea
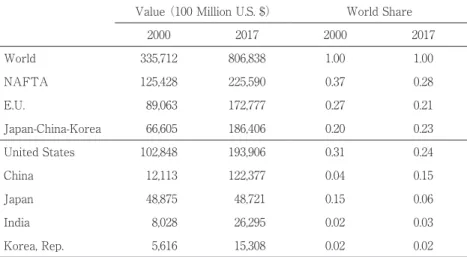
The three countries, Japan, China, and Korea are geographically very closely located and have been developing and maintaining economic rela- tionships for a long time, even without any official legal set-up. Table 1 shows that the economic size of those countries is very large: in 2017, Chi- nese real GDP was about 12 trillion U.S. dollars, the world’s second largest, and Japanese real GDP was about 4.9 trillion U.S. dollars, next to China.
Korean real GDP was about 1.5 trillion U.S. dollars, ranked 14th in the world. As a result, the combined amount of the three countries becomes over 18 trillion U.S. dollars, accounting for 23% of the world GDP, smaller than NAFTA’s share but greater than the E.U. share.
The three countries trade a substantial amount of goods with each oth-
Table 1. Real GDP and Its Share: NAFTA, EU, Japan-China-Korea combined, and selected countries, in 2000 and 2017, Current U.S. Dollars
Value (100 Million U.S. $) World Share
2000 2017 2000 2017
World 335,712 806,838 1.00 1.00
NAFTA 125,428 225,590 0.37 0.28
E.U. 89,063 172,777 0.27 0.21
Japan-China-Korea 66,605 186,406 0.20 0.23
United States 102,848 193,906 0.31 0.24
China 12,113 122,377 0.04 0.15
Japan 48,875 48,721 0.15 0.06
India 8,028 26,295 0.02 0.03
Korea, Rep. 5,616 15,308 0.02 0.02
Source: World Bank, http://databank.worldbank.org/data/source/world-development-indicators#.
er, as is consistent with the gravity hypothesis of International Trade the- ory. Those countries which are in close proximity to each other trade with each other more than they do with countries which are further away. For Japan, China, and Korea, they are also mutually important trade partners.
The two countries are usually listed within the top five countries for the third country both in exports and imports. Potential economic benefits of forming the trilateral FTA among these three countries would be consid- ered significant. In this section, therefore, we will focus on two aspects of trade patterns: first, the change in the relative significance of Japanese ex- ports to China compared to that of Korea due to the China-Korea FTA;
and second, the similarity of the industry’s structure between Japanese and Korean exports to China.
Figure 1 depicts the trends in Japanese and Korean exports to China Figure 1. Recent Trends in Exports to China: Japan and Korea, 100 million U.S.
Dollars
Sources: Ministry of Finance, Trade Statistics, Trade Statistics of Japan, Korean International Trade Association.
(100 Million U.S.$)
from 2010 to 2017. In 2013 exports from Korea overtook those from Japan and the former continues to exceed the latter. It was the year 2015 when the China-Korea bilateral FTA was completed, but the increase in Korean exports to China started a few years earlier. Its exports slightly decreased in 2015 and 2016iii) and increased again in 2017. During the downturn peri- ods Korean exports were still larger than Japanese ones.
Table 2 presents a trade matrix among the three countries. Panel A shows percentage changes in exports between 2007 and 2012 on the left- hand side, and those changes between 2012 and 2017 on the right-hand side. During the first period, each of the three countries increased exports with the partner countries. During the second period, however, Japanese exports both to China and Korea, and Chinese and Korean exports to Ja- pan all decreased. On the contrary, exports between China and Korea in- creased. Panel B shows percentage changes in imports among the three
Table 2. Trade Matrix: Japan, China, and Korea, Percentage Change (%)
Panel A. Exports 2007―2012
Exporter
to 2012―2017
Exporter
to
Japan China Korea Japan China Korea
Japan ― 31.9 13.4 Japan ― -1.1 -13.3
China 48.4 ― 56.2 China -9.2 ― 17.6
Korea 47.1 63.8 ― Korea -31.6 5.1 ―
Panel B. Imports 2007―2012
Importer
from 2012―2017
Importer
from
Japan China Korea Japan China Korea
Japan ― 47.5 48.4 Japan ― -12.8 -30.6
China 32.7 ― 60.1 China -6.7 ― 6.6
Korea 14.4 28.2 ― Korea -15.5 20.1 ―
Sources: Downloaded from the IMF: http://data.imf.org/regular.aspx?key=61013712.
Table 3. Top 10 Commodities Exported to China by Japan and Korea, HS 4-digit Classifications, 2017
A. Japanese Exports B. Korean Exports
HS Code Commodity Name Value (1000
U.S. $) HS Code Commodity Name Value (1000
U.S. $)
1 8708 Motor vehicles; parts and accessories, of
heading no. 8701 to 8705 7231611 8542 Electronic integrated circuits 35188042
2 8542
Electronic integrated circuits
6993078 9013
Liquid crystal devices not constituting ar- ticles provided for more specifically in other headings; lasers, not laser diodes;
other optical appliances and instruments n.e.c. in this chapter
9753465
3 8486
Machines and apparatus of a kind used solely or principally for the manufacture of semiconductor boules or wafers, semi- conductor devices, electronic integrated circuits or flat panel displays; machines and apparatus specified in note 9-C to this Chapter
6557634 2902
Cyclic hydrocarbons
8203799
4 0000 Re-exports
6434389 2710
Petroleum oils and oils from bituminous minerals, not crude; preparations n.e.c, containing by weight 70% or more of pe- troleum oils or oils from bituminous min- erals; these being the basic constituents of the preparations; waste oils
5270548
5 8703
Motor cars and other motor vehicles; prin- cipally designed for the transport of per- sons (other than those of heading no.
8702), including station wagons and rac- ing cars
4924688 8529
Transmission apparatus; parts suitable for use solely or principally with the appara- tus of heading no. 8525 to 8528 3763862
6 9013
Liquid crystal devices not constituting ar- ticles provided for more specifically in other headings; lasers, not laser diodes;
other optical appliances and instruments n.e.c. in this chapter
4027686 8548
Waste and scrap of primary cells, primary batteries and electric accumulators; spent primary cells, spent primary batteries and spent electric accumulators; electrical parts of machinery or apparatus, n.e.c. or included elsewhere in chapter 85
3350596
7 8479
Machinery and mechanical appliances;
having individual functions, n.e.c. in this chapter
3378672 8486
Machines and apparatus of a kind used solely or principally for the manufacture of semiconductor boules or wafers, semi- conductor devices, electronic integrated circuits or flat panel displays; machines and apparatus specified in note 9-C to this Chapter
3116176
8 2902 Cyclic hydrocarbons 2870655 8708 Motor vehicles; parts and accessories, of
heading no. 8701 to 8705 2750790
9 8536
Electrical apparatus for switching, protect- ing electrical circuits, for making connec- tions to or in electrical circuits, for a volt- age not exceeding 1000 volts; connectors for optical fibres, optical fibre bundles or cables
2490892 8541
Diodes, transistors, similar semiconductor devices; including photovoltaic cells as- sembled or not in modules or panels, light- emitting diodes (LED), mounted piezo- electric crystals
2485619
10 8541
Diodes, transistors, similar semiconductor devices; including photovoltaic cells as- sembled or not in modules or panels, light- emitting diodes (LED), mounted piezo- electric crystals
2273740 2901
Acyclic hydrocarbons
2375255
Sources: Ministry of Finance, Trade Statistics of Japan, and Korean International Trade Association’
s database.
Notes: Panel A shows the list of top 10 commodities of Japanese exports to China, and Panel B shows the list of top 10 commodities of Korean exports to China. The common HS code numbers appearing in the both panels are represented in italic.
countries, which repeat the same pattern as exports. During the first peri- od, each country increased imports from the partner countries. During the second period, Japanese imports from the other two countries and Chinese and Korean imports from Japan all decreased, whereas China and Korea increased imports from each other. These data suggest that there is a sig- nificant negative impact of the China-Korea FTA on Japanese trade.
As is common for an electric and electronic industry, the structure of Korean exports is more pronounced by strong manufacturing sectors. Es- pecially when exporting to China, the structures of Japan and Korea rep- resent greater similarity. Table 3 presents the Japanese and Korean top 10 export commodities to China in 2017. Based on the HS 4-digit classifica- tions, 6 out of 10 commodities are commonly ranked in. Those examples are motor vehicles and their parts, electronic integrated circuits, liquid crystal devices etc., and so on. We first selected the 50 largest exporting commodities to China, whose export values are over or equal to 6.5 billion U.S. dollars for Japanese exports and 4.1 billion U.S. dollars for Korean ex- ports. From those 50 commodities, 31 industries are commonly listed. As an export-destination market, China is now a very competitive place for Japanese and Korean firms to compete with each other. The bilateral free trade agreement between China and Korea is supposed to have a signifi- cant effect on the trade competitiveness of Korean industries. In the fol- lowing sections, thus, we conduct data analysis starting with these 31 ex- porting industries.
3. Research framework
Our focus is on analyzing the costs of being outside of an FTA, or in other words, trade diversion. We consider that an industry with a compar- ative advantage over Korea in the Chinese market would be paying the
costs as the third country of the China-Korea bilateral FTA, since freer trade would help the industry increase the exports. Without the Japan- China-Korea trilateral FTA, those industries must stay with a lower level of exports. If some industries do not have a comparative advantage over Korea, on the contrary, they might prefer to be outside of the FTA.
Even if the industry does not have a comparative advantage, however, if their goods are differentiated in a way, then the industry could compete with rivals in the Chinese market. In our study, we calculate the elasticity of substitution between Japanese and Korean exports to China, which im- plies a value of being the only one (Melchior, 2018). The lower elasticity means that Japanese goods are not easily replaced by Korean counter- parts, and thus they would expand the exports if free trade is realized. In this section we explain our empirical research framework.
3-1. Revealed comparative advantage (RCA) and elasticity of sub- stitution
We first explain how we calculate the revealed comparative advantage
(RCA) index. We calculate it in two ways. One is to measure the degree of Japanese industries’ competitiveness relative to both Korea and China in the world market, and the other is to measure the degree of Japanese industries’ competitiveness over Korea in the Chinese market. We follow the formula used in Tanaka and Nakazawa (2008), which is based on Bal- assa (1979), to calculate the RCA indices.
RCAJ,i = (XJ,i / XJ,t)/(XJCK,i / XJCK,t), (1)
where
XJ,i : Japanese export of industry i to the world, XJ,t : Japanese total exports to the world,
XJCK,i : Sum of industry i exports of Japan, China, and Korea to the world,
XJCK,t : Sum of the total exports of Japan, China, and Korea to the world,
and
RCAcJ,i = (XcJ,i / XcJ,t)/(XcJk,i / XcJk,t). (2)
XcJ,i : Japanese export of industry i to China, XcJ,t : Japanese total exports to China,
XcJk,i : Sum of industry i exports of Japan and Korea to China, XcJk,t : Sum of the total exports of Japan and Korea to China.
The equation (1) means that if the RCA takes a value greater than or equal to unity, Japan has a comparative advantage in industry i over both China and Korea in the world market, otherwise that industry does not have a comparative advantage. Similarly, the equation (2) means that if the RCA takes a value greater than or equal to unity, Japan has a compar- ative advantage in industry i over Korea in the Chinese market. Most in- dustries are predicted to have consistent patterns: they have or do not have a comparative advantage in both cases. Even so, it is also expected that some industries have a comparative advantage for the world market, but do not have it in the Chinese market, or vice versa.
Next we show the estimation formula of the elasticity of substitution be- tween Japanese and Korean exports to China. As explained in Tanaka
(2013), we define the elasticity of substitution (σ) as equation (3).
σ = d ln [XJ ⁄ XK]
d ln [PJ ⁄ PK]. (3)
where
XJ :Japanese export quantity to China, XK :Korean export quantity to China,
PJ :Japanese export unit price to China, PK :Korean export unit price to China.
The estimation formula is as follows.
ln XJ XK
( )
= α0 + α1・ln( )
PPJK + ε. (4)α1 < 0.
Using equation (4), we regress the Japanese relative export quantity over Korea on the Japanese relative export unit price over Korea in loga- rithms. The estimated coefficient of the relative price term in absolute val- ue indicates the elasticity of substitution (σ). We use monthly data from the U.N., COMTRADE database for the period from 2013 to 2017. We use these estimated values of the elasticity in simulation of the costs of being outside of FTA since as Hertel, Hummels, Ivanic, and Keeney (2004) ar- gue, we consider that simulation results are very sensitive to values of trade elasticity, and so estimated values would be better to use than val- ues obtained from the literature.
3-2. Simulation methodology
Using the estimated values of the elasticity of substitution, we conduct simulation analyses. The costs of being outside of the China-Korea FTA, or the amount of trade diversion from Japan to Korea can be basically captured by the reduction of Japanese exports to China. Since the FTA was in effective in 2015, the data is available for the period including both before and after the FTA installation, which makes it possible to compare actual decreases with simulated ones. We estimate the decreased amount in the following formula, which is based on Okuda (2010).
ΔMijh = Mijh * rijh * ηh, (5)
where
ΔMijh : export shift of commodity h from exporter j in country i’s im- ports,
Mijh :country i’s imports from country j in the base year 2013, rijh :tariff reduction (|τ2013-τ2017|), and
ηh : the elasticity of substitution for commodity h among imports of country i in an absolute value.
Here, ΔMijh means export shifts accruing to all the third countries. Thus, we single out the export reduction only for one country, which is Japan, by using the following formula.
ΔMijkh = ΔMijh * [Mikh / (Mih - Mijh)], (6)
or
Δm = nJ * ΔM, (7)
where
ΔMijkh = Δm: export shift of commodity h from country k, Japan, to country j, Korea, that is the Japan’s costs of being outside of FTA,
Mikh:imports of commodity h from country k, Japan, for country i, China, Mih:total imports of commodity h for country i, China,
Mih-Mijh:total imports of commodity h from all the third countries, Mikh / (Mih-Mijh)= nJ:import share of country k, Japan, to total imports
from all the third countries for country i, China, and, ΔM = ΔMijh:export shifts for all the third countries.
The actual decrease in imports is calculated by subtracting the Chinese
import value in 2013 from that in 2017.
Δam =2017mCJ-2013mCJ , (8)
where
2013mCJ:Chinese imports from Japan in 2013, 2017mCJ:Chinese imports from Japan in 2017.
Because of the bilateral FTA in 2015, Chinese imports from Japan are supposed to decrease from 2013 to 2017. We compare the actual decrease in imports (|Δam|) with the simulated amount of decrease (Δm > 0). We then take a ratio of the simulated amount over the actual amount to see if there is a case where the ratio is meaningfully high. By so doing we can investigate the extent that the reduction of Chinese imports can be attrib- uted to the shift of sourcing from Japan to Korea. We consider this shift as the cost of being outside of the FTA and a kind of trade diversion effect for the third country.
4. Results of data analysis and simulation
Our data is obtained from various sources: the U.N., COMTRADE data- base, Ministry of Finance, Trade Statistics of Japan, Korean International Trade Association’s database, and the WTO, Tariff Downloaded Facility. Trade data and Chinese import tariff rates for Japan are collected at the HS 4-digit classifications, and Chinese import tariff rates for Korea are col- lected at the HS 6-digit classifications. We first selected top 50 industries, and then chose 31 industries that are common to both Japanese and Kore- an exports.
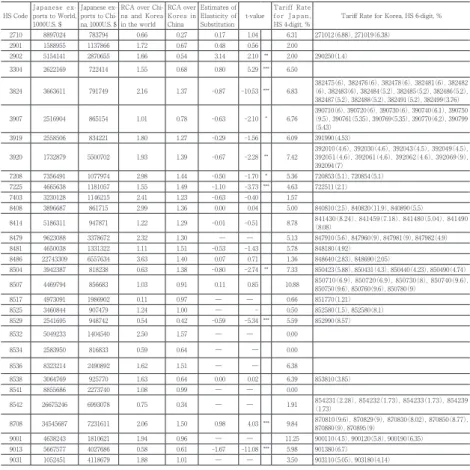
Table 4 shows the calculated RCA indices (Equations 1 and 2) and esti- mates of the elasticity of substitutions (Equation 4), together with the Jap-
anese export values and China’s tariff schedule imposed on Japanese and Korean 31 commodities in 2017. We can consider 4 patterns: whether RCA is greater than unity or not, and whether the elasticity of substitution is relatively smaller or not. The most concerned pattern is, however, the case where an industry does not have a comparative advantage in China while does have it in the world, and at the same time, the substitution elasticity is relatively low in an absolute term. This case suggests that the industry is faced with the difficulty caused by Chinese reduced tariffs on Korean imports with tariffs being kept same for the Japanese exporters.
In other words, those Japanese industries are expected to have a greater potential of expanding exports if free trade arrangement with China hap- pens.
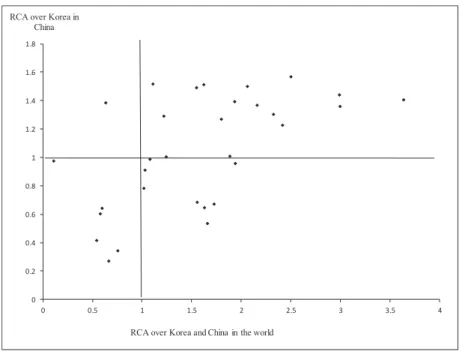
Table 4 also shows that the RCA indices are diverse from higher to low- er than unity. Overall the magnitude of RCA is in a moderate range. Fig- ure 2 plots the two types of RCA indices together for the 31 industries.
We can observe that there is a positive relationship between them. That is, most industries that have a comparative advantage over Korea and China in the world market also have a comparative advantage over Korea in the Chinese market. There are 6 industries that do not have a compara- tive advantage either in the world or in China. However, 8 industries have a comparative advantage in the world but do not have it in China. These industries are represented by the dots located in the fourth quadrant in the figure.
We turn to look at the estimates of the elasticity of substitution in Table 4. For 10 industries the elasticity could not be estimated unfortunately be- cause of the data availability, and for another 10 industries the estimates are not statistically significant. The remaining estimates for 11 industries are statistically significant. For three of them, however, the sign is posi-
Table 4. Calculations and Estimates: Revealed Comparative Advantage (RCA), Elasticity of Substitution, and Chinese Tariff Rates, 31 HS 4-digit Clas- sifications
HS CodeJapanese ex- ports to World, 1000U.S. $
Japanese ex- ports to Chi- na, 1000U.S. $
RCA over Chi- na and Korea in the world
RCA over Korea in China
Estimates of Elasticity of
Substitution t-value Tariff Rate f o r J a p a n ,
HS 4-digit, % Tariff Rate for Korea, HS 6-digit, %
2710 8897024 783794 0.66 0.27 0.17 1.04 6.31 271012(6.88), 271019(6.38)
2901 1588955 1137866 1.72 0.67 0.48 0.56 2.00
2902 5154141 2870655 1.66 0.54 3.14 2.10 ** 2.00 290250(1.4)
3304 2622169 722414 1.55 0.68 0.80 5.29 *** 6.50
3824 3663611 791749 2.16 1.37 -0.87 -10.53 *** 6.83 382475(6), 382476(6), 382478(6), 382481(6), 382482
(6), 382483(6), 382484(5.2), 382485(5.2), 382486(5.2), 382487(5.2), 382488(5.2), 382491(5.2), 382499(3.76)
3907 2516904 865154 1.01 0.78 -0.63 -2.10 * 6.76 390710(6), 390720(6), 390730(6), 390740(6.1), 390750
(9.5), 390761(5.35), 390769(5.35), 390770(6.2), 390799
(5.43)
3919 2558506 834221 1.80 1.27 -0.29 -1.56 6.09 391990(4.53)
3920 1732879 5500702 1.93 1.39 -0.67 -2.28 ** 7.42 392010(4.6), 392030(4.6), 392043(4.5), 392049(4.5), 392051(4.6), 392061(4.6), 392062(4.6), 392069(9), 392094(7)
7208 7356491 1077974 2.98 1.44 -0.50 -1.70 * 5.36 720853(5.1), 720854(5.1)
7225 4665638 1181057 1.55 1.49 -1.10 -3.73 *** 4.63 722511(2.1)
7403 3230128 1146215 2.41 1.23 -0.63 -0.40 1.57
8408 3896687 861715 2.99 1.36 0.00 0.04 5.00 840810(2.5), 840820(11.9), 840890(5.5)
8414 5186311 947871 1.22 1.29 -0.01 -0.51 8.78 841430(8.24), 841459(7.18), 841480(5.04), 841490
(8.08)
8479 9623088 3378672 2.32 1.30 ― ― 5.13 847910(5.6), 847960(9), 847981(9), 847982(4.9)
8481 4650038 1331322 1.11 1.51 -0.53 -1.43 5.78 848180(4.92)
8486 22743309 6557634 3.63 1.40 0.07 0.71 1.36 848640(2.83), 848690(2.05)
8504 3942387 818238 0.63 1.38 -0.80 -2.74 ** 7.33 850423(5.88), 850431(4.3), 850440(4.23), 850490(4.74)
8507 4469794 856683 1.03 0.91 0.11 0.85 10.88 850710(6.9), 850720(6.9), 850730(8), 850740(9.6),
850750(9.6), 850760(9.6), 850780(9)
8517 4973091 1986902 0.11 0.97 ― ― 0.66 851770(1.21)
8525 3460844 907479 1.24 1.00 ― - 0.50 852580(1.5), 852580(8.1)
8529 2541695 948742 0.54 0.42 -0.59 -5.34 *** 5.59 852990(8.57)
8532 5049233 1404540 2.50 1.57 ― ― 0.00
8534 2583950 816833 0.59 0.64 ― ― 0.00
8536 8323214 2490892 1.62 1.51 ― ― 6.38
8538 3064769 925770 1.63 0.64 0.00 0.02 6.39 853810(3.85)
8541 8855686 2273740 1.08 0.99 ― ― 0.00
8542 26675246 6993078 0.75 0.34 ― ― 1.91 854231(2.28), 854232(1.73), 854233(1.73), 854239
(1.73)
8708 34545687 7231611 2.06 1.50 0.98 4.03 *** 9.84 870810(9.6), 870829(9), 870830(8.02), 870850(8.77), 870880(9), 870895(9)
9001 4638243 1810621 1.94 0.96 ― ― 11.25 900110(4.5), 900120(5.8), 900190(6.35)
9013 5667577 4027686 0.58 0.61 -1.67 -11.08 *** 5.98 901380(6.7)
9031 1052451 4118679 1.88 1.01 ― ― 3.50 903110(5.05), 903180(4.14)
Sources: Ministry of Finance, Trade Statistics of Japan; Korean International Trade Association;
United Nations, COMTRADE Database; World Trade Organization, Tariff Download Facility.
Notes: The t-values show the significance level of the estimates of the elasticity of substitution, and asterisks mean 1% level of significance by ***; 5% level of significance by **; and 10%
level of significance by *. On the WTO database, we can obtain tariff rates only at the 6-digit commodities of Chinese imports from Korea.
tive, which is not consistent with the theory, and accordingly we exclude them from simulation analysis. The rest of 8 industries with negative esti- mates of the substitution elasticity are used for simulation to investigate the diversion effects. The elasticity in an absolute value can be classified into two cases: relatively higher elasticity and relatively lower elasticity.
The relatively higher elasticity means that the commodities are more like- ly substitutable with rivals’ exports as generic products, whereas the rela- tively lower elasticity means that the commodities are not easily replaced
Figure 2. Japanese Industries’ Revealed Comparative Advantage (RCA):
World market and Chinese market, 2017
Notes: Authors’ calculations. 31 commodities of the HS 4-digit classifications. The comparative advantage is defined as is over China and Korea in the world market, and as is over Ko- rea in the Chinese market. With the value taking greater than or equal to unity, the in- dustry is considered to have a comparative advantage. The industries located in the fourth dimension have a comparative advantage in the world market while they do not have it in the Chinese market.
0 0.2 0.4 0.6 0.8 1 1.2 1.4 1.6 1.8
0 0.5 1 1.5 2 2.5 3 3.5 4
RCA over Korea in China
RCA over Korea and China in the world
by others, since the product has a specific characteristic (Tanaka, 2013).
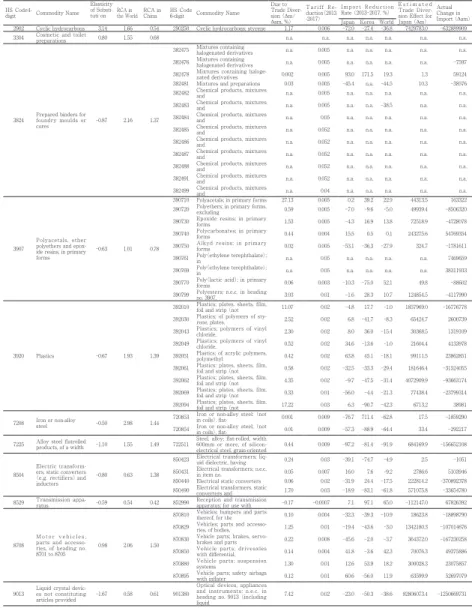
Next, we look at the simulation results shown in Table 5. The actual changes in Chinese imports from Japan show both positive and negative.
Even though the China-Korea FTA is effective, Japanese exports to China do not decrease for some industries. It is obvious that trade values would change for many reasons other than free trade agreements. In particular, when China increases total imports, Japanese exports to China would not necessarily decrease even if Korean exports increase due to the FTA. Al- ternatively, when China decreases total imports, both Korean and Japa- nese exports to China would naturally decrease. It is also noticed that even in this case, the reduction of Japanese exports could be larger than that of Korean exports because of trade diversion from Japan to Korea.
Our data show that 18 Japanese industries experienced a decrease of im- ports rather than an increase of imports during the sample period.
We focus on the ratio presented in the previous section (Δm/|Δam|), whose estimates are shown in the column of “Due to Trade Diversion” in Table 5. The ratio is represented as a percentage of the simulated value over actual value. We consider that if this ratio is relatively bigger with a lower RCA in China than for the world, it could be inferred that at least some part of the actual decrease in Chinese imports from Japan can be at- tributed to the trade diversion.
Among those 18 commodities whose Chinese imports from Japan de- creased in 2017, polyacetals (HS3907) should be given particular consider- ation. The RCA of this industry in the world shows the level of just about unity, but it is 0.78 in China, which implies that the industry is competitive worldwide, but it is not so in China. This might be caused due to the bilat- eral FTA. Looking at the HS 6-digit classifications within that industry, we find that for some type of polyesters (HS390799), Chinese imports de-
Sources: Ministry of Finance, Trade Statistics of Japan; Korean International Trade Association;
United Nations, COMTRADE Database; World Trade Organization, Tariff Download Facility.
Notes: Authors’ calculations and estimations. In the table, the positive estimates of the elasticity of substitution are written in italic. For the commodity HS852990, the Chinese tariff rate was actually raised for Korea from 2013 to 2017.
Table 5. Simulation Results of the Effects of Trade Costs of the China-Korea FTA for Japan: 8 HS 4-digit Commodities, Including 18 HS 6-digit Commodities
HS Code4- digit Commodity Name
Elasticity of Substi- tuti on RCA in
the World RCA in China HS Code
6-digit Commodity Name Due to Trade Diver- sion (Δm/
Δam, %)
T a r i f f R e - duction(2013 -2017)
Import Reduction Rate (2013-2017, %)
E s t i m a t e d Trade Diver- sion Effect for Japan (Δm)
Actual Change in Import (Δam)
Japan Korea World
2902 Cyclic hydrocarbons 3.14 1.66 0.54 290250 Cyclic hydrocarbons; styrene 1.17 0.006 -72.0 -27.4 -36.8 7429783.0 -632889909 3304 Cosmetic and toilet
preparations 0.80 1.55 0.68 n.a. n.a. n.a. n.a. n.a. n.a. n.a.
3824 Prepared binders for foundry moulds or
cores -0.87 2.16 1.37
382475 Mixtures containing
halogenated derivatives n.a. 0.005 n.a. n.a. n.a. n.a. n.a.
382476 Mixtures containing
halogenated derivatives n.a. 0.005 n.a. n.a. n.a. n.a. -7597
382478 Mixtures containing haloge-
nated derivatives 0.002 0.005 93.0 171.5 19.3 1.3 59124
382481 Mixtures and preparations 0.03 0.005 -45.4 n.a. -44.5 10.3 -38576
382482 Chemical products, mixtures
and n.a. 0.005 n.a. n.a. n.a. n.a. n.a.
382483 Chemical products, mixtures
and n.a. 0.005 n.a. n.a. -38.5 n.a. n.a.
382484 Chemical products, mixtures
and n.a. 0.05 n.a. n.a. n.a. n.a. n.a.
382485 Chemical products, mixtures
and n.a. 0.052 n.a. n.a. n.a. n.a. n.a.
382486 Chemical products, mixtures
and n.a. 0.052 n.a. n.a. n.a. n.a. n.a.
382487 Chemical products, mixtures
and n.a. 0.052 n.a. n.a. n.a. n.a. n.a.
382488 Chemical products, mixtures
and n.a. 0.052 n.a. n.a. n.a. n.a. n.a.
382491 Chemical products, mixtures
and n.a. 0.052 n.a. n.a. n.a. n.a. n.a.
382499 Chemical products, mixtures
and n.a. 0.04 n.a. n.a. n.a. n.a. n.a.
3907
Polyacetals, other polyethers and epox- ide resins, in primary forms
-0.63 1.01 0.78
390710 Polyacetals; in primary forms 27.13 0.005 0.2 39.2 22.9 44313.5 163322
390720 Polyethers; in primary forms,
excluding 0.59 0.005 -7.0 -9.6 -5.0 49939.4 -8506320
390730 Epoxide resins; in primary
forms 1.53 0.005 -4.3 16.9 13.8 72518.9 -4728078
390740 Polycarbonates; in primary
forms 0.44 0.004 15.5 0.5 0.1 243275.6 54769354
390750 Alkyd resins; in primary
forms 0.02 0.005 -53.1 -36.3 -27.9 324.7 -1781611
390761 Poly(ethylene terephthalate);
in n.a. 0.05 n.a. n.a. n.a. n.a. 7469659
390769 Poly(ethylene terephthalate);
in n.a. 0.05 n.a. n.a. n.a. n.a. 38311933
390770 Poly(lactic acid); in primary
forms 0.06 0.003 -10.3 -75.0 52.1 49.8 -88602
390799 Polyesters; n.e.c. in heading
no. 3907, 3.03 0.01 -1.6 28.3 10.7 124854.5 -4117990
3920 Plastics -0.67 1.93 1.39
392010 Plastics; plates, sheets, film,
foil and strip (not 11.07 0.02 -4.8 17.7 -1.0 1857969.0 -16776778
392030 Plastics; of polymers of sty-
rene, plates, 2.52 0.02 6.8 -41.7 -8.3 65424.7 2600739
392043 Plastics; polymers of vinyl
chloride, 2.30 0.02 8.0 36.0 -15.4 30368.5 1319109
392049 Plastics; polymers of vinyl
chloride, 0.52 0.02 34.6 -13.6 -1.0 21604.4 4133978
392051 Plastics; of acrylic polymers,
polymethyl 0.42 0.02 63.8 45.1 -18.1 99111.5 23862851
392061 Plastics; plates, sheets, film,
foil and strip (not 0.58 0.02 -32.5 -33.3 -29.4 181646.4 -31524055
392062 Plastics; plates, sheets, film,
foil and strip (not 4.35 0.02 -9.7 -47.5 -31.4 4072909.9 -93663174
392069 Plastics; plates, sheets, film,
foil and strip (not 0.33 0.01 -56.0 -4.4 -21.3 77438.4 -23799314
392094 Plastics; plates, sheets, film,
foil and strip (not 17.22 0.03 6.3 -90.7 -42.3 6713.2 38981
7208 Iron or non-alloy
steel -0.50 2.98 1.44 720853 Iron or non-alloy steel; (not
in coils), flat- 0.001 0.009 -76.7 711.4 -62.8 17.5 -1859290
720854 Iron or non-alloy steel; (not
in coils), flat- 0.01 0.009 -57.3 -88.9 -64.4 33.4 -292217
7225 Alloy steel flatrolled
products, of a width -1.10 1.55 1.49 722511 Steel, alloy; flat-rolled, width 600mm or more, of silicon-
electrical steel, grain-oriented 0.44 0.009 -97.2 -81.4 -91.9 684169.9 -156652108
8504
Electric transform- ers, static converters
(e.g. rectifiers) and inductors
-0.80 0.63 1.38
850423 Electrical transformers; liq-
uid dielectric, having 0.24 0.03 -39.1 -74.7 -4.9 2.5 -1051
850431 Electrical transformers; n.e.c.
in item no. 0.05 0.007 16.0 7.6 -9.2 2786.6 5103946
850440 Electrical static converters 0.06 0.02 -31.9 24.4 -17.5 222814.2 -370892378 850490 Electrical transformers, static
converters and 1.70 0.03 -18.9 -83.1 -61.8 571075.8 -33654780
8529 Transmission appa-
ratus -0.59 0.54 0.42 852990 Reception and transmission
apparatus; for use with -0.17 -0.0007 7.1 97.1 65.0 -112147.0 67826392
8708
M o t o r v e h i c l e s ; parts and accesso- ries, of heading no.
8701 to 8705
0.98 2.06 1.50
870810 Vehicles; bumpers and parts
thereof, for the 0.10 0.004 -32.3 -39.3 -10.9 18623.8 -18898790
870829 Vehicles; parts and accesso-
ries, of bodies, 1.25 0.01 -19.4 -43.6 -3.0 1342180.3 -107014676
870830 Vehicle parts; brakes, servo-
brakes and parts 0.22 0.008 -45.6 -2.0 -3.7 364372.0 -167230258
870850 Vehicle parts; driveaxles
with differential, 0.14 0.004 41.8 -3.6 42.3 70076.3 49375886
870880 Vehicle parts; suspension
systems 1.30 0.01 12.6 53.9 18.2 300028.3 23075857
870895 Vehicle parts; safety airbags
with inflater 0.12 0.01 60.6 -56.0 11.9 63599.9 52697079
9013 Liquid crystal devic- es not constituting
articles provided -1.67 0.58 0.61 901380
Optical devices, appliances and instruments; n.e.c. in heading no. 9013 (including liquid
7.42 0.02 -23.0 -50.3 -38.6 92806073.4 -1250669731
creased, and that the ratio of the simulated decrease indicates 3%.iv) Since the elasticity of substitution of this commodity is 0.6 in an absolute term, which is lower, this product should be well differentiated from a Korean counterpart in the Chinese market, but a small part of its export could be possibly diverted to Korea. This argument could also be supported by Chi- na’s import reduction rates: total imports and import from Korea increased while import from Japan decreased.
The commodity category, HS3920, plastics, also presents an important case. Its competitiveness seems to be kept in China, since the RCA in Chi- na is 1.39, which is above unity even though slightly lower than the RCA for the world (1.93). The elasticity value is 0.67 in absolute terms, and so that the product could be well differentiated. Within this category, HS 6-digit commodity, HS392010, experienced about 11% of the trade diver- sion effect.v)
Those industries exporting the commodities above can be considered as facing the negative effect of a China-Korea bilateral FTA. But if we turn to the other categories, iron and non-alloy steel (HS7208), and its sub-cate- gories (HS720853 and HS720854), the ratios of trade diversion for the two sub-categories show only 0.001% and 0.01%, respectively.vi) We consider that the source of strength can be attributed to the uniqueness of prod- ucts that Japanese makers provide.
Liquid crystal devices (HS9013), on the other hand, show that the elas- ticity of substitution is 1.67 in absolute terms, the RCA for the world is 0.58, and the RCA in China is 0.61, which means that the commodity is less competitive with lower extent of uniqueness not only in China but also in the world. For the sub-category, HS901380, the ratio of trade diversion is 7.4%.vii) In this case, it would be ambiguous whether a free trade arrange- ment would help increase its exports.
5. Conclusion
The China-Korea FTA was completed ahead of the Japan-China-Korea FTA. Past studies provide insightful simulation results of the bilateral and trilateral FTA, but their discussions lack an argument on comparative ad- vantage. This study, therefore, has tried to deepen the discussion on FTA impacts by explicitly considering the pattern of comparative advantage.
Out of 50 largest export commodities to China, 31 commodities are com- monly listed in Japanese and Korean exports. This is the evidence that both countries are competing very harshly with each other in the Chinese market, and therefore, we consider that a closer look at the patterns of comparative advantage between Japan and Korea is very important. At the HS4-digit classifications level, we find that many Japanese industries who have a comparative advantage over China and Korea in the world market do have a comparative advantage over Korea in China. The elas- ticity of substitution is estimated to be lower values, implying that the Japanese goods are rather unique and not easily replaced by other coun- tries’ goods.
We conducted simulation analyses to verify the existence of trade diver- sion effects. Taking a ratio of the simulated amount of decrease in imports by China over its actual decrease in imports, we find that some Japanese industries experienced a relatively significant impact of the bilateral FTA.
Some kinds of polyesters (HS390799) and plastics (HS392010), for exam- ple, have a comparative advantage worldwide and lower values of the elasticity of substitution, but are faced with the significant reduction of im- ports by China. The portion of the trade diversion accounts for 3% and 11%, respectively. We consider that these industries may be paying the costs of being outside of the China-Korea FTA, and thus, a trilateral or