Bull.Fac.Fi$h.∴Mie Univ.
No.12:13−27 0ctoberl.1985
A SimpEe Method of AnalysFng the Po[ymoda[Frequency Distributions Of Fish Egg Dismeters andits AppFication to the Ovarian Eggs of
JaドaIleSe ConlmOn Mackerel
KenjiAsANO and SyoitiTANAKA*
Faculty orI召sheries.Mie University
A compuも即ized sirnple method or analysl咽the polymoda!でrequency distributions
Orrishegg diametersis pr鰐ented. rhe basic algorit†lm tO di5COVer SOmeSigniダまcamt p8alくS
and trou如1S depends onimerease or deere舶e Or the r柁quenCy btween two successive曙gdiameterelasses,A peakis counted when twoinereases oecureons蹴utively aれd rollowe(i by L、、ごO COnSCCuti\でdccrcEISCS・八Lroughis rct:OgnizcdiTla Similarllla11nCrlFor co171plieaLL
ed form or disもribuio!lS,the basic algori抽mis modifed and morQ d眈乱iled criteria are d帥elo鱒d.1 heovari乱neggS OrJapaneseco】ⅥmOn maClくerelwerQeXamined by thisInQthod.
Or the ovaries95%had rrom one to six pealくS.In the rrequeney distribtItion or ovaries
at the most advanced sも昭e,there appeared a discontinuous space(DS)in which noeggexisted,Th81〕S divides th8disもributionintoもhQ developi咽egg grOuP and tile bydrated
曙g grOuP.This simple methodlacks mathemaもicalsもrictness bljtis rairly userulandarrords easy analyses or the distributions or rish eg嘗diameters,
tくey wards:POlymodaldisもribution,0Varian曙gSパOmmOn maCk即el
Ot〉SerVing rish ovaries,a few modes are foundin the frequency distribution or曙g diameters.Thesemodes provideveryimporはntinrormaもion r曙arding・the sexualmaturation process or rish sp∝ies.To analyseもhe rrequency distrit〉uもion or ovarian egg dia汀1eterS,
amicroscopicobservationhast胱nemplyed.However,血isme沈odormα鵜uri喝thedistrit〉ution Or曙g dia∬eterS and counting the number or eg嘗Sin the ovary requires a great d飽lof
work and time.
R眈ent Studまes,f▲orexampleAsano and Tanaka(1984),Ⅵ血ich applied anima酢prOCeSSOr to mQaSure therish曙gS,have made repid analysis possible.Once a frequency distriもuもion is obねined,analysis or the cbaracもeristics or the disもribution are madein many dirfeI、ent W邑yS,dependir将On eaCh researcher,because no systemaもic me汰odology of analysis has
■Oceanlもesearchlnstitute,University or Tokyo
KenjiAsÅNO and Syoitil ANÅKÅ
14
yet been developed.
OnlyImaiand Tanaka(1984)have reported a methodfor analysi噌the frequency dis−
trit)しlじions of堵g diameters・Their method uses computer g・raphic technics to s叩araとe the
POiymodalfrequecy distributions of egg diametersinto various components each of which
form$an errOrCurVe.On汰e oもherhand,rOr theleng・もh disもribuもions,a Varieもyormethods has t〉een developed to analyse the polymodalfrequency curveinもO a酢grOupS(臥g.Cassie1954,Tanaka1956,Sbimazu1979,Matsuzakie£αg.1983,Akamine1982,19朗,1985).
1「he basic algori汰m commonly usedis to riもSOme nOrmaldisもril)utions to the objective
rrequencycurve,though the procedure ofcurvel ittingsisdifrerent d叩endi将On eaChmeth−
Od・Thesemethods would be usefulfor analysingthe frequency distributionof eggdiame−
もers,prOVided that the曙g diameもers or each eomponent are distributed normally.Irもhis is noも沈ecase,Serious error may beintroduced.This paper presents a simple meu10d ror analysing the poiymodaldistribuもion,Without assuming a normaldisもribution,by detecting Peaks and trou如s wiula definite algori洩m and estimaもing their posiもions and hei如ts.
でhis methodis applied to thefrequency disはibuもions of ovarian曙g diameters orJapanese COmmOn maCkerelcaug■hもin the spawning−seasOn.
Materials and Methods l.Materials and computation
Overa periodor thr寧eyearS(1977−1979)a totalorlO69remalemackerelsweresampled rromもhe rishlanded at K(塔aWa rish market,Yaizu,ShizuoiはPrerecture.Thesemackerels belo咽tOもhe Pacific subpopu払もion and王将gr曙ate tO the sea area around theIzuIslands
during the spring spawning season.Overies were extracted from the female mackerels and
preservedinlO%rorm払1in.Arter more抽an one monもれtile frequency distributons ofもheOVarian曙g diameters were estimaもedby the method or Asano andでanaka(1984)to serve 乱S rundamenもal血ta ror this study.
A basicalgor仙m was prepared to detect si即iricant peaks and tro噌hs and was pro一 針ammedbyKm払曙uage・Tbeanalysesoftherrequencydisもribuもionsofeggdiameters Were done by theI㌻ACOMOSIV/Ⅹ8computer of tbeOcean Res陀rChInstituもe,University
OfTokyo,乳ndby theIrACOM230】38Scomputeror thecomputercenter,MieUniversity.
2.Basic ruLe for detecting peaks and troughs
The basic rule for rec(唱nizi堀peaks and troughsis as rollows:‡n a rrequency disもri−
buもionoreggdiameters,therrequencyordiameterclassJisexpressedasY(J).Compari曙 Y(J)withY(J+1),in sequenceorincreasir将theclassnumberJ,ir Y(才+1)−Y(J)is posi−
tive or・ZerO for two or more consecutiveIs and thcn become$negative or zero for two OrmOreCOnSeCuもiveJs,a Peakis recognized.Similarly,if■Y(J+1)鵬Y(才)shows consecutive n曙aも拉eorzero valuesand tbenconsecu信ve positiveorzerovalues,thena tro咽hisrec昭一 nized(Fig・1)・‡n practice,however,SOme distributions appear whose peaks and troughs Can nOt be deteted by means of this basic criterion only.Thus,for the complex cases a
Method ror PolymodalFr¢quenCy Disもribution Analysis andIt Applieatioれ・ 15
酢neralized algorithmⅥraS developed by mod汀yi咽the basic one.Tbis algorithmis g▲1Venlater.
Assmall曙鮮血thdiametersless Lhan o.2rnmwcre not.measurcd(somc 喝酢WerelessもhanO.15mm),theclass Or therrequencydistribution st乱rted 南仏喝gdiametersofo.2mm(orO.15 mm).A maekerelovary contains a la柑e amOunもOr Sma11yolkless OOeyteS.Tbesenon−maもured oocytes Stage Of沈e gonad(Takemu柑1957,
三二_二 ̄
Dく禁じeごtion of a peak I)eとecじまon of a ヒrouqh
Fi臥1Basic eriterion to陀COgrlばe a Peal(Or trOugh.
always exisもin abundanceirrespective or the maturity でateishま1958,Usami1966).So tbe rirst p組k(peak 1)isfixedatO.025mmasare如如positまonandthefoilo雨喝匹aksaredet∝短dand numl黒red successively rrom two upⅥrard.Thelowesもrrequency between peakland peak2wilibe troughland沈elowesもrrequency between peak2and peaks3willbeもro喝h2,and so forth.Beca.use peaklis rixed at the starもOr蝕e analysis,the firsもStepin the analysis isしO dctCrmillC trOugl11.
3.Procedures for basic aIgorithm
Aflowcbart oダanalyticalprocedureis shownin‡?ig.2.LeもG==Y(J+1)−Y(J).The recognition of peaks and troug・hsis done by checking・for the sign ofG(we callthis a≠G
decision〝).In the rIowcharと汰esign ofGdeもermines theもranch direction:toM(positive),
to E(zero)orも0Ⅰ.(n曙ative),reSpeetively.汀a sequentialpatもern or沈e si如saもisries the
Criもerion,a peak ora troug・hisadmitted andもhen recorded.If not,Jisincreased byone and the G decisions are repeated.When G dicision No.34resultis n曙ative orzero,then a peakis adm止ted.汀it resultsin positive or盈rO atNo.13,a trO将hisadmitted.8esid那,
SOme Oもherjudgements and treatmenもS are addedin theprog・ram.They areexplainedbelo臥
i)Zero detection and discont拍uous space Some times frequency distribution of eggsis discontinuous,andもheeg嘗S areabsent over a ra曙e Of沈e diameもer.Most or ovaries with
this typeor rrequncy distril)uもぬn arein払e mosもadvancedsta酢Ormaturationand possess hydrated egg■S.でhis space separates the hydrated egg group∫rom the egg group or‡ess
adv乱nCedst喝eS.Thererore,thischaracもeristicof曙g distributionsisimportanもin studyi曙 the maturity stages of ovaries.We callthis space: discontinuous space(DS) .
If a G decision turns neg・ative,the frequency of Y(I+1)could be zero.Whenever a Gdecision resultis negativeand at thesame timeY(才+1)is zero,tben壷仇outadvancing to tbe nexも,it staysin the zero detection routine to observe how mamy zero rrequencies
OCCurCOnS∝utively.In thecaseor詑rO appearingonlyonce,iもreturnsも0もbe normalrouもhe.
Butir gero appears twice or more,midpoints or bothもbe first and the rinalclasses of ZerO rrequenCy are reCOrded.When posiもiveY(J+1)i$foundin the zero detecもion routine,
it escapes rrom the circuit and goes to decision No.30,
KenjiAsANO a11d SyoitiでANÅKA
16
・喰還ぶ空相し○−弓邑首p夢0忘 N.悪軋
Method for PolymodalFrequencyl〕istribution血alysis免れdlt Application・
17
ii)鮎tt…ngoftrou9hlIi−firsとtwoGdecisionsareallpositiveandnoもmughisreco卯ized,
tben peak2willappearrirstwithouもdeもecting trouめ1・Inord即tO乳VOid thissituation in such a case,the positまon or trou紳1is set aももhe point or thelerレhand ma曙in or 沈e smaユ1esもCユass andiとS heij抽tis defined by汰e fr明u班Cy Or this class.Tbe procedure is rormulaもed as rollows:
1)When decision No.30turn ouもM or E,ir the number of troughs already count¢d is zero,ieもClass No.1beもroughland g■0もO decisioriNo.32.
2)げthenumlx汀Oftrou如Salreadycounもedisnoも遮rO,Simplyproc既dto血cisionNo・32・
榊)Detection of dateendIn allG decisions a runcもion ordata end detectionis provi由d・
Wもeniもreacbesthel餌tCiassoダで柁quenCydisもribuとionafもeraseriesordecisions,tbepo三鵡i00S
and numもers of observed peaks,trO噌hs and DSs are reeorded・This routineis executed
just berore each G decision.
4.Criteria\へIhen the distributjon form of egg diametersis complex
Inpractice,eVen though some modes㍑istin a continuous rrequency disもribuもion,沈e rrequency distributions aroundthe modesdo not alw・ayS Satisryもherundamentalcriteria oでpeakdetecもion,So洩aも沌eoperation wiもム0由basiccrit8riamayignoresigniric邑nも
modes,Hence,amethodrormana郎喝thecomplicateddistributionswherethel泊Sicalgoriもhm
can not be applied is considered
below.Procedures areillustratedin
八一三
二二_二_
一っ 一三 ・l
二二_一二
二\二‡二__
 ̄二±二:
且垣弘
tbe鮎wchart(Fig.2).Forexample,
ir a scrics or G decisions bccomcs
、、1.Ⅰ.h::lI.∴it,rCaChes rcsulL ^,thcn
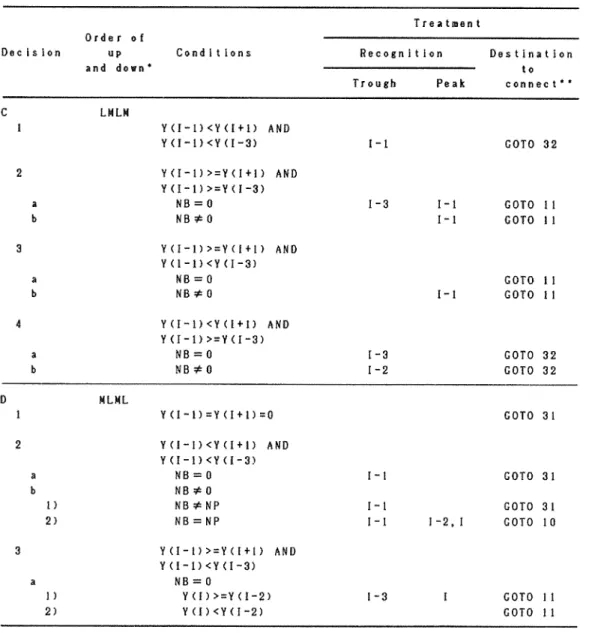
amoredetailed analysisis匹rformed rollowi噌theinstrucもまons givenin Tablel.Tber∝0卯ition(ordisapprov−
al)or peaks andもroほ紬sis doれe d叩endir将On払e rorm or rrequency disLribuしion.and thc anal〉・Sis pl・∝血s tonextstepdesi卯atedroreachcas臥 To beもter explain もbe decision algoriもhm,Fig.3shows various rorms orデrequency disもributions
二三ニ
ー3 −2 −1 8
 ̄
_.ニエ
ーコ 一: ・l A ̄ ̄
_二三二≒二㌻_
COrreSpOndingとO eaC壬10riれd主vidualムー卜d
casein Tl、ablel.^1so rol・Ot,hcr
COmplieated distribuもions pattern
indicated by symboIs 8 to G,
treatments and their grapbical
explanaもOnS areSbownin Tablel〜4 andin Fig.4〜6.−3 −2 −1 (l ll ■2
釣針3 Graphicaie叩王anation or criteria usedin complicated distributioれCaSeS;Processん P shows peak admitted
a習d V七rougb admi比ed・
KeれjiAsANO aれd Syoiもil ÅNAKA
T8blelCriteria ror complicated distributions;Process A
18
TJeatJ■8nl Orde r 01
Deeision up
and d(〉▼∩●
Co!1ditions R¢COgnition Destinきtion
to Trough PEIak connecl=
LLllL
Y(‖・1)くニYく卜1)
Y(Ⅰ◆1)=O AND Y(【−1)=O YくⅠ十2)>YくⅠ)
Yくl十2)く=Y(‖
Y(l)くY(卜3)
Y(l)>=Y(I−3)
GOTO 31 GOTO 32
・1 2
GOTO ll
l−1
1GOTO 11
Y(l◆1)>Y(l−1)
Y(い2)>Y(1)>=Yくl−2) t−1 GOTO 32
GOTO = GOTO 31 GOTO 32 Y(Ⅰ+2)く=Y(【)くY(Ⅰ−2)
YくⅠ十2)<=Y(‖
Y(‖>=Y(Ⅰ−2)
Y(王)くY(卜2)
HHLH
Yくl十l)>Y(l−1)
ⅣB≠0
ⅣB=O
Y(Ⅰ+1)く=Y(l−1)
Y(Ⅰ十2)くY(いl)
NB≠0
Ⅳ8=8 Yくl◆2)>=Y(l+l)
NB≠O NB=0
GOTO 32 COTO 32
Ⅰ−3
a
・・1 2
b
卜1 GOTO 11 I−3 l−1 GOTOll
l
f−1 GOTO 30 1−3.1 トーI GOTO 30
−−一2
NB = nu爪】beIOf troughs
NP = numb8r ¢lpeaks
* G dtきeision: L M
G<O G>0
= nu■,ber sh…S C docision =1th8 diagram
Me七hod ror PolymodalFr明uenCyI〕isもribution Analysis and比Applieation・ 19
TabLe 2 Criteria ror complicated distribuもions;Process B and C
T===l=nl Ord8r O f
D8Cislon up Condlllons
and do■n●
Re¢Ogn主tion D8Stimation
to Trough Poak connec t■■
LllLH
Y‖十1)くY(==)椚沌 Y(l−1)くY(I−3)
Y(l−1)>=Y(l◆l)AND Y(1−1)>=Y(I−3)
NB=0
ⅣB≠O
Y‖−1)>=Y(l+l)AND Y(1−=くY‖−3)
NB=0
Ⅳ8≠O
Y(Ⅰ−1)くY(1+1)ANO Yくl−1)>=Y(l−3)
N8=O NB≠0
l−1 GOTO 32
l−3 卜1 GOTO11
卜1 GOTOll
GOTO l】
卜1 GOTO】=
COTO 32 GOTO 32
HLltL
Y(1−1)=Y(l十1)=O
Y(l−1)くY(l+1)AトID
Y(I−1)くY‖−3)N8=O N8≠O NB≠NP NB=NP
Y(l−1)>=Y(【十l)∧N【)
Y(1−1)くYくl−3)
N8==O
Y(Ⅰ)>=Y(l−2)
Y(l)くY(Ⅰ−2)
GOTO 3l
GOTO 31
COTO 31
Ⅰ−1
卜2.1 GOTO 10
Ⅰ−3 1
COTO11
GOTO 11
NB = nu指ber of troughs
ⅣP = nu巾b¢r O!p8aks
KenjiA8ANO and Syoiti′rANAKA
Table 3 Criteria forcomplicaもed distributions;Process D and F
20
Treatrnent 0∫deJ Of
up and d¢Wn■
Des tination to connec t=
Recogn==on Conditions
Decision
Trough Peak HLHL
GOTO ‖ GOTO 34 GOTD II
ⅣB≠O AⅣD ⅣB≠ⅣP
NB≠O AND NB=NP
Y(Ⅰ)>=Yく卜2)
Y(王)くY(卜2)
Y(ー−1)くY(Ⅰ+1)AND Y(Ⅰ−1)>=YくⅠ−3)
ⅣB=O Y(Ⅰ−2)くY(Ⅰ〉
Y(Ⅰ−2)>=YくⅠ)
NB≠O AND NB≠NP
NB≠O AND NB=NP
Yく1)>=Y(卜2)
Y(Ⅰ)くY(【−2)
エー2
lノヽノ
12
■d ..D C
GOTO 34 GOTO 11 GOTO 34 GOTO 34 GOTO 11
卜3
ヽノニヽノ ▲12
エー2
H
u門 L
‖M
Y(Ⅰ−1)>=Y(T−3)
NB=0
ⅣB≠O NB=NP NB≠NP Y(Ⅰ−1)くY(Ⅰ−3)
NB=O
NB≠O AND NB=NP
YくⅠ−2)くYくⅠ)
Y(Ⅰ−2)>=Y(工)
GOTO 32 GOTO 32 GOTO 32
GOTO 32 GOTO 32 GOTO 32
Ⅰ−3
Ⅰ−3
エー1
Ⅰ−1 Ⅰ−2
︶ ヽノ
■■▲2
NB = number of troughs NP = number of peaks
Tabl¢4 Criteria rorcomplica七ed di$七山butions;Process y and G Treatnent Order of
up and down●
Destirlation to connec t●●
Recogn==on Conditions
Decision
Trough Peak
NB≠O AND NB≠NP
Y(卜2)is bigh8r than
the nearest peak
Yく卜2)is lower than the nearest peak Y(Ⅰ−1)く=Y(Ⅰ−3)
Y(Ⅰ−1)>Yく卜3)
ⅣB=0
ⅣB≠O AND NB≠ⅣP YくⅠ)くY(Ⅰ十2)
Y(Ⅰ)>=Y(卜2)
NB≠O AND NB=NP Y(Ⅰ)くY(エー3)
Y(Ⅰ)>=Y(Ⅰ−3)
∫eplace the r−1 lalest peak GOTO 32
w=h r−2
卜1 GOTO 32
GOTO =
卜2 卜1 GOTO =
GOTO = GOTO = GOTO = GOTO = 1−2
Ⅰ−1卜1 卜1 NB = numbe√ Of troughs
NP = number o【peaks
Method for Polymoda】FrequencyI)istribution Analysis andiもApp】ication・
._‥三二二ニ ニニニ
ニニニ_ __三三二_ ̄ ̄二__
2l
一っ 一三 −1 じ ◆t
C ̄
_二二三ニ
 ̄
._≒二∴
distributiorleaSeS;Proく:eSS B
−3 −2 −1‡) ◆t −3 −2 −1 0 ◆t I2
n一志短Ll毎払
P C−2−4 P n ̄適宜虹
−コ ー: −1
P C−2−b P い三‥二_二三 _
Fig.4 Graphica王explanation orcriteria usedin complieated and C.P shows peak admitted aれd V tro帽h admitもed・
l)−・l
_二二二二二…
一っ ー: −1
 ̄
ニ±二二二__
2〉
二
−3 −2 −1 (】 11
:)−・l−b
Jm
−1 ・コ ・1 0 11Ⅰ)一月−¢
【) 」 ̄ト「トト
ー3 一正 −1 0 11
:】P
−8 −2 −1 【l ◆l
−3 −2 −1 α ◆1
2〉 二=二_
−3 −2 −1 0 ◆1
11−ユーll
∴ ̄三三_
−3 一: 一l コ り D−1
…二二二___
−コ ・: −1 0 ●l
l二三二
三±二二‥
−) −: −1
一っ ー= −1
_二____
Rg.5 GrapbicalexplanaもioれOr Cri七色ria usedin complicaもed distril)ution cases;Proce5SI)・
J〕shows pealくadmitted and V trough admitted.
KenjiAsANO amd SyoitiTANAKA
22
ニーニニニーニ__
 ̄ヨ ーニ ー】 6 り
 ̄三二_.__
F壱虹L
_.‡∴_=二
逝G丑』L
_…二二三._
−: −L D ・】
(;一三ーC
−3 −2 −1 8 十‡ −? ・3 ・2 −1 0 ◆暮
壱正LG基恥_避
Fig.6 Grapbicalexplana臼on or criteria us8din complieaもed distribution cases;Process F
and G.P shows peak admiもted and V trough admitted.POindic乱teS theれear¢St
Peal(.
Results
l.Number of peaks,trOughs and discontinuous spaces appearingin the frequencY distribution Tables5〜7show the result obtained by the above alg・Oriもhm.0varies are classified by the number or peaks and the numbers or ovaries aregiven roreachsamplein the七色ble.
でhe number or peaks varied rrom one to six.The si堀1e peak distribuもion typeoeeupied alarge part at汰e b曙inning or the spa\Ⅶiれg period berore March.でhen ule double peak
typeincreased,and witbits decrease the3peak type became dominant.Arter that,the OVaries or the more tha.n3peak disもribuもionもype appeared.
Examini帽もhe annualchang●esin Fig.7,it was round thatin1977もhe double peak distrib此ぬnもype was prevalent earlyin March.When沈is type decr飽Sed earlyinMareh,
もhe dominantもype chan酢dも0もhree peaks.でhe double peakもypeincreased againin May
in1977・In1979,thedominant typechanged rrom thesing・lopeal(tOもhedoublepeak type earlyinIrebruary・Subsequentlyin March,the3peak type dominatedin thecomposition Or the peakもypes.In tbat year4and5peak types rirst appeared earlyin March,and the polymodeldisもriもuもions or ovaries ofダour tbro将h six pealくtypeS COntinued to occur
untilearlyJune,thoug■h tbe proporもion waslow.
でhe appearance or DSis summarizediflTaも1es5〜7,In1977,210Varies from a total
Method ror PolymodalFrequemeyI〕istribution Analysis amdlt Applicaもioれ. 23
烏ble5 Number or pe乱ks aれd discontinuous$paeeS(Ⅰ)Ss)appeari咽in rrequency di$けi如tion or喝g diamet8rS.Sampl8S COl】ectedin year1977
Number of p8aks Number of
ovaries which have the DS
1 2 3 4 5 6
975941ハU6125 233223▲d﹁4.4A−2
1962d一288000∩
00120112110
33ハーリ34■4一44556
7
7 9
1 20(1) 8
8 26(1) 3 2 18 15く3)
2 21
616
820 11
10(1)29(5) 1 3(1)21く2)20(1) 2
17(1)23(3) 1 23 17
25(1)20(2)
T O T A L 379 16 197 160
6()indicates the numbeT Of ovaTies vhich have the DS.
Table8 Numberof peaksand di8COntir)uOuSSPaCeS(DSs)appearingin frequencydistribtltion ol egg
diameもers.S乱mPle$COllectediれyear1978
Ⅳumbe∫ Of p¢aks NumbeJ Of
ovaries whlch have the DS
1 2 3 4 5 6
47769ハU O A﹁8QUハU
22221223222
760752519J7 011120011∩0 334d..4.555556
QU
7
9 2 15(1) 7
4 23 4 23 6 20 4 15 1 15(3
1
8(2)10(4 7(1)25く2
1
7(2)14(8
2 10 14く1
5く2)14
l ■ ︻ ︼ 一675633
︶ ︶︶
▲■−⊥ l l ′ヽ ′ヽく
l l 1
211521
︵ ︵ ︵ ′lヽ ︵ ′lヽ 3Jl・・上521
︶ ヽノ .■ノ ︶ ヽ■′
T O T A L 273 6 71 18〔l 13
341
()indicates the nuTT)beT Of ova[ies vhich have the DS.
KenjiAsANO and SyoitiTÅNAKÅ
24
職ble 7 Number or peaks and discontinuous spaces(】)Ss)appearingin r柁quenCy distribution or曙g diameters.Samples collectedin year1979
Number of ovaries which have the DS NuJbber of peaks
1 2 3 4 5 6
9ワニ7二日7
7
14(2) 1 25(1) 6 23
218
911く2)22 6(2)13 4 26
亡U285d−580ハU190001
12︹J33323331522
51︵b4り︼27480676−エ
2爪U O1200−12220・・・10
12222333344556
9 7
9 −21 ■ −3一q ︼ 凸06.d﹁.d︼48 4
6
′lヽ
26
13
′︳ヽ′tヽ
3 一・l lふ
′■ヽ ′\ ′1 3 11▲d︼123・・−■一q ′ヽ′ヽくく′lヽ′1ヽ
613525
2
10
1
7 4
33213
′t1.︵′l︑︵︵ −▲8582 ∩ 1132
1 15(4
T O T A L 一=7 40 133 208 30
5 1()indicales the nun]ber of ovaries which have the DS.
of379individuals had tbe DS,410Varies out of273rishin
1978and540Variesin417rishin1979.The ratio of the ovaries which hadもhe DS ran酢d rrom a few%to57.1%depending On Sampl臥DSs oecurredin allof disもribution types from One*to6peaks,but tbe majority of them belon酢d toもhe 2〜4peak type.Most or tbe ovaries or t‡le4〜6peak typeshad one or rnore DSs and particularly all the ovaries of Lhe
5〜6peakもypes had DSs.W‡lenan OVary hadaI逓,汰enum一 転ror鵠srang・drromonetothr(黒.SingleI迅∝Cupid84.5%,and14.7%had a doubleI〕Ss and only O.9%had汰ree DSs.
Åmo噌もhe ovaries which had double DSs,もhe4peaks type
WaS47%,the3and5peak types were23.5%respectively・
Only oneindividualwas foundwith three DSs,and this was
identified asもhe six peak type.
〟‖)N=「1
Rg.7良さ鵡Onalcbangeincom・
POSition or the number Or 膵aksin rrequen噂 disもribuもion or曙g dト am飢愈帽.Numl光rin the ri訃㈹Showgrou膵Cla鎚i・
rieda∝Ordi堀tOnum馳r Or p組1くS.
2.Relationship between DS and distribution type From the
匹Sitionsof theI濾swhiehap搾乳rintherrequencydistribuもions Or曙g diameters or theovaries ormackerel,WeCan Classify the disもribuもionもypes and grasp the dynamics or transitions rrom one type to another.でhe relationships between the po−sitkn of the DS and the distribution types which areidenti−
*Thecaseis that a DSwas det既ted and some numberor eggs were roundinlargereg官Sizeelasses
than thBrangeOrthe王〕S≠butthcirnumtx!rWaSSOSmallortheformofdistributionwassoirregular
that七bey did noもform p組ks,and only peak No・1was admitもed・
Method ror Polymodal‡㌢requeれey r)istributぬn A11alysIS and比Application. 25
ried by the number of peaks and troughs are as follows.
でroug・b the DSIlaS SOmeienがh,もhe posi−
もion ofI〕S may be r叩reSenもed by themidpoint 6_6 0fもheDS.The positions oftheDSwithr曙ard 6 ̄5
山5−5 m
>5−ろ
ト
ム−4
Z与−3
;⊃−3
■●
● ●● ● ●●
L.且_
應‰.一
山.L−い.
.臥し
.l.‥ Jd■
●●●●
to the dirrerent ty鱒S Or tbe rrequency disもribu−
tions o仁曙g diameters are showninIPig■.8.
DSs ap卵色redin a range from O.472〜1.012m汀1−
Or these,6.0%werelocatedin o.6〜0.7mm,
44%in O.7〜0.8mm,31タすin o.8〜0.9mm,and 12.9%in o.9〜1.O mm.Thus75%of the DSs appearedin O.7〜0.9mm.Asも0もhe relation between the number or p挽ks乱nd troug■hs and thc positions ofいICl)Ss,SOmC Of the2pealく type t¢nded to appearin thelower part or the はn酢,but血oseofmorethan2搾乳ぬa訳卿等温もd to appearin the rang■e O.7〜0.9mm or more.
3・・2 8:
㌫2 ̄2 昌2−1
卜1 ト0
0・2 0・ム 0・6 0・8 1・0 1・2くmm)
E G G DIAト1E T ER Fi9.8 Rぬtionship between position or
discontinuous spaccs(l)Ss)and thc
distribution types shown by もhe number or peaks乱れd troughs.
This sug嘗eSもS that洩ereis a possit〉iliもy that
theovariesof3peak−2troughty匹OrmOreCOn七色inthe曙gSOrmOSもadvanαdsta酢(0・7〜0・9
mmand叩Ward);mOSもOr班emare hydrated.Because,in the ovaries of2−2type orless,
the DSislocatedin the smaller part of the range comparatively,these ovaries conもain manyimmaもure or developing曙gS.
Toexamineもhe position ofもheI)S correspondi将tO the peaks,the relationship between the positions or the DS and those orもhe peaksis shownin Table8・‡n a totalorl16in−
Tab[e 81iclaLionship beい1・CCn PCaks nnd posiしiollS Or disconLilluOuS SpRCCS
r n【e r v al b e t w e e n
p e a k
F r e q u e n c y
8916
23
ウ山845
−一一一
1234 1234 T
O T
0525 6
12 1
1
L++++ A
d U−e t k e
八d a t k
C e a a
∧V p C e
l 爪V br
d▲l
S n .▲−1
・1 a S O
SVA e
D S JU
knU・i .
a a Sヽノ
e a k
S p ・.し a
n S h e
a n n g P.
e e a・・l
m e e r▲・l
W m S
Vl t p︶ a
− e▲十LH∵−1
V∧b V∧ ▲1 ︵
* *
*
Kcnji AsnNo and Syoiti TANAKn
26
dividualsin which the DSs appeared,25%of them werelocated between peaks No.2and No.3,26.7%もetween No.3and No.4.For those ovaries where theI)Ss象ppearedin the righL side of thelast peak,12.9%appeared at the right of peak No.2,19・0%atもhat Or No.3.Summarizir将the results,those whicb叩peared atもhe rig・ht side or peak No.2 were37,9タ r堵ardless of the presence orもhe peak No.30r mOre,45・7%at the right of the peak No.3,SO tOtally83.6%were round atもhe right hand oi◆peak No.20r No.3.
The process of development viewed rrom the appearance of the DSsin the ovaries of
macker81is summarized as rollows.1.With the progressin the maturation of the ovaries,曙gSincr飴Seもbeir size and the2〜3p紘k types become dominanもamong the rrequeney distrib血ions.
2.\Vhen the maximum diameters or eggs r飽Ch around o.6〜0.7mm,SOme Of喝gS 即OW rurもher b町Ond the DS.でhese曙gS rOrm Peak No.4and upⅥ7ard.
We may conclude tbat rorもhe ovaries or maclくerel,2〜3peakもyp¢S dominaもedin the f■requ鮒Cy distrit)uも主ons or egg diameters.8ut mosもOr the ovaries with the DSs are the
type of4peaks or moreandDSs arelocatedin O.7〜0.95mmand haveeggsinlargersized
than 汰eI〕S.
Discussion
The method or analysing p飽ks and troughs presentedin this paperis rundamentally dirferenもrrom oth即methods or curve ri汰ing.Tbough there乱re SOme mathematicaland theoreticalproblems,the meもhod allowsもhe analysis of tbe polymodeldisもribuもねnsinもO
a錆wp翰ksandtro帽おbysimpleandsystematicway.As theanalysisisdonebycomputers,
thereis no chanceofsubjective judgement byindividualscientists once thecriteria are set.
The algoriしhms arc casy Lo mod巾T a【1d change.Whilc Lhcrcis rooml.orimpro\▼ing Lhe criteria,Sとillsucb a simple method as thisis quiもe usefulror this type or study.
Toimprove抽e criteria,it willbe necessary for the method tointroduce stat,istical COnCeptS.Once the position and heigbt or the peaks are determined,fiもting・Of■normaldis−
tribution curves willbe performed easily.Extenもion oL this method toward this direction WOuld be next course or dev¢lopmenも.
Acknowledgement
We血ankDr.TakeoIshii,0伐anI撫searchIns血ude,University or Tokyo,rOr his useful SuggeSもions which greatly assisもedもhe study.
References
AKÅMl・NE,T.,1982−A BASiC prograrrltO analy$e the polymodalrrequency frequency distributioninto normaldis七ribuもions.β混Jg.∫叩.ざgα.鮎g.ダgβん.月eβ.エαあり 33:163−166.
1984.でhe BASiC programもO analyse the polymodalrrequency distribution5With Marqualdも s