Such onboard measurements of pH
Twith good repeatability, taken every 45 minutes at an interval of about 12 nautical miles, can be used to find fine structures of pH
Tdistribution in near-surface seawater. During cruise MR02-K06, a clear boundary was observed near 172° W at the east end of the western Pacific warm pool (Fig. 4). In the warm pool, pH
Twas higher than 8.120. It exceeded 8.140 in the region from the international dateline to 172° W. In the divergence zone to the east of 160° W, pH
Tdecreased towards the east (minimum 8.069 at 160° W). The results of these observations will be described in a future report.
4. Measurements of bottle samples taken at depth
For pH
Tanalysis of bottle samples collected at depths with the CTD/carousel sampler, it has been recommended that the seawater samples be directly withdrawn from Niskin bottles into the optical cells (DOE, 1994). However, it is not convenient to prepare and handle many optical cells during fieldwork.
Therefore, we examined the use of sampling bottles and the effect of sterilization with HgCl
2.
In our study, ca. 500 cm
3of water sample was drawn with a silicone rubber tube, which was connected to the outlet cock of a Niskin bottle, into a 250 cm
3borosilicate glass bottle (250 cm
3was overflowed). After the temperature of the sample was adjusted to 25.0
0± 0.05 °C in a water bath, the sample was introduced into the sample loop of the measurement system with a peristaltic pump (see Fig. 1).
During cruise MR02-K06, bottle samples were taken in duplicate from a Niskin bottle. The repeatability for the measurement of bottle samples as inferred from duplicate measurements (Fig. 5) was 0.0011 (1ı, n = 32). Problems associated with the comparability and precision of pH
Tmeasurements of bottle samples
Fig. 4 Horizontal distributions of a) pH
T, b) temperature
and c) salinity in near-surface water along the equator
observed in January 2003 during the R/V Mirai’s
MR02-K06 cruise.
include a) CO
2exchange between the sample and ambient air during bottling and during withdrawal of the sample from a rigid glass bottle, b) hydrolysis of HgCl
2and dilution caused by addition of saturated HgCl
2solution and c) pH
Tchange during storage owing to imperfect sterilization or sealing.
4.1 Effects of bottling and headspace
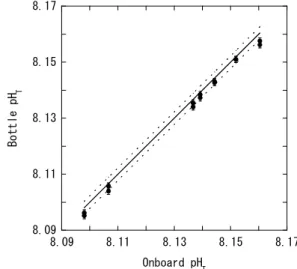
The effects of CO
2exchange with ambient air during bottling and exchange with the headspace in a bottle, which arose from withdrawing a seawater sample from a rigid glass bottle, were examined by comparing the analytical results of onboard pH
Tmeasurements with those acquired from bottle sample measurements.
Bottle samples were taken from near-surface water (see Section 2.6) immediately after onboard measurement. No HgCl
2solution was added to these samples. The difference in pH
T(bottle minus onboard) was –0.0019 ± 0.0010 (1ı, n = 14; Fig. 6) and was significant, considering the repeatability of onboard measurements (0.0002) and that of bottle sample measurements (0.0011). However, the uncertainty due to bottling and short-term storage of seawater samples in bottles was as small as the required precision described in the introduction (±0.002).
' R*
65GSWGPEGPWODGT
F i g . 5 D i f f e r e n c e s i n p H
Tb e t w e e n d u p l i c a t e measurements, ΔpH
T, of bottle samples without HgCl
2addition. The short-term standard deviation (repeatability) of the measurements was 0.0011, calculated with Equation 3 in SOP 23 described in DOE (1994).
$Q VV NG R *
61PDQCTFR*
6Fig. 6 Comparison of pH
Tbetween bottle and onboard
measurements without HgCl
2addition. Error bars indicate
the standard deviation of measurements. The solid line
indicates a slope of 1. Broken lines indicate the error limits
(±2σ).
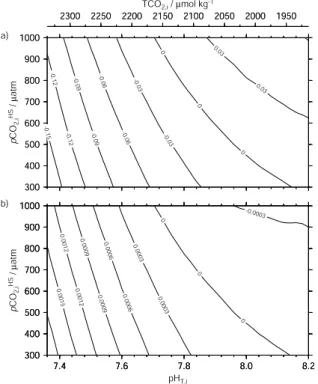
Using a method similar to that used to correct for pCO
2perturbation in bottle samples, we calculated the change in pH
Tcaused by CO
2exchange between a sample and headspace in a bottle (DOE, 1994; see Appendix A for details). For surface water (initial pH
Tof ~8.12), the estimated effect of the headspace on pH
Tranged from –0.0003 to +0.0000, depending on the initial headspace pCO
2value (Fig. 7).
These changes were sufficiently smaller than the above-mentioned repeatability of pH
Tmeasurement for bottle samples. Therefore, the effect of headspace, which is less than 1% of the sample volume, on the change in pH
Twas negligible for surface water. For deep waters (initial pH
Tof 7.48), the estimated effect of the headspace on pH
Treached a maximum of +0.0012 for an initial headspace pCO
2value of 350 ȝatm (Fig. 7). This change was also comparable to the repeatability of pH
Tmeasurements and was hardly detectable. With regard to bottling and headspace, we concluded that pH
Tvalues for bottle samples should reasonably agree with onboard measurements within ±2ı (0.002) of the repeatability in bottle sample measurements.
Fig. 8 Observed pH
Tchange caused by the addition of 0.2 cm
3of saturated HgCl
2solution to 250 cm
3seawater (closed circles). The broken line shows the linear regression of observed values, pH
T(0.4) – pH
T(0.2) = (–0.00094 ± 0.00059) pH
T(0.2) + (0.00616
± 0.00465), γ
2= 0.17, p = 0.14. Calculated values (solid line) were obtained from TCO
2and TA using stability constants β of Hg
2+complexes at ionic strength 0.7. Dotted lines indicate the uncertainty (±2σ) of calculation derived from the variability of inputted Fig. 7 Effect on pH
Tof headspace of 2 cm
3in a
250 cm
3sample bottle. a) Quantity of CO
2(μmol) exchanged between sample and headspace and b) pH
Tchange caused by CO
2exchange between a seawater sample and air in a bottle.
R*
6R*
6R*
6R*
6R*
64.2 Perturbation of pH T caused by addition of saturated HgCl 2 solution
The pH
Tmeasurements of 27 bottle samples collected from various depths at a given station took about 8 hours. If a sample is not sterilized, its pH
Tand its TCO
2could change owing to biological activity occurring prior to measurement. Therefore, bottle samples must be sterilized with saturated HgCl
2solution.
However, the addition of saturated HgCl
2solution may affect pH
Tbecause of hydrolysis of HgCl
2and dilution of the sample. To evaluate the perturbation of pH
Tcaused by the addition of HgCl
2solution and to correct for this perturbation empirically, we compared the pH
Tvalues of 14 pairs of samples taken from several ocean layers ranging from the surface to a depth of 794 m in the equatorial Pacific Ocean (from 170° W to 165° W) during the cruise MR02-K06. Duplicate samples were collected at each depth, and different volumes of saturated HgCl
2solution (0.2 and 0.4 cm
3) were added to each of a given pair of samples.
The injection of additional 0.2 cm
3saturated HgCl
2solution to each sample already containing 0.2 cm
3saturated HgCl
2caused pH
Tchanges (pH
T(0.4) – pH
T(0.2)) ranging from –0.0024 to –0.0003 (Fig.
8, closed circles). These changes appeared larger for samples with higher pH
Tvalues, but the correlation was insignificant (Ȗ
2= 0.17, p > 0.1). Therefore, we corrected for perturbation caused by HgCl
2addition by adding a constant value of 0.0012
3(average of pH
T(0.4) – pH
T(0.2)) to measured pH
Tvalues. The cause of this perturbation is discussed later in Section 7.2.
4.3 Storage of samples
We investigated whether it was possible to store seawater samples for pH
Tanalysis for a period of a few months. To monitor the change in pH
Tof seawater samples stored in borosilicate glass bottles, we collected approximately 20 litters of surface water at 4° 10’ N, 156° 40’ E during the cruise MR02-K06.
This large sample was subsampled into 30 borosilicate glass bottles 250 cm
3each and then sterilized with 0.2 cm
3of saturated HgCl
2solution before being plugged with a greased ground-glass stopper. The sealed samples were stored at room temperature. The mean pH
Tfor samples stored for 50 days was 8.1252 ± 0.0011 (1ı, n = 21; Fig. 9). There was no significant temporal change (Ȗ
2= 0.06, p > 0.2). This result suggests that surface water samples can be stored for pH
Tanalysis with a precision that is comparable to the repeatability of pH
Tmeasurements of samples without HgCl
2addition (±0.0011).
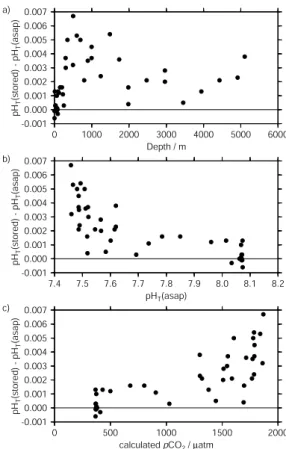
For deep-water samples, 42 pairs of duplicate samples were collected at layers ranging from the
surface to a depth of 5104 m at 0°, 160° W during the cruise MR02-K06. One of the duplicate samples was
analysed within 15 hours after bottling (referred to as
“asap”), and another was analysed 50 days later at a laboratory on land (referred to as “stored”). The changes in pH
Tranged from –0.001 to +0.007 after 50 days of storage (Fig. 10). The change in pH
Twas larger at 400–1500 m, where pH
Twas lower than 7.5. The negative correlation between the change in pH
T(=
pH
T(stored) – pH
T(asap)) and pH
T(asap) (Fig. 10b) and the positive correlation between the change in pH
Tand pCO
2(Fig. 10c) suggest the possibility of CO
2gas exchange between ambient air and samples taken at depth, where pH
Twas lower than 7.5. A change in pH
Tof +0.005 corresponds to a change in TCO
2of –4 ȝmol kg
–1at constant TA. However, TCO
2values previously have been observed to remain unchanged when samples are stored by the method described here (Ishii et al., 2000). Since pCO
2is high in deep-water samples with lower pH
Tand higher TCO
2than those in near-surface seawater, CO
2could escape from deep-water samples during sampling and measuring processes. Further studies are needed regarding the storage of seawater for pH
Tanalysis.
R*6
5VQTKPIVKOGFC[U