フィールドサイエンス
Journal of Field Science
ISSN 1347-3948
Journal of Field Science
No.4 December, 2003
FIELD SCIENCE CENTER, TOKYO UNIVERSITY OF AGRICULTURE AND TECHNOLOGY
Fuchu, Tokyo 183-8509, Japan
Articles
1 Effects of tillage and pesticides on nitrous oxide emission from an upland field/ Fujinuma, R. and Matsumura, S.
9 Acidefication of Precipitation in Tottori, Japan/ Hara, H. and Kimura, Y.
19 Effects of Feeding Food Waste Products on the Growth and Meat Quality of Growing-Finishing Pigs/
Miyazawa, K., Ishida, K., Hirata. T., Tanaka. Y., Ai. T., Tominaga. M., Yokoyama. M., Makino. M., Ishii.
K., Ueno. K., Kanda. S. and Itabashi. H.
Research materials
25 Collection ofLycopersicon esculentumand wildLycopersiconspp. in Republic of Chile/ Kawabe, M. and Arie, T.
33 A charcoal kiln with an iron plate ceiling improved at University Forests of TUAT/ Uchida. T.
フィールドサイエンス
ISSN 1347-3948
No. 4 2003
東 京 農 工 大 学 農 学 部 附 属 広 域 都 市 圏 フィールドサイエンス教育研究センター
J.FIELDSCIENCENo.42003東京農工大学農学部附属FSセンター
平成15年12月
フィールドサイエンスVol.4●/表紙/表紙(3mm) 2019.06.06 11.06.24 Page 3
フィールドサイエンス 第 4 号
目 次
論 文
1 畑地からの亜酸化窒素放出に及ぼす耕起および農薬散布の影響/藤沼良典・松村昭治 9 鳥取における降水の酸性化(英文)/原 宏
19 給食調理残渣飼料の給与が肥育豚の発育と肉質性状に及ぼす影響/宮澤賢司・石田幸一・平田哲 兵・田中佑一・相俊彦・富永麻衣子・横山倫子・牧野茂三郎・石井 憲・上野啓介・神田修平・
板橋久雄
研究資料
25 チリ共和国におけるトマトおよび野生トマト属植物の採集/川部眞登・有江 力 33 東京農工大学フィールドミュージアム(FM)秩父式―鉄板天井式―の炭窯/内田武次
フィールドサイエンス編集委員会
編集委員長 板橋 久雄 東京農工大学農学部 FS センター長,教授
編 集 委 員 岸 洋一 FS センター教授
鈴木 馨 FS センター助教授
島田 順 FS センター教授
松村 昭治 FS センター助教授
平田 豊 生物生産学科助教授
岩渕喜久男 応用生物科学科教授
楊 宗興 環境資源科学科助教授
峰松 浩彦 地域生態システム学科助教授
柴田 秀史 獣医学科助教授
石井 泰博 硬蛋白質利用研究施設教授
事 務 局 赤井 義一 FS センター事務長
英文校閲者 CRIPE, R. A. Spacegate, Tsukuba, Ibaraki, Japan
Editorial Committee of Journal of Field Science
Editor-in-Chief
Hisao ITABASHI Director of Field Science Center, Professor of Tokyo University of Agriculture and Technology
Editorial Board
Yoichi KISHI Professor of Field Science Center
Kaoru SUZUKI Associate Professor of Field Science Center Jun SHIMADA Professor of Field Science Center
Shoji MATSUMURA Associate Professor of Field Science Center Yutaka HIRATA Associate Professor of Dep. of Biological Production Kikuo IWABUCHI Professor of Dep. of Applied Biological Science
Muneoki YOH Associate Professor of Dep. of Environmental and Natural Resources Science Hirohiko MINEMATSU Associate Professor of Dep. of Ecoregion Science
Hideshi SHIBATA Associate Professor of Dep. of Veterinary Medicine Yasuhiro ISHII Professor of Scleroprotein and Leather Research Institute
Management Office
Yoshikazu AKAI Chief of Field Science Center Office
English Referee
CRIPE, R. A. Spacegate, Tsukuba, Ibaraki, Japan
平成15年12月15日 印刷 平成15年12月20日 発行
発 行 所 東京農工大学農学部附属 FS センター
183―8509 府中市幸町3―5―8 042―367―5799
印 刷 所 電 算 印 刷 株 式 会 社
390―0821 松本市筑摩1―11―30 0263―25―4329
フィールドサイエンスVol.4●/表紙/表紙(3mm) 2019.06.06 11.06.24 Page 4
論 文
畑地からの亜酸化窒素放出に及ぼす耕起および農薬散布の影響
*1藤沼 良典*2・松村 昭治*2
Effects of tillage and pesticides on nitrous oxide emission from an upland field
Ryousuke FUJIMURA*2and Shoji MATSUMURA*2
1.はじめに
地球の平均気温は,1860~1920年の60年間は約 0.2℃の範囲で変動したが,上昇傾向はみられな かった。しかし,1920年以後,平均気温は徐々に上 昇し始め,20年間でそれまでよりも約0.3℃上昇
し,1950~1980年の間は一時的に横ばい状態を維持 したが,以後再び上昇に転じ,1992年までにさらに 約0.3℃上昇した(Houghton 1994)。この上昇傾 向は現在も続いている。このような地球規模での温 暖化現象の原因は,直接的には大気中の二酸化炭 素,メタン,亜酸化窒素,フロン(クロロフルオロ Nitrous oxide flux from upland field of TUAT, Fuchu, Tokyo, where soybean was grown, was continu- ously determined in 1995. The objective is to examine the effects of field managements such as tillage, amendment application, pesticides spraying, on the emission of nitrous oxide from the upland field. Eight treatments, which were made by combining three treatments of tillage(tillage or no tillage),amendments
(manure or fertilizer)and chemicals(pesticide or no pesticide),were set up in the Andi soil field of 1.5 ha.
Nitrous oxide flux had continuously been determined by the chamber method from the beginning stage of soybean to the harvest time.
As the results, the treatments of amendment application and pesticide spraying did not affect the amount of nitrous oxide emitted from the soil, but it was shown that the tillage treatment increased the nitrous oxide flux about 20% in comparison with no tillage plots.
Keywords: Emission of nitrous oxide, Soybean Field, Tillage, Amendments, Pesticide
東京都府中市の大学農場において1995年にダイズ栽培中の圃場から放出される亜酸化窒素(N2O)量を測 定した。目的は耕起作業,施肥連用,化学肥料,農薬散布などの管理作業が N2O 放出量に及ぼす影響を明 らかにすることである。1.5ha の火山灰畑圃場に,耕起処理(耕起または不耕起),施肥処理(堆肥 M また は化学肥料 F)および農薬散布の有無を組み合わせ,8試験区を2連で設置し,ダイズの生育初期から収穫 期まで,チャンバー法で定期的に N2O 放出量を測定した。
N2O 放出量に及ぼす各処理の影響を統計的に解析した結果,施肥処理(F または M)は N2O 放出量に全 く影響せず,農薬散布処理(P または NP)も同様であった。しかし,耕起処理(T)区では不耕起(NT)
区よりも放出量が約20%多い結果となり,耕起作業が N2O 放出量を増大する方向に作用すると推察された。
キーワード:亜酸化窒素放出量,ダイズ栽培圃場,耕起,施肥資材,農薬散布
*1 Received Oct.2,2002;Accepted Apr.5,2003
*2 東京農工大学農学部附属フィールドサイエンスセンター 〒183―8509東京都府中市幸町3―5―8:Field Science Cen- ter, Faculty of Agriculture, Tokyo University of Agriculture and Technology, Fuchu, Tokyo183―8509, Japan
フィールドサイエンス(J. Field Science)4:1―8,2003 1
カーボン)などの濃度上昇であるとされて い る
(IPCC 2001)。
亜酸化窒素(以下 N2O)は自然大気中に微量に存 在するガス成分であり,1750年の段階での濃度は 270ppb であったが,1998年には314ppb となり,
1990年代における増加速度は0.8ppb/年に達する
(IPCC 2001)。N2O の年間総発生 量 は14.9TgN とされ,そのうちの10.8TgN は海洋や自然土壌な どの自然的発生源に由来し,4.1TgN が農耕地や 畜産などの人為的発生源に由来すると見積もられて いる(IPCC 2001)。近年の濃度上昇は人為的原因 によると考えられ,とくに農耕地からの発生量が比 較的多いことから,これを低減する方策が課題と なっている。N2O はアンモニア態窒素(NH4+-N)
が硝酸態窒素(NO3--N)に酸化される過程(硝化 過程)で発生するとともに,NO3--N が N2に還元さ れる過程(脱窒過程)においても発生することが知 られており,すなわち,農耕地に肥料として施用さ れる窒素が多ければ多いほど発生量が増加する可能 性が高くなる。
世界の人口は2030年には約80億人に増加すると予 測されることから,農耕地における食糧生産活動が 今後さらに集約的に行われることは必至であり,窒 素施肥量も増大せざるをえない。したがって,農耕 地における施肥の問題,とくに施肥資材の種類およ び施用方法と N2O 発生量との関係を明らかにし,
発生を抑制する技術を開発することが望まれる。
東京農工大学農学部附属フィールドサイエンスセ ンター(以下 FSC)の畑圃場では,1993年以来,
わが国の風土に適した環境保全型農業の確立を目標 として,これまでの栽培体系を見直すための長期圃 場試験が行われている。この試験では,化学肥料や 有機質資材として投入される養分の動態,耕うん作 業や農薬散布が土壌を中心とする生態系に及ぼす影 響,機械による合理的除草体系の確立などが主な研 究課題となっている。作物収量に及ぼす施肥資材と 耕うん法の影響をみると,トウモロコシやコムギの ようなイネ科作物では化学肥料が堆肥よりも肥効の うえで優り,ダイズでは逆になる傾向が認められる こと,また,耕うん法の影響は大きくないことなど が示されている(松村ら 2000)。本報では,施肥 養分の動態研究の一環として,施肥資材の違い,耕 うん法の違い,および農薬散布の有無が圃場からの N2O 放出量に及ぼす影響について調べた結果を報告 する。
2.材料および方法 2.1 試験圃場およびダイズ栽培方法
本試験は東京農工大学農学部附属農場(現 FSC 府中農場)の畑作長期試験圃場(腐植に富む黒ボク 土壌,土性 L,面積1.5ha)において実施された。
この土地は1940年代から畑として利用されていた が,起伏の多い地形であったために,1991年度に基 盤整備が行われた圃場である。この工事では,まず 表層の黒ボク土壌をすべて剥いでおき,下層に同質 の赤土を搬入して圃場全体を均平化し,その上に黒 ボク土壌を同じ厚さに埋め戻した。こうして,厚さ 約0.5m の腐植に富む火山灰土壌の表層と厚さ数 m の赤土の下層を重ねた構造の供試圃場が整備され た。1992年5月から1993年6月まで無肥料でトウモ ロコシとコムギを栽培し,1993年7月から栽培試験 を開始した。すなわち,深さ25cm までロータリー で毎作耕耘する耕起(T)と,耕起を行わず播種の ための整地作業として深さ5-6 cm にロータリー をかける不耕起(NT,一般に播種前の整地や除草 のための中耕作業は耕起に含まれない),化学肥料 連用(F)と堆肥連用(M),および農薬散布(P)
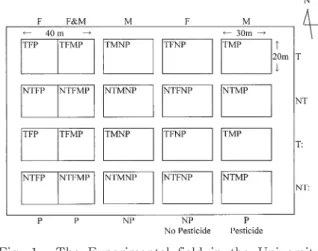
と無農薬(NP)の3因子2水準からなる L 8(23) 直交配列を基礎とした試験区が設定され,さらに化 学肥料と堆肥を半量ずつ施用する併用区が加えられ ている(各2連,Fig. 1)。まず,飼料トウモロコ シを栽培し,’93年冬にエンバク,’94年夏に再び飼 料トウモロコシ,’94年冬にコムギ,’95年夏にダイ ズが栽培された。エンバクや飼料トウモロコシは地 上部全体が収穫目的部位であり,刈り株以外は圃場
Fig . 1 . The Experimental field in the University Farm, TUAT
T : Tillage, NT : No-tillage, M : Manure, F : Fertilizer, P : Pesticide, NP : No-pesticide
フィールドサイエンス 4号 2
外に搬出される。コムギの場合も,コンバインで穀 粒収穫後,刈り株以外は機械で集めて圃場外へ持ち 出される。刈り株や収穫の際のロス部分は,耕起区 では深さ25cm まで鋤き込み・混合されるが,不耕 起区では深さ5 cm までに残存することになる。
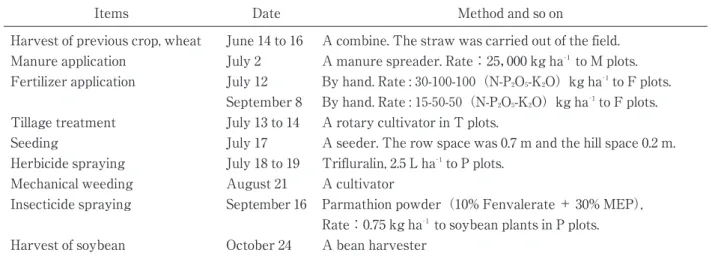
本試験はこのダイズ栽培期間中に実施された。主 な管理作業の内容は Table 1のとおりである。す なわち,前作のコムギを収穫後,施肥処理として,
M 区 に は7月2日 に 牛 糞 オ ガ ク ズ 堆 肥(N-P2O5- K2O としてそれぞれ0.65-0.15-0.70%含有,C/N 比21.6)を25,000kg ha-1の 割 合 で マ ニ ュ ア ス プ レッダーを用いて全面散布し,一方,F 区には7月 12日にアンモニア系化成肥料(組成3-10-10)を30- 100-100kg ha-1(N-P2O5-K2O)の割合で手作業によ り全面散布した。また,F 区では8月下旬に下葉が やや黄化する傾向が見られたため,9月8日に同肥 料 を15-50-50kg ha-1(N-P2O5-K2O)畝 間 に 施 用 し た。7月13~14日に耕起処理を行い,7月17日にダ イズ(品種エンレイ)を畝間70cm,株間20cm で 2粒ずつ播種し,発芽後の管理は慣行に従った。農 薬処理としては,P 区では播種直後に除草剤(トリ フルラリン44.5%含有乳剤)を2.5L ha-1地表全面 散布し,9月16日(ダイズ子実発育期)に殺虫剤 パーマチオン(フェンバレレート10%・MEP30%
含有水和剤)750g ha-1を散布した。NP 区には農 薬は一切使用しなかった。
2.2 調査項目および調査方法
土壌からの N2O フラックスの測定はクローズド チャンバー法で行った。チャンバーは,Matthias ら(1980)および八木ら(1991)の方法を参考にし て,ポリプロピレン製薄型コンテナー(45cm×
54.5cm×7 cm)を加工して作成した。堆肥・化
学肥料の併用区(Fig. 1の F & M)を除く16区画 を測定対象とし,このチャンバーを各区画内2地点 の畝間に深さ3 cm に埋め込んで設置した。設置5 分後と15分後に,あらかじめ真空にしておいた耐圧 バイアル管(15ml)を用いてチャンバーに取り付 けた針からサンプルガスを採集した(ただし,フ ラックスの少ない時期には設置20分後に2回目の採 集を行った)。採集時間は10~15秒とした。サンプ リングは毎回同じ地点 で 行 っ た(2連)。N2O フ ラックスは気温に依存し,一日の中でアレニウス回 帰を示すことが Conrad ら(1983)によって明らか にされていることから,サンプリングは午後2時を 中心に,午後12時30分から午後3時までの間に行っ た。
サンプルガス中の N2O 濃度は ECD 付きガスクロ マトグラフ(島津製 GC―14B)を用いて測定した。
分析条件は,ヘリウム(純度99.9999%)をキャリ アとし,流量30ml/min,カラム温度60℃,インジェ クション温度80℃,ECD 検出器温度340℃とした。
分析カラムはポラパック Q(50~80mesh,3 m)
で,ガードカラムとしてドライアライト(除湿剤)
6 cm とソーダアスベスト(二酸化炭素を取り除 く)6 cm を取り付けてある。分析に用いたサンプ ル量は0.5~1.0ml で,分析時の検出器の感度に応 じて変えた。この方法によって定量可能な N2O の 濃度は 約0.03ppm(N2O)で,す な わ ち,検 出 限 界は約0.02μgN であ る。校 正 は 次 の よ う に 行 っ た。容積1 L の標準ガス希釈用ガラス容器(三方 コック付き)内の空気を高純度ヘリウムガスで置換 し,この中にストッパー付きガスタイトシリンジで 100% N2O ガス1 mL を注入して1000倍希釈ガスを 調製した。このガスの N2O 濃度は1.2mgN L-1とな
Table 1. Records of field management for soybean in 1995
Items Date Method and so on
Harvest of previous crop, wheat June 14 to 16 A combine. The straw was carried out of the field.
Manure application July 2 A manure spreader. Rate:25,000 kg ha‐1to M plots.
Fertilizer application July 12 By hand. Rate :30-100-100(N-P2O5-K2O)kg ha‐1to F plots.
September 8 By hand. Rate :15-50-50(N-P2O5-K2O)kg ha‐1to F plots.
Tillage treatment July 13 to 14 A rotary cultivator in T plots.
Seeding July 17 A seeder. The row space was 0.7 m and the hill space 0.2 m.
Herbicide spraying July 18 to 19 Trifluralin, 2.5 L ha‐1to P plots.
Mechanical weeding August 21 A cultivator
Insecticide spraying September 16 Parmathion powder(10% Fenvalerate + 30% MEP), Rate:0.75 kg ha‐1to soybean plants in P plots.
Harvest of soybean October 24 A bean harvester
畑地からの N2O 放出(藤沼ら) 3
る。これを校正用標準ガスとし,1 mL ずつ用いて 20サンプルごとに校正した。1サンプルの分析にか かる時間は注入間隔を含めて約8.5分であり,約60 サンプルごとにカラムのエージングを行った。
こうして10分間または15分間におけるチャンバー 内の空気中 N2O 濃度の上昇速度を求め,チャンバー の面積から1ヘクタール・1日あたりのフラックス に換算した。ダイズの株全体を栽培期間を通じて チャンバーで覆うことは困難であるため,チャン バーを畝間の中央ではなく,できるだけ株元に寄せ て設置し,畝と畝間の両部分を覆うようにした。測 定間隔は原則として3~4日とした。
本試験では畑地からの N2O フラックスのほかに 気温,地温,土壌水分(pF)および土壌 pH を測 定した。気温はセンサー式温度計を用いて N2O サ ンプリング時(正午から15時の間)に地上約50cm の高さにおいて測定し,地温はセンサー式温度計
(Ebsero 社製 HI8054)を用い,地温と同日時に,
深さ約5 cm の温度を測定した。土壌水分(pF)
の測定は,N2O サンプリング時ごとに,試験区内の N2O サンプリング地点の深さ10cm における pF 値 をセラミックス土壌水分計 pF―33((株)藤原製作 所)を用いて行った。また,8月下旬から5回,深 さ0~10cm の位置から土壌を採取し,2M-KCl で抽出して無機態窒素を測定した。アンモニア態窒 素はインドフェノールブルー比色法で,硝酸態窒素 は 改 良 カ タ ル ド 法(Matsumura & Witjaksono 1999a)で定量した。
3.結果および考察
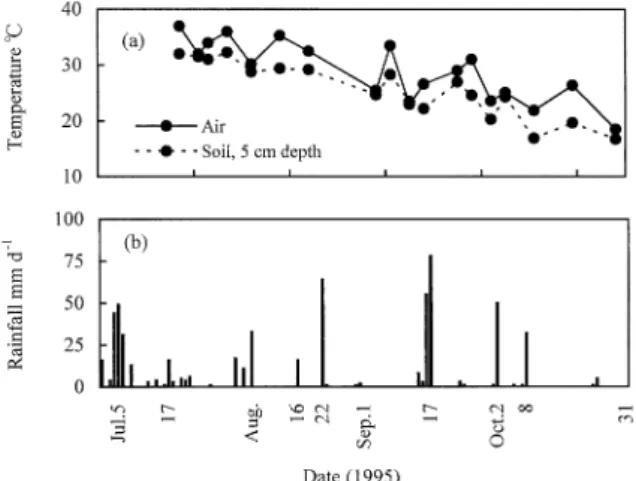
3.1 気温,地温,降水量および土壌水分の推移 測定を開始した7月下旬以来,8月中の気温(正 午から15時の間に測定)は常に30℃を超えており,
また,深さ5 cm における地温も8月上中旬には 30℃以上であった。その後,両者とも徐々に下降 し,10月初旬には気温は約25℃に,地温は約20℃に なった(Fig. 2-a)。降水のあった日数は17日で,
8月上旬,下旬,9月中旬および10月上旬に30mm 以上のまとまった降水があった(Fig. 2-b)。土 壌水分は F 区,M 区ともに8月中旬から9月初旬 まで pF2.0以上の値を示し乾燥気味に推移した が,9月初めの豪雨により乾燥は緩和された。9月 中旬から10月中旬にかけての約1ヶ月間は,M 区 の方が土壌水分が高い傾向にあった(Fig. 3)。こ れは有機物の連用により土壌中の腐植が増加して孔
隙率が増大し,降雨の後で保水量が多かったためと 考えられた。
3.2 N2O フラックスに及ぼす耕起,施肥および 農薬散布処理の影響
Fig. 4に N2O フラックスのデータを処理別にま とめて示した。全試験区の共通点として,N2O フ ラックスのピークは8月初旬および9月中下旬に認 められた。8月初旬には5日間で合計61mm,ま た,9月中旬には4日間で144mm の降雨があり,
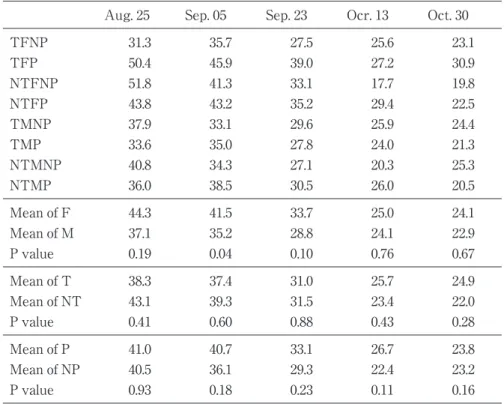
それぞれ降雨の直後にフラックスが現れた。とくに 9月中旬のピークは顕著であり,それまでの乾燥気 味の土壌で集積した硝酸態窒素に加えて,高温・湿 潤条件が重なり,活発な脱窒が起こったためと推定 された。土壌中硝酸態窒素の含有率は8月25日の総 平 均40.7mgN kg-1か ら10月13日 の24.5mgN kg-1 まで低下しており,作物による吸収以外に脱窒もこ Fig. 2. Temperature (a) and precipitation (b) during
the experiment
Fig. 3. Changes of water potential in soil
T : Tillage, NT : No-tillage, M : Manure, F : Fertilizer, P : Pesticide, NP : No-pesticide
フィールドサイエンス 4号 4
の低下を助長していたことがうかがわれる(Table 2,3)。8月22日 に は64mm の 降 水 が あ っ た
(Fig. 2-b)が,このときには N2O のピークは認 められなかった。8月上中旬は雨が降らず非常に乾 燥していた(Fig. 3)。Goodroad & Keeney(1984)
や Hutchinson ら(1992)は硝化反応に起因する N2
O が土壌水分の影響を受けることを報告している。
乾燥のために硝化反応が進まずアンモニア態窒素が 残存していたならば,この降雨の後で硝化過程での N2O フラックスが認められたはずである。したがっ て,8月22日の降雨のときは施肥後約40日を経過し ており,施肥由来の窒素はほとんどすべて硝化され ていると考えられることから,ここでは脱窒を予測 していたが,この降雨でも土壌に還元的部位ができ るほどには湿潤にならなかったと推察される。
Fig. 4の N2O フラックスから,実験期間中にお ける N2O 発生量を算出し,8月中旬のピークを含 む7月16日~9月12日の期間とその後の期間に分け て示した(Table 4)。P 値から明らかなように,
いずれの処理区間においても N2O 発生量に有意な 差は認められなかったが,9月13日~10月27日の期 間をみると,耕起区と不耕起区との P 値が0.25と 比較的小さくなっており,耕起の有無が影響を及ぼ す可能性が考えられた。両区における土壌条件の違
Table 2. Concentration of ammonium nitrogen in soil(N mg kg‐1) Aug. 25 Sep. 05 Sep. 23 Ocr. 13 Oct. 30
TFNP 5.0 4.7 37.1 0.5 2.5
TFP 4.5 4.5 27.7 0.5 2.4
NTFNP 3.6 3.7 31.8 4.7 2.4
NTFP 6.3 6.5 76.1 2.6 2.0
TMNP 4.0 4.3 3.8 0.6 2.7
TMP 4.7 4.9 4.5 4.2 2.9
NTMNP 4.0 4.1 3.2 0.0 2.4
NTMP 7.6 7.7 3.8 2.8 1.8
Mean of F 4.9 4.9 37.1 2.1 2.3
Mean of M 5.1 5.3 10.0 1.9 2.5
P value 0.83 0.71 0.60 0.90 0.65
Mean of T 4.6 4.6 30.4 1.5 2.6
Mean of NT 5.4 5.5 16.6 2.5 2.2
P value 0.65 0.39 0.49 0.45 0.04
Mean of P 5.8 5.9 21.9 2.5 2.3
Mean of NP 4.2 4.2 25.1 1.5 2.5
P value 0.83 0.71 0.65 0.90 0.65
T : Tillage , NT : No-tillage , M : Manure , F : Fertilizer , P : Pesticide , NP : No- pesticide, P-value : Statistical probability calculated by variance analysis
Fig. 4. Effects of the amendments(a),tillage(b),and pesticide application(c)on N2O emission from the field
M : Manure, F : Fertilizer, T : Tillage, NT : No-tillage, P : Pesticide, NP : No-pesticide. Bars on the symbols denote standard error.
畑地からの N2O 放出(藤沼ら) 5
Table 3. Concentration of nitrate nitrogen in soil(N mg kg‐1) Aug. 25 Sep. 05 Sep. 23 Ocr. 13 Oct. 30
TFNP 31.3 35.7 27.5 25.6 23.1
TFP 50.4 45.9 39.0 27.2 30.9
NTFNP 51.8 41.3 33.1 17.7 19.8
NTFP 43.8 43.2 35.2 29.4 22.5
TMNP 37.9 33.1 29.6 25.9 24.4
TMP 33.6 35.0 27.8 24.0 21.3
NTMNP 40.8 34.3 27.1 20.3 25.3
NTMP 36.0 38.5 30.5 26.0 20.5
Mean of F 44.3 41.5 33.7 25.0 24.1
Mean of M 37.1 35.2 28.8 24.1 22.9
P value 0.19 0.04 0.10 0.76 0.67
Mean of T 38.3 37.4 31.0 25.7 24.9
Mean of NT 43.1 39.3 31.5 23.4 22.0
P value 0.41 0.60 0.88 0.43 0.28
Mean of P 41.0 40.7 33.1 26.7 23.8
Mean of NP 40.5 36.1 29.3 22.4 23.2
P value 0.93 0.18 0.23 0.11 0.16
T : Tillage , NT : No-tillage , M : Manure , F : Fertilizer , P : Pesticide , NP : No- pesticide, P-value : Statistical probability calculated by variance analysis
Table 4. Amount of nitrous oxide emitted
Treatment Period
Total Jul. 16-Sep. 12 Sep. 13-Oct. 27
g N ha‐1
TFNP 19.6 27.3 46.9
TFP 41.8 15.8 57.6
NTFNP 35.0 9.8 44.8
NTFP 12.9 27.8 40.7
TMNP 29.9 28.6 58.5
TMP 25.6 20.6 46.2
NTMNP 30.0 12.2 42.2
NTMP 24.8 17.3 42.1
Mean of F 27.3 20.2 47.5
Mean of M 27.6 19.6 47.2
P-value 0.97 0.93 0.96
Mean of T 29.2 23.1 52.3
Mean of NT 25.7 16.8 42.5
P-value 0.61 0.25 0.29
Mean of P 26.3 20.4 46.7
Mean of NP 28.6 19.5 48.1
P-value 0.74 0.88 0.79
T : Tillage, NT : No-tillage, M : Manure, F : Fertilizer, P : Pesticide, NP : No- pesticide, P-value:Statistical probability calculated by variance analysis
フィールドサイエンス 4号 6
いは深さ25cm までの耕うん層の有無であり,前作 の作物根や土壌動物によって形成された孔隙が残存 するかどうかという点で大いに異なるはずである。
Matsumura & Witjaksono(1999b)は 同 試 験 圃 場 に設置してあるライシメーターで2年間にわたり土 壌浸透水を調べ,耕起区よりも不耕起区で浸透水が 多く採取できることを示し,不耕起が土壌の透水性 を高めると推察している。このことから,9月16-
17日の2日間で133mm の降雨があった際には,透 水性の違いから,不耕起区よりも耕起区土壌の耕う ん層において雨水がより長時間停滞したと考えら れ,脱窒による N2O 発生量が多くなったと推察さ れる。
Bremner & Blackmer (1978) や Keeney ら
(1979)は農薬散布によって N2O フラックスが大 きくなる現象を認めているが,本実験では明らかで はなかった。これは,農薬の散布回数がわずか2回 であり,しかもそのうちの1回はダイズ茎葉への散 布であったために,土壌に対する影響が小さかった ためと考えられる。
以上のように,圃場の管理方法の違いは N2O 発 生量に大きな影響を及ぼさないことが明らかになっ た。しかし,本実験で測定された N2O 発生量は,
ダイズ作で窒素施用量が少なかったこともあり,国 内 外 の 多 く の 文 献(例 え ば,Arah et al. 1991,
Bronson et al. 1992,Granli & Bockman 1994 など)
で報告されている量に比較すると1/10程度であっ た。したがって,窒素施用量を2倍,3倍に増やし た場合にも,同様の結果が得られるかどうかを検証 する必要がある。
4.謝辞
本研究においては,1.5ha 圃場でのダイズ栽培 管理を技術専門官杉田國一氏に担当していただき,
また,N2O ガスの分析は本学農学部波丘地実験実習 施設(現 FS センターの FM 多摩丘陵)の楊 宗興 氏(現本学農学部助教授)の研究室で行わせていた だいた。ここに深謝の意を表します。
引用文献
Arah, J. R. M., K. H. Smith, I. J. Crichton & H. S. Li
(1991)Nitous oxide production and denitrifi- cation in Scottish arable soils. J. Soil Science, 42 : 351―367.
Bremner, J. M. & A. M. Blackmer(1978)Nitrous
oxide : Emission from soils during nitrification of fertilizer nitrogen. Science, 199 : 295―296.
Bronson, K. F., A. R. Moiser & S. R. Bishnoi(1992)
Nitrous oxide emissions in irrigated corn as af- fected by nitrification inhibitors. Soil Sci. Soc.
Am. J., 56 : 161―165.
Conrad, R., W,Seiler. & G. Bunse(1983)Factors in- fluencing the loss of nitrogen into the atmos- pheric as nitrous oxide. J. Geophys. Res. 88 : 6709―6718.
Goodroad, L. L. & D. R. Keeney(1984): Nitrous ox- ide emissions from soils during thawing. Can. J.
Soil Sci., 64 : 187―194.
Granli, T. & O. C. Bockman(1994): Nitrous oxide from agriculture. Nor. J. Agr. Sci., Sup., No. 12, 1
―128.
Houghton, J. T.(1994): Global Warming. The Com- plete Briefing. A Lion Book, p. 46―56.
Hutchinson, G. L. & E. A. Brams(1992)Nitric oxide versus nitrous oxide emissions from ammo- nium ion-amended Bermuda grass pasture. J.
Geophys. Res.,97: 9889―9896.
Intergovernmental Panel on Climate Change
(IPCC)(2001): Climate Change 2001(野 内 勇・陽 捷行訳・解説) : 畜産における温室効 果ガスの発生制御(平成14年度総集編),畜産 技術協会,p. 1―31.
Keeney, D. R. I. R. Fillery, and G. P. Marx(1979):
Effects of temperature on the gaseous nitrogen products of denitrification in a silt loam soil Soil Sci. Soc. Am. J., 43 : 1124―1128.
Matthias, A. D., A. M. Blackmer and J. M. Bremner
(1980): A simple chamber technique for field measurement of emissions of nitrous oxide from soils. J. Environ. Qual., 9 : 251―256.
松村昭治・橋本直樹・細矢伸之・塩谷哲夫(2000):作 物の乾物生産量および収量に及ぼす耕起および 堆肥連用の影響,東京農工大学農学部農場研究 報告17,1―9.
Matsumura, S and G. Witjaksono(1999 a): Modifi- cation of the Cataldo Method for the Determi- nation of Nitrate in Soil Extracts by Potassium Chloride. Soil Sci. Plant Nutr.,45 , 231―235.
Matsumura and G. Witjaksono(1999 b): Tillage Method and Soil Fertilization effects on Crop
畑地からの N2O 放出(藤沼ら) 7
yield and Nitrate Leaching. Acta Horticulturae, 506, 193―198.
八木一行(1991):土壌生態系のガス代謝と地球環
境2. 水田からのメタン発生.土肥誌62,556―
562.
フィールドサイエンス 4号 8
Article
Acidification of Precipitation in Tottori, Japan
*1Hiroshi HARA*2and Yoshiaki KIMURA*3
1.INTRODUCTION
Atmospheric deposition of both actual and poten- tial acidic substances has been one of the leading environmental issues for scientists and policy mak- ers as well as the general public. Extensive studies on precipitation chemistry were undertaken in Europe and North America where the deposition was considered one of the most critical pollution problems. This problem has recently been realized not to be limited to Europe and North America . Emissions of sulfur dioxide , nitrogen oxides , and ammonia that would eventually acidify the environ- mental ecosystems increase rapidly in Asia, south- ern Africa and parts of Central and South America
(Galloway 1995).Emissions from Asia for1990are projected to be double or triple in the next twenty years whereas sulfur dioxide emissions in North America and Europe are expected to decrease until 2020(Galloway 1995). Emphasis has been placed on the estimation of emissions in Asia(Bhatti et al.
1990,Park and Kim 1997, van Aardenne et al. 1999, Dentener and Crutzen 1994, Wang et al. 1977).
Impacts of increasing emissions in the Asian con- tinent on wet deposition could be detected by a long
-term measurement of precipitation chemistry in Ja- pan that is located at the east end of Asia. Particu- larly winter precipitation is anticipated to show more marked trends because the winter meteorol- ogy is characterized by northwesterly monsoon . Domestic emissions will also affect the precipitation chemistry. Most of the major sources are located on the Pacific Ocean coast of Japan( Fujita et al . 1991). In consideration of the meteorology and
source distributions of Japan, precipitation chemis- try measurements on the Japan Sea coast are capa- ble of demonstrating temporal trends of continental impacts on the precipitation chemistry in Japan.
In the light of current understanding of atmos- pheric chemistry, sulfur dioxide and nitrogen diox- ide are oxidized predominantly by OH radicals and the overall rate constant for sulfur dioxide oxidation is one order of magnitude smaller than that for ni- trogen dioxide oxidation(Schwartz 1989).It is gen- erally accepted that nitrogen dioxide is more rap- idly converted to nitric acid than sulfur dioxide to sulfuric acid based on field observations and model calculations and that the long-range transport of ni- tric acid is thus somewhat less pronounced than that of sulfuric acid(Rodhe et al. 1981).
In order to capture temporal trends of nss-sulfate, nitrate, ammonium, nss-calcium, and hydrogen ions, bulk-sampled weekly data in Tottori on the Japan Sea coast for1988-1996are discussed. Annual mean con- centrations of all ions including acidity were found to be increasing and the acidity increase was explained by more increases in acids than in bases. Similar trends were discernible for winter and summer seasonal means with more pronounced increasing rate for winter mean. These phenomena would be attributed to long-range transport of pollutants from Asian continent and locally formed nitric acid and/or nitrate in con- sideration of atmospheric chemistry and monsoon in this region.
Keywords:acidification, acid, base, pH, precipitation, Japan
*1 Received Mar.14,2003;Accepted Dec.20,2003
*2 Field Science Center, Tokyo University of Agriculture and Technology, Saiwaicho3―5―8,Fuchu, Tokyo,183―8509 Japan
*3 Tottori Prefectural Institute of Public Health, Matsunamimachi2, Tottori,680―0801Japan
J. Field Science 4:9―18,2003 9
In view of wet and dry deposition mechanism, highly soluble gases like nitric acid and ammonia are efficiently incorporated into water droplets and easily dry deposited on the earth's surface.(Seifeld and Pandis 1998).However, when nitric acid is as- sociated with atmospheric gaseous ammonia to form ammonium nitrate, this fine particulate matter are not easily scavenged by falling water droplets and could be transported over a long-range than the nitric acid in its original form. In consideration of the above atmospheric processes of sulfur and ni- trogen species, precipitation sulfate on the Japan Sea coast is fairly influenced by long-range trans- ported sulfur rather than domestic sulfur species. In contrast, nitrate in Tottori precipitation could be contributed by local and long-distant sources. Ni- trate salts would have been formed in the continent and transported to Japan, and nitric acid and nitrate salts, when reacted in Japan with alkaline species, would have resulted from nitrogen oxides emitted from Japanese sources.
Several monitoring networks of precipitation chemistry have been operated in Japan. Japan Envi- ronment Agency has developed a nation-wide net- work since1983(Hara et al. 1990, Hara 1993, Hara et al. 1995, Hara 1997).During the monitoring op- eration , some sites were relocated and the bulk samplers were replaced by wet - only samplers . These changes will limit us to utilize the datasets for long-term trend analysis. Besides the govern- mental network, prefectural institutes of environ- mental sciences have their networks, which would offer long-term measurements for such analyses . Among these measurements, precipitation chemis- try records for1988-1996are available for Tottori on the Japan Sea coast where the precipitation is least influenced by domestic emissions(Fig. 1).
The data was collected by using bulk sampling technique throughout the survey . An analysis of this dataset for1988to1996would shed light on the temporal trends of major ion concentrations on the Japan Sea coast.
2.MEASUREMENT OF PRECIPITATION CHEMISTRY
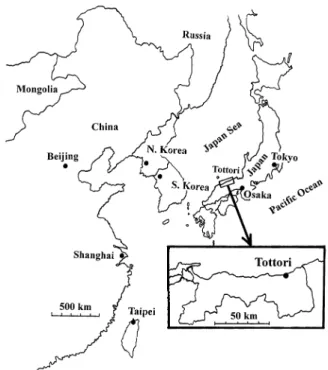
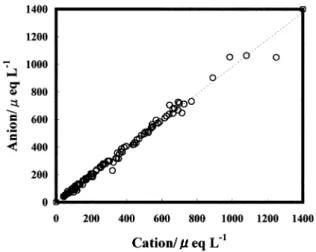
Tottori City, the prefectural capital, is located in the western coast of the Japan Sea side of Honshu, the Main Island of Japan , has a population of 120,000with few large sources of industrial emis- sions(Fig. 1). The samples were collected on a weekly basis at Tottori Prefectural Institute of Pub- lic Health, which is located in the suburban area of the city. The Japan Sea coast is located about 3 km to the north and the downtown of the city about 7 km to the south of the institute. The coastal area of the city is comprised of a dune,12km wide and 2 km long. The samples were collected on the rooftop of the institute throughout the survey period since 1988. The sampler consists of a collection funnel and a storage bottle with a membrane filter in between, which minimizes evaporation loss of the sample and biologically induced chemical conversion(Hara et al. 1990).Ionic species were determined by using an ion chromatograph and pH and conductivity were measured with pH and conductivity meters, respectively . The data quality was assessed in terms of ion balance check based on the six cations and the three anions : H+, NH4+, Ca2+, K+, Mg2+, Na+, NO3-, SO42-, and Cl-. The ion balance check
Fig. 1. Location of the sampling station.
J. Field Science 4 10
showed an excellent agreement between the cation and anion sums(Fig. 2), which sufficiently meet the ion balance criteria of Japan Environment Agency that the ratio of the cation sum to the anion sum should be in the range of0.80and1.2.
Because of the acidity is directly related to equivalent concentrations of acids and bases in aqueous solution, equivalent unit is utilized throughout this paper. The concentration is numeri- cally identical with molar concentration for the monovalent ions and doubled for the divalent ions such as sulfate and calcium ions. In the present arti- cle, the brackets denote equivalent concentration of the ions in brackets.
Precipitation incorporates seasalt particles con- taining seawater components including sulfate and calcium ions. Therefore, the seasalt should be dis- criminated from the non-seasalt ions. Non-seasalt
(nss-)fractions of sulfate and calcium ions were usually estimated with eqs.(1)and(2), respec- tively , on the basis of sodium ion as a tracer of seawater under the assumption that the relative composition of these seasalt ions are conserved throughout the atmospheric processes(Hara et al.
1990).
[nss-SO42-] = [SO42-] -([SO42-] / [Na+])seawaterx [Na+]
(1), [nss- Ca2+] =[Ca2+] -([Ca2+] / [Na+])seawaterx [Na+]
(2).
where ( [ SO42-] / [ Na + ] )seawater and( [ Ca2+] / [Na+])seawaterare the equivalent concentration ratios of seawater components and numerically 0.1206
and0.04322, respectively.
The weekly measurements are transformed into the volume-weighted monthly means and archived officially in the institute . The volume - weighted mean concentration is calculated by using eq.(3),
Cvwm= (CiRi)/ Ri (3)
where Ci and Ri are concentration and rainfall amount for the ithprecipitation sample of interest. In the case of hydrogen ion, the volume-weighted con- centration is given by eq.(4)because the concen- tration of hydrogen ion is derived from the pH,
[H+]vwm= (10-pHiRi)/ Ri (4).
And the monthly pH is calculated on the basis of the definition :
pH = -log [H+]vwm (5)
3.RESULTS
3.1 Temporal Variations of Annual Mean Con- centration
Monthly pH was recognized to be decreasing trend during the survey period with fluctuations
(Fig. 3).In order to capture distinct feature of the trend, the temporal variation is discussed in terms of volume-weighted annual means of hydrogen ion and related ions.
Figure 4 clearly shows an increasing trend of the hydrogen-ion concentration during the period.
In the first year of the survey, 1988, the volume- weighted annual mean hydrogen-ion concentration was18μeq L-1and was elevated to be almost30 μeq L-1in1996.
The increasing acidity is due to either an increase in acid concentration or a decrease in base concen- tration, or both. Major acids and bases in precipita- tion are generally supposed to be sulfuric and nitric acids, and ammonia and basic calcium salts in the atmosphere , respectively : [ H+] =( [ H2SO4] + [HNO3]))-([NH3] + [CaCO3])In the precipitation solution, these acids and bases dissociate into their ionic constituents. The equivalent concentrations of the acids and bases mentioned above are numeri- cally equal to the respective ionic concentration : [nss-SO42-], [NO3-], [NH4+],and [nss-Ca2+].The resul- tant acidity, [H+], is therefore expected to be ob- tained by the quantity,([nss-SO42-] + [NO3-])-
Fig . 2 . Ion balance of the precipitation chemistry data.
Acidification of Precipitation in Tottori, Japan(HARAet al.) 11
([NH4+] + [nss-Ca2+])which is here defined as the acid-base difference. The concentrations of these ions will explain actual acid - base relationships in precipitation.
The annual mean concentrations of nss-sulfate, ni- trate, ammonium, and nss-calcium ions were also depicted in Fig .4. Nss - sulfate concentration was higher than any of other four ions by a factor of two during the period . The concentration in the last three years was higher than55μeq L-1whereas the concentration in the first six years was fluctuating between40and50μeq L-1. Nss-sulfate ion concen- tration actually increased with time.
Among the variation of the five kinds of ions, ni- trate and ammonium ions are likely to show steady increases. Regarding to impacts of acid deposition
on ecosystems , ammonium ion is eventually an acidifying substance because this ion is biologically converted to nitric acid after deposition to soil(Van Breemen et al. 1982, Chadwick and Hutten 1991).
Figure 4 shows that ammonium ion was increasing together with hydrogen ion, which implies the eco- system in this area is being acidified over the sur- vey period. Nss-calcium ion was found to be fluctu- ating during the period although it was elevated in 1995.
The annual concentration of hydrogen ion and the acid - base difference were shown in Fig . 5.
These two quantities agreed with each other in terms of a correlation coefficient of 0.801, which further ensured that the temporal trends of the hy- drogen ion concentration and the concentration dif- ference considerably overlapped each other within observational uncertainty . This agreement indi- cates that the acids and the bases were increasing but with a higher increasing rate of acids, which re- sulted in increasing acidification of the precipitation.
Fig. 3. Monthly mean pH in Tottori for1988-1996. The bold curve and the straight line are a running mean and a linear regression, respectively.
Fig. 5. Annual means of hydrogen ion concentration
(◇)and the acid-base difference,
([nss-SO42-] + [NO3-])-([NH4+] + [nss-Ca2+])
(■).
Fig. 4 . Annual mean concentrations in Tottori for 1988-1996. top : nss-SO42-;■, NO3-;●,
H+;◇, bottom : NH4+;◆, nss-Ca2+;△.
J. Field Science 4 12
3.2 Temporal trends of summer and winter concentrations
The coastal areas of the Japan Sea are character- ized by a northwesterly monsoon in winter months
(Whelpdale and Moody 1990).During winter, the prevailing flow provides a transport path off the east coast of the Asian continent to Japan. In sum- mer months, however, the airflow changes coming from the Pacific Ocean. This seasonality strongly suggests air pollutants from the continent could dominate the precipitation chemistry in Tottori in winter. In summer months, however, emissions in industrial areas on the Pacific Ocean coast and local emissions in and around Tottori would dominate the precipitation chemical constituents.
Volume-weighted mean concentrations of major ions in summer(June, July, and August)and win- ter(December, January, and February)were cal- culated as illustrated in Fig. 6. Winter concentra- tions of nss-sulfate were higher than the summer ones and increased during the period whereas the summer concentration seemed to remain fairly con- stant. Nitrate showed increases both in winter and summer with a larger rate for winter. A very simi-
lar trend was discerned for the ammonium concen- tration with higher concentration in winter. Nss-cal- cium ion, however, was found to be largely fluctuat- ing without any appreciable trends. For winter con- centrations, the increasing rates for nitrate and am- monium concentrations were considerably higher than that of nss-sulfate ion whereas the concentra- tion levels of these nitrogen species were lower than that of nss-sulfate(Fig. 6).Winter concentra- tion of hydrogen ion increased from23μeq L-1in 1988 to 38μeq L-1in 1996 while the summer con- centration showed a less rapid increase 16μeq L-1 in1988to27μeq L-1in1996. The acid-base differ- ence defined in section3.1,([nss-SO42-] + [NO3-])-
([NH4+] + [nss-Ca2+])was also increasing for sum- mer and winter periods.
These results taken together imply that all the major acids and bases increased to a larger extent in winter than in summer and that the acid concen- trations were more growing than the bases, which resulted in further acidified precipitation in winter.
4.DISCUSSION
4.1 Emissions of sulfur and nitrogen in East Asia
Ionic concentrations generally depend upon emis- sion rates of precursor gases, air concentrations of oxidizing species, and precipitation amounts. These factors will be briefly discussed in connection with the observed trends of precipitation chemistry.
Trends of nss-sulfate and nitrate concentrations in Tottori precipitation would be caused by en- hanced emissions of sulfur and nitrogen oxides in East Asia. Emission intensities of sulfur and nitro- gen oxides have been reported for selected years as summarized in Table 1(Bhatti et al. 1990, Park and Kim 1997, van Aardenne et al. 1999).These estimates were carried out with different methods.
Park and Kim(1997)explored total fuel consump- tion of various economic sectors . The other esti- mates were projections based on some scenarios to future years.
According to these results , emissions of these gases will be concluded to have been increasing in northeast Asia. The total emission of sulfur dioxide Fig. 6. Summer and winter mean concentration in
Tottori for1988-1996.top : nss-SO42-(sum- mer;□, winter;■), NO3-(summer;○, winter;●), bottom : NH4+.(summer;◇, winter ; ◆ ), nss - Ca2+( summer ; △ , win- ter;▲)
Acidification of Precipitation in Tottori, Japan(HARAet al.) 13
increases from1,126,500ton in 1988 to 1,450,100 ton in1993 although the increase rate was slowed down after 1990, which was mainly attributed to the gradual replacement of anthracite with town gas in residential and commercial sectors(Park and Kim 1997).On the other hand, nitrogen oxides total emissions increased rapidly from 421,900 ton in 1988to763,700ton in1993, which corresponds to a linearly increasing rate of 16% per year. They in- terpreted that this rapid increase was accelerated by the rapid increase in motor vehicles after 1990
(Park and Kim 1997).
Sulfur species emitted from Far East Russia might contribute to give rise to precipitation sulfate in Tottori under some meteorological conditions. Al- though anthropogenic emissions of sulfur and nitro- gen oxides in Asia have been recently studied
( Kato and Akimoto 1992, Akimoto and Narita 1994), no convincing emission inventory data for
sulfur and nitrogen species are currently available.
Estimated emission intensities in some areas adjoin- ing Far East Russia, sulfur emissions from Russian areas do not seem intensive enough, in comparison with those in Korea and Northeastern China, to af- fect precipitation chemistry in Tottori. In considera- tion of these factors, significant contributions from Russian sources are not plausible for the present in- creasing trend.
These increasing emission trends of sulfur and ni- trogen oxides in East Asia could have contributed to the observed increasing concentrations of nss - sulfate and nitrate in Tottori precipitation.
Ammonium in precipitation is usually derived from atmospheric ammonia reacting with sulfuric
and nitric acids to form corresponding ammonium salts . Ammonia is injected into the atmosphere from anthropogenic and natural sources(Dentener and Crutzen 1994).
4.2 Air quality in Tottori
Air quality in Tottori for the corresponding pe- riod was compiled in terms of the annual mean air concentrations of sulfur dioxide, nitrogen oxide, ni- trogen dioxide, and oxidants. These gases were all monitored at the identical station and the annual mean concentration was the arithmetic mean con- centrations. Figure 7 shows an increasing trend of oxidants from21ppb in1988to36ppb in1996dur- ing the period. The pollutants other than oxidants remained rather constant. Also annual mean con- centrations of carbon monoxide were almost con- stant to be400to500ppb whereas non-methane hy- drocarbons decreased with some fluctuations from 240ppb in1988to150ppb in1996.
In terms of seasonal means, some pollutants dem- onstrated more increasing trends. Oxidants were recognized to be increasing in both summer and Table1.Estimated emissions of SO2and NOXin East Asia in Tgy-1
SO2 NOX SO2 NOX NOX
1986 2000 1986 2000 1988 1993 1990 2000 1990 2000
Country
China 18.972 34.036 7.673 15.316 * * * * 8.273 13.719
Japan * * * * * * * * 2.468 3.168
North Korea 0.587 0.92 * * * * 0.518 0.914
South Korea 1.224 2.721 0.663 1.302 1.127 1.45 0.422 0.764 0.977 1.995 Authors Bhatti et al., 1990 Park and Kim, 1997 van Aardenne et al., 1999
*not estimated.
Fig. 7. Annual mean air concentrations of air pollut- ants in Tottori for1988-1996.
oxidant;●, NO2;■, NO;◆, SO2(X)together with the summer and winter means of oxidant(sum- mer;△, winter;▲).
J. Field Science 4 14
winter months as depicted also in Fig.7. Figure 8 shows that winter mean nitrogen dioxide , nearly twice as high as the summer means, grew steadily from8.6ppb in1988to13ppb in1996. However, its annual and summer means remained nearly con- stant. Sulfur dioxide illustrated no temporal trends for these means.
The formation rate of nitric acid is proportional to the OH radical and the nitrogen dioxide concentra- tion. The OH concentration, which is not monitored in Tottori, will be supposed to be fairly proportional to the oxidant concentration. The increasing trend of oxidant and stable nitrogen dioxide strongly sug- gests that increased production of nitric acid around Tottori although no measurements were made for nitric acid during the winter months in this period.
4.3 Precipitation amounts in Tottori
Annual precipitation amounts in Tottori was fluc- tuating with maxima in 1990 and 1995( Fig . 9 ).
Some increase, however, might be captured during 1992-1995, which would result in decreasing con- centrations . Despite this increase in precipitation amounts, concentrations of the major ions showed an upward trend . Therefore , the precipitation amount will not have been involved in the temporal
trends in concentration that emerged.
4.4 Atmospheric Chemistry of the temporal trend
Precipitation chemistry in Japan is controlled by both long-range transported and locally emitted air pollutants (Ishikawa et al. 1998). In terms of the potential impacts of emission sources in the Asian continent on wet deposition in Japan, the seasonal meteorology suggested that winter precipitation would be demonstrated to be impacted by long - range transported acidic substances from the conti- nent.
Considerations of the atmospheric chemistry and the meteorology of Japan would lead us to interpret that the winter nss-sulfate was mostly dominated by increasing emissions of sulfur dioxide in the con- tinent and that the summer month nss-sulfate was associated with domestic sulfur dioxide emissions.
For the nitrate variation, a similar discussion will apply to wintertime nitrate concentrations. In addi- tion, local formation of nitrate will be plausible to contribute to the precipitation chemistry because increasing photochemical oxidant in Tottori strongly suggests that active oxidizing species will enhance local production of nitrate. Growing con- centrations of nitrate in summer would be attrib- uted to locally formed nitrate species due to rising levels of oxidant as observed at the station.
In the light of the current understanding of at- mospheric processes , precursor emission trends , and observed trends of chemical species in Tottori, sulfuric and nitric acid concentrations impacting Tottori precipitation are supposed to have in- creased during the period. Sulfuric and nitric acids of increasing concentrations are likely to more read- ily incorporate ammonia, a typical basic gas in the atmosphere to result in increasing concentration of precipitation ammonium.
5.CONCLUSION
During the period of 1988-1996,volume - weighted annual mean acidity was found to be in- creasing in Tottori on the Japan Sea coast. This in- creasing trend was enhanced for winter months in comparison with summer month acidity. The acid- Fig. 8. Annual, summer, and winter mean concentra-
tion of NO2in Tottori for1988-1996. annual;
●, summer;△, winter;▲.
Fig. 9. Annual, summer, and winter mean precipita- tion amounts in Tottori for 1988-1996. an- nual;●, summer;◇, winter;■.
Acidification of Precipitation in Tottori, Japan(HARAet al.) 15
ity was explained due to increasing sulfuric and ni- tric acids. Acid-neutralizing basic ammonia also in- creased during the period but lower rate than that of acids.
In terms of seasonal meteorology of the region covering Japan Sea side of Japan, wintertime north- westerly monsoon in East Asia will be favorable for the contribution of continental emissions of acid precursors to the increasing concentrations in Tot- tori. Increasing trends of wintertime oxidants and nitrogen dioxide in the city suggested local forma- tion of nitric acid to elevate precipitation nitrate concentrations.
REFERENCES
Van Aardenne, J. A. Carmichael, G. R. Levy II, H.
Streets, D. G. and Hordijk, L.(1999)Anthropo- genic NOxemissions in Asia in the period1990
-2000.Atmospheric Environment33:633―646.
Akimoto, H., and Narita, H.(1994)Distribution of SO2and NOx, and CO2Emission from Fuel Com- bustion and Industrial Activities in Asia with 1°× 1°Resolution . Atmospheric Environment 28:213―225.
Bhatti, N., Streets, D. G. and Foell, W. K.(1991)Acid Rain in Asia. Environemental Management16;
541―562.
Chadwick, M. J., and Hutten, M.(1991)“Acid Depo- sitions in Europe : Environmental Effects : con- trol strategies and policy options”. pp. 52―56, Stockholm Environment Institute.
Dentener, F. J., and Crutzen P. J.(1994)A Three- Demensional Model of the Global Ammonia Cy- cle. Journal of Atmospheric Chemistry19;331―
369.
Fujita , S . Ichikawa , Y . Kawaratani , R . K . and Tonooka Y.(1991)Preliminary inventory of sulfur dioxide emissions in East Asia . Atmos- pheric Environment25A;1409―1411.
Galloway, J. N.(1995)Acid deposition : perspec- tives in time and space.Water, Air and Soil Pollu- tion85;15―24.
Hara, H., Ito, E. Katou, T. Kitamura, Y. Komeiji, T.
Oohara, M. Okita, T. Sekiguchi, K. Taguchi, K.
Tamaki, M Yamanaka, Y. and Yoshimura, K.
(1990)Analysis of Two-year Results of Acid Precipitation Survey within Japan . Bulletin of Chemical Society of Japan63;2691―2697.
Hara, H.(1993)Acid deposition chemistry in Japan.
Bull. Inst. Public Health42;426―437.
Hara, H., Kitamura, M. Mori, A. Noguchi, I. Oizumi, T. Seto, S. Takeuchi, K. and Deguchi, T.(1995)
Precipitation Chemistry in Japan1989-1993.
Water, Air and Soil Pollution85;2307―2312.
Hara, H.(1997)Precipitation chemistry in Japan.
Nippon Kagaku Kaishi733―748.
Ishikawa, Y. Yoshimura, K. Mori, A. and Hara, H.
(1998)High Sulfate and Nitrate Concentra- tions in Precipitation at Nagasaki Impacted by Long - Distant and Local Sources . Atmospheric Environment32;2939―2944.
Kato, N., and H. Akimoto(1992)Anthropogenic Emis- sions of SO2and NOxin Asia : Emission Inven- tries.Atmospheric Environment26A;2997―3006.
Park, S. U., and Kim, C. H.(1997)Interannual trend of the anthropogenic emissions of SO2and NOx
in South Korea. Proceedings of the International Workshop on Unification of Monitoring Protocol of Acid Deposition and Standardization of Emission Inventory.pp.98―123, March1997.
Rodhe, H., Crutzen, P. and Vanderpol, A.(1981)
Formation of sulfuric acid and nitric acid in the atmophere during long range transport. Tellus 33;132―139.
Schwartz, S. E.(1989)Acid deposition : unraveling a regional phenomenon.Science,243;753-763.
Seinfeld, J. H. and Pandis, S. N.(1998)Atmospheric Chemistry and Physics form Air Pollution to Climate Change . pp . 958―1074, Wiley - Inter- science, New York.
Van Breemen, N., Burrough, P. A. Velthorst, E. J.
van Dobben, H. F. de Wit, T. Ridder, T. B. and Reijnders, H. F.(1982)Soil acidification from atmospheric ammonia sulphate in forest can- opy throughfall.Nature299;548―550.
Wang, W. Xu, K. Pang, Y. and Lu, Y.(1997)In Pro- ceedings of the International Workshop on Uni- fication of Monitoring Protocol of Acid Deposi- tion and Standardization of Emission Inven- tory. pp.134―144,. March1997, Tsukuba, Japan.
J. Field Science 4 16
Whelpdale, D. M., and Moody, J. L.(1990)Large- scale meteorological regions and transport processes . In The Long - Range Atmospheric
Transport of Natural and Contaminant Sources, Knap, A. H.(ed.),Kluwer Academic Publishers, Boston, USA, pp.3―58.
Acidification of Precipitation in Tottori, Japan(HARAet al.) 17
和文要旨
鳥取における降水の酸性化
原 宏・木村 義明
酸性雨に関する主要なイオン成分、nss-SO42-、 NO3-、NH4+、nss-Ca2+及び H+の濃度の経年変化 傾向を把握するため、日本海側にある鳥取における 1988―1996年の週ごとに測定された降水のデータを 考察した。水素イオンを含めこれら全てのイオン成 分の濃度は増加しており、水素イオン濃度の増加は 酸の方が塩基よりも大きな速度で増加しているため
と説明できた。冬期と夏期の季節平均についても同 様な増加傾向が表れており、特に冬期の増加が顕著 であった。地域で季節的に卓越する気象を考慮する と、これらの現象はアジア大陸からの長距離輸送さ れる汚染物質と、地域的に生成する硝酸あるいは硝 酸塩に起因すると思われる。
J. Field Science 4 18
論 文
給食調理残渣飼料の給与が肥育豚の発育と肉質性状に及ぼす影響
*1宮澤 賢司*2・石田 幸一*2・平田 哲兵*2・田中 佑一*2・相 俊彦*2・富永麻衣子*2 横山 倫子*3・牧野茂三郎*3・石井 憲*3・上野 啓介*3・神田 修平*2・板橋 久雄*2
Effects of Feeding Food Waste Products
on the Growth and Meat Quality of Growing-Finishing Pigs
*1Kenji MIYAZAWA*2, Koichi ISHIDA*2, Teppei HIRATA*2, Yuiti TANAKA*2, Toshihiko AI*2, Maiko TOMINAGA*2, Michiko YOKOYAMA*3, Mosaburo MAKINO*3, Ken ISHII*3, Keisuke UENO*3
Shuhei KANDAand Hisao ITABASHI*2
The dried powder materials were made from food waste of cooking center, and were analyzed for chemi- cal composition and fed to growing pigs as substitute for feed. Food waste was dried by adding rice bran for 4 hr at about80℃.Treated materials contained87% dry matter,21% crude protein, and27% neutral de- tergent fiber. In growth experiment, six‘Tokyo-X’pigs were used, three of them were fed control formula feed, and the others were fed80% formula feed+20% treated food waste materials. They were fed equal amounts of feed, and growth experiment was lasted until110kg of body weight. The daily gains during the experiment were0.76kg in both groups. There were no significant differences in dressing percentage, backfat thickness, and other meat characteristics between both groups. These results suggest that treated food waste materials may be utilized in swine diets when they were substituted in about20% of formula feed.
Keywords: food waste products, pig, meat quality
給食調理野菜残渣を乾燥粉末化し,その主要成分を分析するとともに,肥育豚の飼料に添加し,豚の発育 と肉質性状に及ぼす影響を検討した。給食調理残渣に米ヌカを加え,約80℃で4時間攪拌乾燥処理した。処 理物の乾物割合は約87%,粗タンパク質は約21%,総繊維(中性デタージェント繊維)は約27%であった。
肥育試験には「トウキョウ X」豚6頭を供試し,対照区の3頭には通常の肥育用配合飼料を給与し,試験区 の他の3頭にはその配合飼料80%+給食残渣処理物20%を給与した。飼料給与量は両区とも同量とし,体重 が110kg になるまで飼養試験を行った。試験期間における1日当たり増体量は,両区とも0.76kg であっ た。枝肉歩留り,ロース芯断面積,背脂肪厚,その他の肉質性状も両区間に差は認められなかった。官能検 査の結果も両区間でほぼ等しかった。以上より,給食残渣処理物は乾物割合で20%程度の代替であれば,肥 育豚の飼料として利用できることが明らかになった。
キーワード:給食残渣飼料,肥育豚,肉質
*1 Received Nov.25,2003;Accepted Jan.13,2004
*2 東京農工大学農学部附属フィールドサイエンス・センター 〒183―8509東京都府中市幸町3―5―8:Field Science Center, Tokyo University of Agriculture and Technology, Fuchu, Tokyo183―8509, Japan
*3 伊藤忠飼料研究所 〒325―0101栃木県黒磯市青木:Research Laboratory, C-Itoh Feed Mills Co. Ltd., Kuroiso, To- chigi,325―0101,Japan
フィールドサイエンス(J. Field Science)4:19―24,2003 19