PAPER
Special Section on Data Engineering and Information ManagementTime Graph Pattern Mining for Network Analysis and Information Retrieval
Yasuhito ASANO†a),Member, Taihei OSHINO†∗,Nonmember,andMasatoshi YOSHIKAWA†,Member
SUMMARY Graph pattern mining has played important roles in net- work analysis and information retrieval. However, temporal characteristics of networks have not been estimated sufficiently. We propose time graph pattern mining as a new concept of graph mining reflecting the temporal in- formation of a network. We conduct two case studies of time graph pattern mining: extensively discussed topics on blog sites and a book recommen- dation network. Through examination of case studies, we ascertain that time graph pattern mining has numerous possibilities as a novel means for information retrieval and network analysis reflecting both structural and temporal characteristics.
key words: graph mining, time-series data, network analysis, information retrieval
1. Introduction
A graph pattern on a given set of graphs represents a sub- graph that appears frequently on graphs in the set. There- fore, the graph pattern can be regarded as a structural char- acteristic of the set of graphs. Mining graph patterns has become one method of network analysis and information retrieval, especially on a web graph of which the nodes are web pages and where edges are links among them. The fun- damental idea of trawling proposed by Kumar et al. [1] is that complete bipartite subgraphs are graph patterns appear- ing frequently on the link structures of web communities.
Several studies have suggested that a clique, a subgraph of which every two nodes are connected by an edge, is also a graph pattern representing a community. Leskovec et al. [2]
found that a specified type of graph patterns, designated as cascades, is observed for the growth of web graphs.
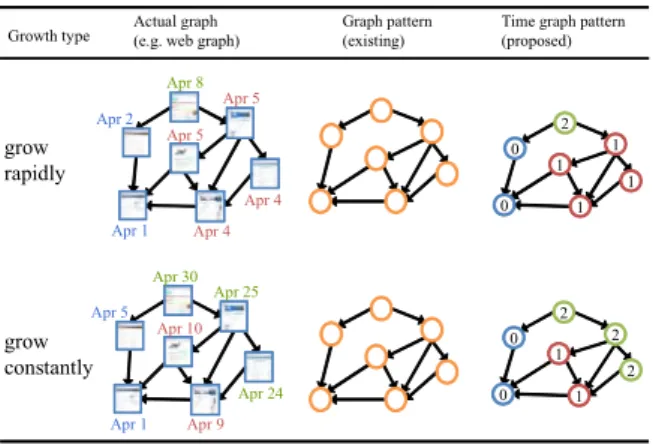
Previously proposed graph pattern mining applications reflect only the structural information of a network. How- ever, several actual networks, such as web and social net- works, are changing dynamically. Therefore, temporal in- formation of a network is also expected to be important for analysis of the network and information retrieval using the network. In other words, graph pattern mining based solely on the structure cannot distinguish two actual graphs of the same structure, but with different growth rates, as shown in Fig. 1. For example, the speed of information propagation might be important, although existing graph pattern-based
Manuscript received July 10, 2013.
Manuscript revised October 29, 2013.
†The authors are with the Graduate School of Informatics, Kyoto University, Kyoto-shi, 606–8501 Japan.
∗Presently, with Accenture Japan Ltd., Tokyo, 107–8672 Japan.
a) E-mail: [email protected] DOI: 10.1587/transinf.E97.D.733
Fig. 1 Graph patterns representing graph growth of two types.
analysis cannot estimate how rapid that propagation is.
To use both structural and temporal characteristics fully, we propose time graph pattern mining as a novel framework of graph mining. Atime graph patternis a graph pattern on a set oftime label graphsin which each node has a label that abstracts temporal information of the node. Con- sequently, we can analyze both structural and temporal in- formation using time graph patterns. Once a set of time label graphs is available, our framework enables a previously pro- posed graph pattern mining algorithm, such as gSpan [3], [4]
or GraphSig [5], to mine time graph patterns on the set with- out modification of the algorithm. Therefore, existing graph mining applications can be extended easily to time graph mining.
To construct a time label graph from a given graph, our framework requires the following two phases: (1) acquiring time-series data for the nodes of the given graph, and (2) labeling the nodes by simplifying the time-series data.
Phase (1) binds time-series data to nodes of the given graph. For example, we use the creation time of each node as a part of the time-series data for the nodes. We also present two approaches in Sect. 4.2 for obtaining additional time-series data. One uses the increase of the number of nodes of the graph. The other uses the counts of searches as data obtained from outside the graph. These approaches are developed for our two case studies conducted in Sects. 5 and 6, but they are applicable to various cases. We only treat time-series data for nodes throughout this paper. Using data for edges is anticipated as an interesting topic for future study.
We propose three labeling methods for the phase (2), Copyright c2014 The Institute of Electronics, Information and Communication Engineers
including naive ones and a method using “inflection points”
in the time-series data. The labeling method is important for time graph pattern mining. For example, one might consider the simplest labeling, which uses the node creation time it- self as the node label. The labeling generates too many la- bels because each page usually has a different creation time.
If the kinds of labels are too numerous, then a graph mining algorithm cannot enumerate graph patterns in practical time.
However, if the kinds of labels of nodes are too few, labels cannot convey sufficient temporal information of the origi- nal graph. Our method using inflection points is specialized for the cases studied in Sects. 5 and 6, although ideas for the method are expected to be useful for establishing a labeling method for another case.
To examine how useful time graph pattern mining is for network analysis and information retrieval, we imple- ment our framework for two practical cases by exploiting the approaches for obtaining time-series data and the la- beling methods explained above. The first case deals with topics discussed extensively on only blog sites because they fairly represent the temporal characteristics of the web. The second case deals with a network representing recommen- dations of books in an on-line book store because the trend of books about a topic changes as time passes. Results of the case studies give evidence that time graph pattern min- ing has plenty of possibilities to serve as a novel means for information retrieval and network analysis reflecting both structural and temporal characteristics.
The remainder of this paper is organized as follows.
Section 2 surveys related works reported in the literature.
Section 3 explains the concept of time graph patterns, and describes our mining process. Sections 5 and 6 present two case studies of time graph pattern mining for network anal- ysis and information retrieval. Section 7 presents important conclusions. This work builds on and significantly extends our preliminary work [6], [7].
2. Related Work
2.1 Graph Pattern Mining
The definition of a graph pattern is the following.
Definition 1: LetS be a given set of graphs having a com- mon label setL. Every node and edge of the graphs is as- signed to at most one label inL. A graph pattern of which the frequency is at leastminS upis defined as graphGpwith the same label set L such that there are at least minS up graphs inS having a subgraph that is isomorphic toGp. Therefore, enumerating graph patterns includes the sub- graph isomorphism problem, which is known as an NP- complete problem.
Several algorithms have been proposed for mining graph patterns. Yan and Han [3], [4], [8] proposed the gSpan algorithm, which enumerates graph patterns. The algorithm represents a subgraph by a code using a depth-first search order to enumerate patterns efficiently. A single subgraph
might have several codes. Therefore, they define the mini- mum code for a subgraph as a canonical representation. The time complexity of gSpan isO(kFS +rF), wherekstands for the number of occurrences of a frequent subgraph in a graph in the set, Fis the number of frequent subgraphs,S represents the set size, andris the maximum number of du- plicated codes of a frequent subgraph that grow from other minimum codes [8]. Sayan et al. [5] proposed the Graph- Sig algorithm. They introduced a p-valueto measure how featureless a graph pattern is. GraphSig enumerates every graph pattern of which the frequency is at least minS up and thep-valueis, at most, the user’s specified value. Han et al. [9] implemented a framework for comparing the ef- ficiency of algorithms for the subgraph isomorphism prob- lem. They conducted several experiments using the frame- work and several algorithms including gSpan.
Many proposals have used graph patterns for informa- tion retrieval and network analysis. We first explain infor- mation retrieval using graph pattern mining [1], [10]–[14].
Trawling proposed by Kumar et al. [1] for retrieving web communities used the fact that complete bipartite subgraphs are graph patterns appearing frequently in the link structures of web communities. Several studies [12] have produced the assertion that a clique, a subgraph of which every two nodes are connected by an edge, is also a graph pattern represent- ing a community. Makino and Uno [10] proposed a method for enumerating maximal cliques efficiently. Uno [11] pro- posed a method for enumerating pseudo-cliques, which is a subgraph obtained by removing a few edges from a clique.
We turn to a discussion of network analysis using graph pattern mining [2], [15]. Leskovec et al. [2] reported that a specified type of graph pattern, namedcascades, can be ob- served on the growth of web graphs. McGlohon et al. [15]
classified blog sites using cascades. They convert each site into a feature vector representing how many subgraphs in the site match to each of cascades of different types. They conducted principal component analysis (PCA) on the ma- trix of which the rows are the feature vectors of sites. They ascertained that blog sites are classifiable into conservative ones and humorous ones using the first and the second prin- cipal components (PCs). Cascade graph patterns use the or- der of the creation times of nodes, but do not reflect the inter- val of the creation times. Therefore, cascades were unable to estimate temporal characteristics of the web sufficiently.
2.2 Network Analysis Using Time-Series Data
In recent years, several studies have examined temporal properties of a network. Nakajima et al. [16] identify influ- ential bloggers by analyzing the time stamps of blog entries.
Theforest fire model proposed by Leskovec et al. [17] can simulate properties of the web: its degree distribution fol- lows a power law [18] and its diameter shrinks over time.
Kumar et al. [19] introduced aweb time graphto track the burst of growth of communities. The studies explained above analyze the temporal variation of the number of pages statistically, whereas our study analyzes the time variation
of graph structures.
Dynamic graph mining has been studied for dealing with temporal changes of graphs [20]. The number of edges might change in a dynamic graph, although the number of nodes does not change. A dynamic graph is suitable for an- alyzing a graph such that each edge is created and deleted repeatedly. However, on actual huge networks including the web, the number of nodes increases exponentially, whereas a number of edges usually remain unchanged long periods after they are created or deleted once. Consequently, few studies have analyzed the web using dynamic graphs.
3. Time Graph Pattern Mining Framework
We propose our framework of time graph pattern mining as follows.
I Collect a set of graphs.
II Construct time label graphs from the graphs using the following procedures.
(1) Acquire time-series data for the nodes of each graph.
(2) Assign labels to the nodes of each graph by sim- plifying the time-series data.
III Mine time graph patterns on the set of time label graphs using a frequent graph pattern mining algorithm such as gSpan or GraphSig.
Our framework begins from Step (I) for collecting a set of graphs. Implementing the collection of graphs depends on a case for network analysis or information retrieval. In the next section, we will introduce the two practical cases examined herein, and explain how we implement our frame- work for the two cases. The collection for the cases is ex- plained in Sect. 4.1.
Definition 2: A time label graph is defined as a graph of which every nodevhas an integer label(v) such that the labels(u) and(v) of nodes uandvsatisfy (u) < (v) if and only ifuwas created beforev.
The construction of time label graphs, Step (II), consists of the two phases (1) and (2) as explained in Sect. 1. Details of our proposal for the phases (1) and (2) are explained respec- tively in Sect. 4.2 and Sect. 4.3.
Definition 3: A time graph pattern is defined as a graph pattern on a set of time label graphs.
Therefore, we can use a previously proposed graph pattern mining algorithm for our Step (III) with no modification.
This is a benefit of our framework in terms of implementa- tion. It is possible to implement our framework by modify- ing only phases (1) and (2) for the target case.
4. Implementation of the Proposed Framework
4.1 Our Two Cases and Collection of Graphs
We herein introduce our two cases and explain how we col- lect graph structures for each case.
Extensively Discussed Topics on Blog Sites.The first case is analysis of web graphs corresponding to topics discussed extensively in a short period on blog sites only. We imple- ment Step (1) for the first case as follows. We first prepare some extensively discussed topics. We then obtain the top- k(we setk =300), web pages by inputting each topic to a search engine†. Consequently, we can construct a web graph with nodes representing the obtained pages. Edges are links among them.
Book-Recommendation Network. The second case is information retrieval of technical trends on a book- recommendation network of Amazon, the largest online book store in the world. Nodes on a book-recommendation network represent books for sale. A directed edge represents recommendations between a book and another book. That is, if many customers who bought bookb1 also buy book b2, then a directed edge exists (b1,b2) from bookb1to book b2. Edge (b2,b1) might not exist even if edge (b1,b2) exists.
Such a recommendation network is widely used in online shops and e-commerce services including Amazon. We im- plement Step (1) of our framework for the second case as follows. We first choose sample terms representing partic- ular technologies. We then collect the top 100 books re- lated to each term, the recommendations among the books, and the publication dates of books, using the Product Adver- tising API†† of Amazon. Consequently, we obtain a book- recommendation network for each term.
4.2 Acquisition Phase
Creation Time Data. We first consider using the time or date naturally corresponding to each node, if it is available.
For example, the creation time of each node is regarded as a candidate of fundamental time-series data. For the first case dealing with web graphs, we use the indexed time of a web page by a web search engine as an approximate creation time of the page. For the second case dealing with book- recommendation networks, we regard the publication date of a book as the creation time of the node corresponding to the book. We define “the whole period” for both cases, which will be used below.
Definition 4: The whole period on a graph is the period from the date on which the first node was created to the date on which the last node was created.
Node Count Data. The additional time-series data for the first case are node count data, which represent the increase of the number of nodes during the whole period. In other words, these data clarify how many nodes are present at a specified date. These data can be computed from the cre- ation time data explained above. Consequently, these data would be available not only for web graphs but also for var- ious networks.
†We use Google http://www.google.co.jp as a search engine throughout the paper.
††affiliate.amazon.co.jp/gp/advertising/api/detail/main.html
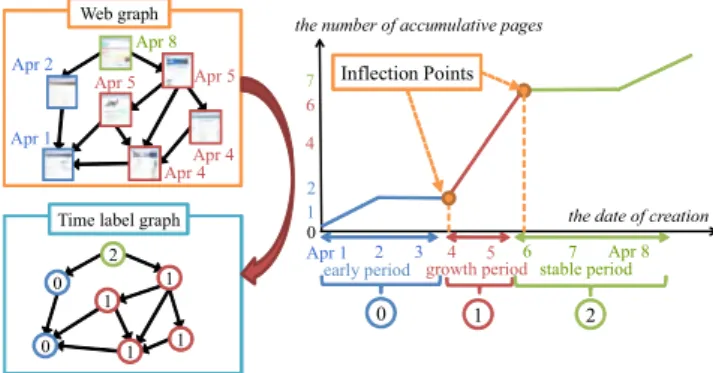
Fig. 2 Labeling web graphs on extensively discussed topics.
Search Count Data.The additional time-series data for the second case are the counts of searches of the keyword repre- senting a topic. We use Google Trends†as a resource for the search count. Google Trends tells us the degree to which the number of times of searching the keyword has changed over time. In other words, we can obtain data representing how many times the keyword has been sought up to a specified date.
Google Trends has sufficient data only for well-known topics that can be represented as a keyword and which have continued for long periods. Therefore, these data are avail- able for a book-recommendation networks that are related to a single technical trend. However, Google Trends returns in- sufficient data for most topics that are discussed extensively on blog sites during a short period. Therefore, search count data are not available for the first case.
4.3 The Labeling Phase
The labeling phase first divides the whole period on each graph into several sub-periods. Then it assigns a distinct la- bel to the nodes created at each sub-period. We herein intro- duce two naive labeling methods and propose an inflection point method.
4.3.1 Naive Methods
We introduce the following two naive labeling methods:
naive (A) and (B).
Naive (A) Dividing the whole period equally into n sub- periods, the nodes created during thei-th sub-period are labeled asi, wherei∈ {0,1,· · ·,n−1}.
Naive (B) Dividing the whole period intonsub-periods so that the number of nodes created during each period is equal, then the nodes created during thei-th sub-period are labeled asi, wherei∈ {0,1,· · ·,n−1}.
Ifn = 4 for the example portrayed in Fig. 2 in which the whole period is April 1–8, then naive (A) regards the period of Apr. 1–2 as the first period; the second period is Apr. 3–4.
†www.google.com/trends
These naive methods are applicable only if the creation time data explained above are available.
Both naive (A) and (b) have a readily apparent deficit:
the meaning of the i-th sub-period might differ among graphs in the given set. For example, the first period de- picted in Fig. 2 corresponds to a period during which the topic spreads gradually, although the same period might cor- respond to an explosive spread for another topic. In other words, this method might be incapable of reflecting tempo- ral characteristics in labels sufficiently.
4.3.2 Inflection Point Method
To dissolve the deficit of the naive labelings, we intend to as- sign the same label to periods of plural graphs if the periods have similar temporal characteristics such as how the topics spread. Therefore, we propose a labeling method, named
“inflection point method”, which uses inflection points in time-series data as labeling boundaries.
The inflection point method is applicable both to the first and second cases. The method uses creation time data and data representing an increase of accumulated counts in the whole period on the graph, such as the node count data for the first case and search count data for the second case.
Therefore, the method is applicable to another case in which similar data are available.
The inflection point method first detects the time points at which the number of accumulated counts for each graph changes drastically. It treats these points as inflection points for the graph. Then, the whole period on the graph is divided into sub-periods of which the boundaries are these inflection points. Subsequently, the method assigns labelito a node for a graph if the node is created duringi-th sub-period for the graph. Figure 2 presents a graph labeled using the inflec- tion point method. Two inflection points exist. Therefore, the whole period is divided into three periods. We explain details of inflection point calculation below.
We first divide the whole period on a graph intonvir- tual “time points.” We setnto 10 throughout the studies. We assume here that the minimum unit of a period is a day. Let the first date of thei-th time point betifori=0,1,· · ·,n−1, and let the next date of the last date of the whole period be tn. Consequently, the i-th time point consists of dates in [ti,ti+1) fori = 0,1,· · ·,n−1. Letvibe the number of counts in thei-th time point. This value corresponds to the velocity of the increase of accumulated counts. The accel- eration of the increase at the i-th time point is defined as ai=vi−vi−1(i=1,2,· · ·,n−1), wherea0is not defined.
We then determine inflection points usingai. The in- crease of accumulated counts changes considerably if the absolute value of the acceleration is greater than a certain threshold. In the first case, we can use the number N of nodes in the graph to ascertain the threshold. We regard ev- eryi-th time point that meets|ai|> Nn as an inflection point.
In the second case, the search counts are independent of the graph size. Therefore, we use the meanμand standard de- viationσof allaito determine the threshold.
μ= 1 n−1
n−1
i=1
ai, σ2= 1 n−1
n−1
i=1
(ai−μ)2 (1)
Then, thei-th time point that meets |aiσ−μ| > θis regarded as an inflection point. In other words, we regard thei-th time point as an inflection point when the ratio of its deviation to the standard deviation is greater thanθ. The distribution ofai approaches the standard distribution. A value in the standard distribution is regarded as uncommon if the differ- ence between the value and the mean is greater than twice the standard deviation. Therefore, we setθto 2.
After the inflection points are obtained, we assign a la- bel to each sub-period of which the boundaries are the first dates of the points, according to Definition 2. Let the first dates of the obtainedminflection points betp1,· · ·,tpm, for pm < n. Label 0 is assigned to nodes created during sub- period [t0,tp1), and labeliis assigned to nodes created dur- ing sub-period [tpi,tpi+1) for 1 ≤ i ≤ m−1; labelmis as- signed to the nodes created during sub-period [tpm,tn). In the example depicted in Fig. 2, two inflection points are ob- tained: Apr. 4 and Apr. 6. Consequently, the nodes created during Apr. 1–3 are labeled as 0. Similarly, the nodes cre- ated during Apr. 4–5 and Apr. 6–8 are labeled, respectively, as 1 and 2.
5. Case Study (1)
Using our time graph pattern mining framework, we analyze the spread of topics that are extensively discussed in a short period on blog sites. After preliminary investigation, we ob- served as explained in Sect. 5.1 that three types, named the primary source, trigger and summarizer, of blog sites play important roles in the spread. Therefore, we first mine time graph patterns on the set of time label graphs representing the propagation of such topics in Sect. 5.2; then we try to classify blog sites into the three types in Sect. 5.3 using the mined patterns.
5.1 Graph Set and Observation We prepared the following seven topics.
• Discussion of the average cost for producing a web site.
• Discussion of the relation between a person’s academic background and intelligence.
• Discussion about hakenmura–makeshift shacks for temporary workers whose contracts have been terminated–in a Japanese park.
• Discussion related to a problem by which some peo- ple post illustrations tracing other illustrations in pixiv, which is a Japanese SNS specializing in posting illus- trations.
• Discussion aboutyominigewhich means that a person reads another person’s diary in Mixi without comment- ing on the diary; Mixi is a popular SNS in Japan.
• Rumors about the release date of a software game “Fi- nal Fantasy 13.”
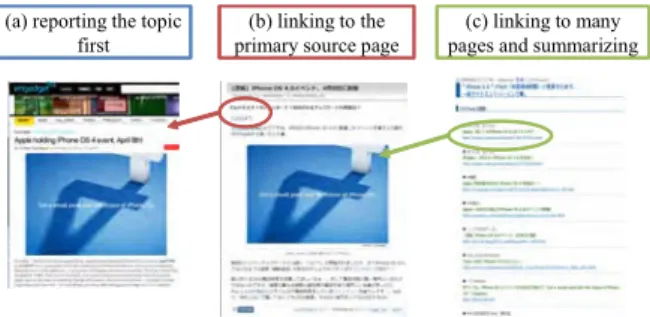
Fig. 3 Some web pages about the rumor.
• Discussion related to the coding style of HTML on a blog community.
Finding these topics from the web was a difficult task be- cause these topics were not discussed on major news sites.
However, constructing a method of searching for such topics is anticipated as interesting future work.
The topics were collected during November 2008 – April 2010, and were selected from the fields of computer software, web and social networks, electronics, science, pol- itics, and Japanese culture.
We investigated the selected topics and a number of similar topics, and observed that an interesting feature: “pri- mary source,” “trigger,” and “summarizer” play the most important roles for discussion and propagation of the top- ics. We explain the feature using an example topic corre- sponding to a rumor about the announcement date of iPhone 4. Figure 3 presents some web pages reporting the rumor.
First, page (a) reporting the topic appeared on a news site.
Then, some sites began to create pages linking to page (a).
Therefore, we call page (a) a primary source page for the topic. Subsequently, someone created page (b), which links to the primary source and which introduces the news of iPhone 4 with Japanese translations. Page (b) was linked by many Japanese blog sites and news sites. In other words, page (b) became a trigger of extensive discussion. Naka- jima et al. [16] regard an important blogger who posts many such trigger pages as an agitator. After the topic was fairly discussed, someone created page (c), which links to many pages related to the topic, including the primary source page and the trigger page, to summarize the topic. We designate page (c) as a summarizer page.
It is desired that the labeling of nodes reflect temporal characteristics of extensively discussed topics. The prop- agation process of such topics often describes a trajectory similar to the chart depicted in Fig. 2. The three roles ex- plained above are characteristic of the process. Typically, such a topic spreads gradually for a while after the primary source is created. That is, few pages related to the topic are created during this period. An example of this period is the early period depicted in Fig. 2. The trigger page usually causes an explosive spread: numerous pages related to the topic are created in a few days. The growth period depicted in Fig. 2 corresponds to the days. After the days, new pages referring to the topic do not increase to any great degree:
the propagation enters a stable period for which an example is also depicted in Fig. 2. Summarizer pages often appear in the stable period. Thereafter, if some progress or change is made on this topic, then a second or third explosion of activity occurs. In such a manner, the temporal character- istics of such topics can be represented by the increase of the number of nodes related to a topic. Our inflection point method reflects changes of the increase to labels. Therefore, the method can capture such temporal characteristics well.
5.2 Mined Time Graph Patterns
If the minimum frequencyminSupof mined patterns in Def- inition 1 is too large, then each mined maximal pattern be- comes extremely small. That is, the nodes in each pattern become extremely few. Small patterns are usually found not only on the sample graphs but also almost all web graphs.
Therefore, they are not useful for finding interesting char- acteristics. In contrast, ifminSupis too small, then mined patterns can depend too much on the sample graphs. Con- sequently, the patterns would not be sufficiently versatile to extensively discussed topics other than the sample topics. In addition, ifminSupis too small, then the number of patterns would be too large to compute them in practical time. We conducted preliminary experiments to mine patterns by set- tingminSupto various values. It was difficult to discover versatile patterns whenminSupwas 5 or greater, although we were unable to obtain results in a particular time when minSupwas 3 or fewer. We also tried varying the number of sample graphs used for mining. It was impossible to obtain results in a particular time if the number was greater than seven. Therefore, we setminSupto 4 for both gSpan and GraphSig.
We obtain 107 patterns using gSpan, and 55 patterns using GraphSig settingp-valueto 0.1, from the time label graphs labeled by the inflection point method. The respec- tive computation times of gSpan and GraphSig are shorter than ten minutes on our Windows Vista PC with Intel Core i7 920 and 4GB memory, which proves that our labeling method enables existing graph mining algorithms to obtain time graph patterns in practical time.
5.3 Network Analysis Using the Patterns
We attempt to classify automatically blog sites dealing with extensively discussed topics into the three types introduced into Sect. 5.1: primary sources, triggers, and summarizers.
A single site can include two or three types of pages. There- fore, we regard a site as a primary source if the site contains more primary source pages than the pages of each of the other two types. Similarly, we can determine whether a site is a trigger or a summarizer.
The automatic classification process comprises the fol- lowing three steps.
1. Converting each site into a feature vector; our dataset consists of these feature vectors.
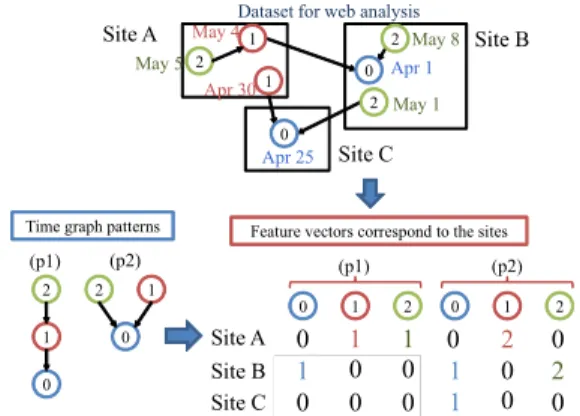
Fig. 4 Feature vector space of web sites using time graph patterns and their labels.
2. Partitioning the dataset half-and-half randomly: a training dataset and a test dataset.
3. Generating a classifier by learning the training dataset using SVM. This learning process involves five-fold cross-validation, which is conducting an analysis of one subset of the training dataset and validating the analysis of the other subset.
4. Predicting the test dataset using the classifier.
Our dataset comprises 164 total sites. We manually classified the sites into 44 primary source sites, 55 trigger sites, and 62 summarizer sites. We determined the class of a page in a blog site by a majority decision of three voluntary students who majors in informatics. If the class answered by each of the three was different from the other two, such a case occupies only less than 4% of all, then one of the author made the final decision. The Fleiss’s Kappa of the classification of the three students is 0.635.
The first step of the automatic classification process is conversion of each site into a feature vector. For this pur- pose, we extend a technique using cascades introduced by McGlohon et al. [15]. Their technique matches a subgraph to a cascade employing structural information only. How- ever, we must match a subgraph of a site to a time graph pattern. Therefore, our technique becomes more compli- cated than theirs.
Each graph in the graph set used in the mining process corresponds to a distinct topic. The labels of a graph re- flect temporal information that is characteristic to the topic.
Therefore, an integer label has a distinct meaning on graph G1 from that on graphG2. That is, our labelings might as- sign the same label to nodes v1 ∈ G1 andv2 ∈ G2 even if they were created in different periods. However, our dataset for analysis consists of sites including several topics. There- fore, we must determine which label matches a page in a site to convert the site into a feature vector.
We explain our matching technique using the exam- ple depicted in Fig. 4. A web graph includes six pages a,b,c,d,e,f, gof three web sites 1, 2 and 3, and two mined time graph patternsp1andp2. We first find subgraphs with structures matching those of respective patterns. Here we refer neither to labels of patterns nor to the creation time of
Table 1 SVM on primary sources (A) and triggers (B).
precision recall (A) primary sources 68.2% 62.5%
(B) triggers 83.3% 74.1%
Table 2 SVM on primary sources (A) and summarizers (C).
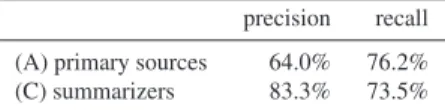
precision recall (A) primary sources 64.0% 76.2%
(C) summarizers 83.3% 73.5%
nodes in the web graph. We specifically examine the link structures of them only. For example, we can find two sub- graphs matching the structure ofp2, say{a,d,e}and{c,f, g}.
We then check whether the creation time of nodes of each subgraph is consistent with the labels of the pattern. Label1 corresponds to an older period than that corresponding to la- bel2if1 < 2. For example, the order of the creation time of{a,d,e}is (e,a,d), which is consistent with labels ofp2by assuming thatecorresponds to label 0,acorresponds label 1, anddcorresponds to label 2. Similarly, (g,c,f) is consis- tent with the labels ofp2by assuming thatgcorresponds to label 0,ccorresponds to label 1, and f corresponds to label 2. If two subgraphs share a node, then the label of the node in one of the subgraphs might be different from that in the other subgraph. Using such an assumption, which enables the nodes of a subgraph to be labeled, we can count the la- bels matching pages in each site. For subgraphs{a,d,e}and {c,f, g}for pattern p2, site 1 has two pages labeled as 1; site 2 has a page labeled as 0 and two pages labeled as 2; site 3 has only a page labeled as 0. We repeat this operation for each pattern.
We use the number of labels matching pages in each site to convert the site into a feature vector. LettingLbe the set of used integer labels{0,1, . . . ,|L| −1},Pbe the set of mined patterns, andN be the set of sites, then|N| feature vectors are obtained, each with|L| × |P|dimensions. Letting ei =(ei1,ei2, . . . ,ei|L||P|) be the feature vector of thei-th site, for 1 ≤ i ≤ |N|, then the pair of the j-th pattern and label , for 1 ≤ j ≤ |P|and 0≤ <|L|, corresponds to element ei(j−1)|L|+. The value ofei(j−1)|L|+is defined as the number of pages in siteimatching a node with labelin pattern j. If
|L| =3 in the example explained above, thene1(2−1)3+0 =e13 for the pair of j=2 and =0 is set to 0. Similarly,e14for j=2 and =1 is 2, ande15for j=2 and=2 is 0;e23for j=2 and =0 is 1,e24for j=2 and=1 is 0, ande25for j=2 and=3 is 1.
We calculate how accurately the classifier predicts the test data. A classifier judges which of two roles a vector the test data belong to. We obtain a classifier for each of the three possible pairs of two roles. We conduct prediction using each classifier. The precision and recall of the clas- sification are shown in the following three tables: 1, 2, and 3. Similarly, the precision and recall of the remaining two results are presented in Tables 2 and 3.
Table 3 SVM on triggers (B) and summarizers (C).
precision recall
(B) triggers 66.7% 76.9%
(C) summarizers 79.3% 69.7%
Table 4 Comparison of labeling methods: Precision of the classifica- tions.
method primary source trigger summarizer
inflection 66.1% 67.9% 81.3%
naive (A) 58.4% 67.8% 50.0%
naive (B) 61.9% 55.0% 58.4%
We compare the precision of the prediction using the inflection point method and the two naive methods. The results are presented in Table 4. The precision using the inflection point method is higher than that using the naive methods. Therefore, our idea using inflection points as la- beling boundaries is effective for estimating temporal infor- mation, as compared with the simple ideas used in the naive methods.
The results explained above confirmed that time graph pattern mining can reflect both temporal and structural char- acteristics of the three classes of blog sites. Therefore, our framework of the time graph pattern mining can be an effec- tive means for conducting network analysis.
6. Case Study (2)
We here study books about technical trends by applica- tion of our time graph pattern mining framework to book- recommendation networks on Amazon. We first mine time graph patterns on a set of book-recommendation net- works of books about technologies described in Sect. 6.1.
We then apply principal component analysis (PCA) to a book-recommendation network using the mined patterns in Sect. 6.1.1. Finally, we try to retrieve books of introduction to technologies employing the result of PCA in Sect. 6.2.
6.1 Graph Set, Observation, and Mined Patterns
We explain how we construct our dataset of book- recommendation networks. We first choose sample terms representing particular technologies of the following two groups: group (A) technologies have grown in popularity in April 2010; group (B) technologies which are growing at April 2010. The group (A) comprises eight technologies:
Ajax, Capability Maturity Model Integration, Data Min- ing, Information Technology Infrastructure Library, Ruby, Service-Oriented Architecture, Social Network Service, and Web2.0. The group (B) also comprises eight technologies:
Android, Business Intelligence, Business Process Manage- ment, Cloud computing, e-Book, International Financial Reporting Standards (IFRS), Twitter, and Smart grid. These groups are expected to be useful for analyzing types of the growth of technologies. We identify the group of a technol-
ogy according to some technology reports including Gart- ner’s hype cycles [21]. They specifically describe current technical trends and the future. We then construct a sample graph set for each group.
We assign a label to every node using the inflection point method. This method uses the number of queries on a search engine. Therefore, it reflects people’s interests and trendy words well. Applying the inflection point method to these time-series data including the publication dates of books, we obtain a time label graph for each term. We ob- serve that books published on around the peak time of a technology are usually labeled as 2 or 3; larger number la- bels are assigned to books published during later periods of the technology, whereas small number labels correspond to early periods. We apply GraphSig to the sets of the time la- bel graphs for the terms belonging to each group by setting minSupto 4 andp-valueto 0.5. Consequently, we obtain a set of time graph patterns from each group. Mined patterns from the set of group (A) include a number of nodes labeled with large numbers such as 3, 4, or larger. However, mined patterns from group (B) include a number of nodes labeled with small numbers such as 0, 1, or 2.
6.1.1 Network Analysis
We analyze a book-recommendation network for term “data mining” using the obtained time graph patterns. We first convert books into feature vectors in a way similar to but simpler than the one presented in Sect. 5.3. Then, we con- duct principal component analysis (PCA) of the matrix of which the rows are the feature vectors of books.
Let G be the time label graph of a book- recommendation network for analysis. LetPbe the set of all patterns mined from both groups in Sect. 6.1,Lbe the set of used integer labels{0,1, . . . ,|L|−1}forGandP, andVbe the set of books corresponding to the nodes ofG. Then,|V|
feature vectors are obtained, each with|L| × |P|dimensions.
Leteibe the feature vector of thei-th book, for 1≤i≤ |V|, andlabel(i) be the label of the book onG. The pair of the j-th pattern and label, for 1≤ j≤ |P|and 0≤ <|L|, cor- responds to elementei(j−1)|L|+. Iflabel(i), then the value ofei(j−1)|L|+is set to 0. Otherwise, the value ofei(j−1)|L|+ is set to the number of subgraphs that contain thei-th book and which match thej-th pattern.
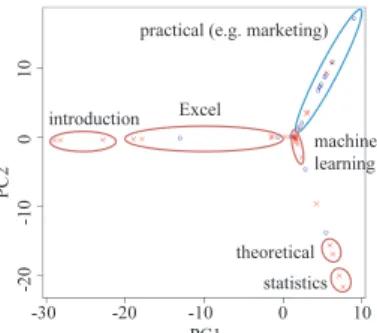
We apply PCA to the matrix with rows consisting of feature vectors obtained from the book-recommendation network for “data mining.” We plot the result of PCA on a scatter diagram using the first and second PCs in Fig. 5.
We classify almost all books into the following six classes representing the content: introduction, Excel (data mining using Excel), theoretical data mining, practical data mining (e.g. for marketing), statistics, and machine learning. These classes are also depicted in Fig. 5. They are apparently clus- tered to some degree. The books of introduction, Excel and machine learning have scores that are close to zero with re- spect to the second PC. However, the books of theoretical data mining and statistics have positive scores with respect
Fig. 5 A scatter diagram for the time inflection method according to the first and second PCs.
Fig. 6 A scatter diagram for naive method (B).
to the first PC, but negative scores with respect to the second PC. The practical books have positive scores with respect to both PCs.
The following scenario might explain why the six classes are clustered by PCA. In the early period, mainly books of statistics and theoretical data mining were pub- lished. In the middle period, the number of books related to introduction, Excel and machine learning increased. In the most recent period, practical books have been more pop- ular. Actually, a positive correlation is found between the score with respect to the second PC and the integer of the label. The result of PCA presented here provides evidence that the time graph pattern mining can be an interesting tool for network analysis, reflecting temporal information.
We also compare the result of PCA employing patterns obtained by the naive methods and GraphSig without any time label. Figure 6 depicts a scatter diagram for the naive method (B). This figure plots several books classified into
“Excel” and “Introduction” according to the first PC and the second PC. We observe that these two classes of books are mingled, not separated as the result depicted in Fig. 5 for the inflection point method. We here plot these two classes of books only, because the plot of all the six classes is far min- gled and hard to distinguish points. We note that the result for the naive method (A) is worse than the naive method (B).
Similarly, Fig. 7 depicts a scatter diagram obtained without any time label. The two classes of books are not separated as well as the naive methods. Consequently, we can apply only the result of PCA using the inflection point method to information retrieval explained below.
Fig. 7 A scatter diagram for GraphSig without any time label.
Fig. 8 Patterns having initial nodes corresponding to the introductive books. Every initial node is marked with the symbol of “∗.”
6.2 Information Retrieval Using the Patterns
We consider applying the result of the analysis above to retrieval of useful information from book-recommendation networks. As an example, we attempt to retrieve books of introduction to several technical trends. We first investigate time graph patterns having characteristics of books of in- troduction to “data mining.” We then enumerate every sub- graph matching one of the patterns on the time label graphs constructed for the technical trends in Sect. 6.1. Results show that books of introduction to a part of the trends are obtained with high precision.
We obtain two characteristics for use in retrieval. First, it is apparent that the books presenting an introduction to
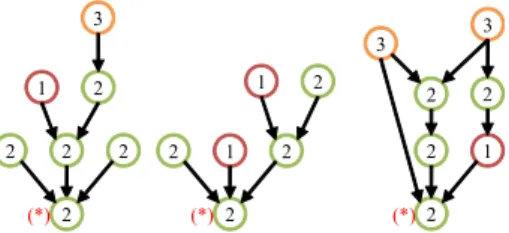
“data mining” have scores that are close to zero with re- spect to the second PC. In addition, all books having such scores have integer label 2 or 3. Second, Fig. 5 indicates that these books have large negative scores with respect to the first PC. Third, the books are “initial points” of some of the time graph pattern mined in this Section. Figure 8 presents the patterns.
We designate a node on a pattern is an initial node if the node has no outgoing edges but many incoming edges.
We mark the initial nodes with the symbol “∗” on the pat- terns in Fig. 8. The following scenario might explain why introductive books are initial nodes. A user who bought a difficult book about a technology would have bought a book of introduction to the technology with high probability.
Therefore, the introductory book can collect many incoming edges on a book-recommendation network. However, few users who bought the introductive book would buy a more difficult book. Consequently, the introductive book has no
outgoing edges on the pattern.
We consider that we can retrieve book of introduction to a technology from the book-recommendation network for the term corresponding to the technology using the follow- ing approach. We first enumerate every book with label 2 or 3, with feature vectors having a score of at most -10 with respect to the first PC. We then regard the book as an intro- ductory book if it is contained in a subgraph matched to a mined pattern and it is an initial node of the pattern. We ap- ply this approach to all technologies described in Sect. 6.1.
Results show seven books for three technologies. All seven books are actually introductive books for beginners: we in- troduce the books below.
1. Ajax
We find two books†: one is anintroduction to Ajaxfor Java programmers. The other, written in plain expres- sions, includes many illustrations.
2. Cloud Computing
We find only a single book††. Many reviewers on Ama- zon recommend this book for beginners because it is understandable.
3. IFRS(International Financial Reporting Standards) Four books†††are mined. Two books are actuallyintro- ductions to IFRS, one of which uses simple sentences and illustrations. Another is written for beginner ac- countants.
While we have retrieved several introductory books with high precision, many introductive books were not found using our approach. One reason why the approach has low recall might be strictness of the matching of patterns to subgraphs. A subgraph is not regarded as matching a spec- ified pattern even if the subgraph is quite similar but not equal to the pattern. The results of our retrieval indicate that the time graph pattern mining can reflect several temporal and structural characteristics of introductive books. There- fore, our framework of the time graph pattern mining can become a useful tool for information retrieval.
7. Conclusion
We proposed “time graph pattern mining,” a novel frame- work of graph mining that can estimate both temporal and structural information of a network. We proposed several
†“Java kaihatsusha no tame no Ajax jissen kaihatsu nyumon (an introduction to practical development using Ajax for Java de- velopers)”, “Zukai de wakaru Ajax no subete (Illustrated explana- tion for understanding all about Ajax)”
††“Kuraudo no shogeki – IT shijou saidai no souzouteki hakai ga hajimatta (The impact of the cloud – it begins the largest creative destruction in the history of IT)”
†††“Sugu wakaru, kuwashiku wakaru IFRS (quick and detailed understanding of IFRS)”, “Kanzen hikaku: kokusai kaikei kijun to nihon kijun (complete comparison: IFRS and Japanese standard)”,
“Zukai irasuto ni yoru IFRS kokusai kaikei kijun nyumon (An in- troduction to IFRS with illustrative explanation)”, “IFRS no keiri nyumon (an introduction to accounting of IFRS)”
ideas for applying our framework to practical cases: we pre- sented time-series data of three kinds. Then we established two naive methods and the inflection time point method for constructing time label graphs. Based on results of the two case studies, we confirmed that the time graph pattern min- ing can be a promising tool for network analysis and infor- mation retrieval.
References
[1] R. Kumar, P. Raghavan, S. Rajagopalan, and A. Tomkins, “Trawl- ing the Web for emerging cyber-communities,” Computer Networks, vol.31, pp.1481–1493, 1999.
[2] J. Leskovec, M. McGlohon, and C. Faloutsos, “Cascading behavior in large blog graphs,” Proc. of the 7th SDM, pp.551–556, 2007.
[3] J. Han and M. Kamber, Data Mining: Concepts and Techniques (Morgan Kaufmann Series in Data Management Systems), 2nd ed., Morgan Kaufmann Pub, 2006.
[4] X. Yan and J. Han, “gSpan: Graph-based substructure pattern min- ing,” Proc. of the 2nd ICDM, pp.721–724, 2002.
[5] S. Ranu and A.K. Singh, “Graphsig: A scalable approach to mining significant subgraphs in large graph databases,” Proc. of the 25th International Conference on Data Engineering, pp.844–855, 2009.
[6] T. Oshino, Y. Asano, and M. Yoshikawa, “Mining useful time graph patterns on extensively discussed topics on the Web,” Proc. of the 1st International Workshop on Graph Data Management (DASFAA workshop), pp.20–32, 2010.
[7] T. Oshino, Y. Asano, and M. Yoshikawa, “Time graph pattern min- ing for Web analysis and information retrieval,” Proc. of the 11th WAIM, pp.40–46, 2010.
[8] X. Yan and J. Han, “gSpan: Graph-based substructure pattern mining (expanded version),” Tech. Rep. UIUCDCS-R-2002-2296, UIUC Technical Report, 2002.
[9] W.S. Han, J. Lee, M.D. Pham, and J.X. Yu, “igraph: A framework for comparisons of disk-based graph indexing techniques,” Proc. of the VLDB Endowment, vol.3, no.1, pp.449–459, 2010.
[10] K. Makino and T. Uno, “New algorithms for enumerating all maxi- mal cliques,” Proc. of the 9th Scandinavian Workshop on Algorithm Theory, pp.260–272, 2004.
[11] T. Uno, “An efficient algorithm for solving pseudo clique enumerat- ing problem,” Algorithmica, vol.56, no.1, pp.3–16, 2008.
[12] Y. Asano, H. Imai, M. Toyoda, and M. Kitsuregawa, “Finding neigh- bor communities in the Web using inter-site graph,” IEICE Trans.
Inf. & Syst., vol.E87-D, no.9, pp.2163–2170, Sept. 2004.
[13] B. Wu and B.D. Davison, “Identifying link farm spam pages,” Proc.
of the 14th WWW, pp.820–829, 2005.
[14] Y. Chung, M. Toyoda, and M. Kitsuregawa, “A study of link farm distribution and evolution using a time series of web snapshots,”
Proc. of the 5th International Workshop on Adversarial Information Retrieval on the Web, pp.9–16, 2009.
[15] M. McGlohon, J. Leskovec, C. Faloutsos, M. Hurst, and N. Glance,
“Finding patterns in blog shapes and blog evolution,” Proc. of the 2007 International Conference on Weblogs and Social Media, 2007.
[16] S. Nakajima, J. Tatemura, Y. Hara, K. Tanaka, and S. Uemura,
“A method of blog thread analysis to discover important bloggers,”
Journal of Japan Society for Fuzzy Theory and Intelligent Informat- ics, vol.19, no.2, pp.156–166, 2007.
[17] J. Leskovec, J. Kleinberg, and C. Faloutsos, “Graphs over time:
Densification laws, shrinking diameters and possible explanations,”
Proc. of 11th KDD, pp.177–187, 2005.
[18] B.A. Huberman and L.A. Adamic, “Growth dynamics of the World- Wide Web,” Nature, vol.401, p.131, 1999.
[19] R. Kumar, J. Novak, P. Raghavan, and A. Tomkins, “On the bursty evolution of blogspace,” Proc. of the 12th WWW, pp.159–178, 2003.
[20] K.M. Borgwardt, H.P. Kriegel, and P. Wackersreuther, “Pattern min-
ing in frequent dynamic subgraphs,” Proc. of 6th ICDM, pp.818–
822, 2006.
[21] J. Fenn, “Hype cycle 2010: Tips to optimize your technology port- folio,” tech. rep., Gartner, Sept. 2010.
Yasuhito Asano received B.S., M.S. and D.S. in Information Science, the University of Tokyo in 1998, 2000, and 2003, respectively.
In 2003-2005, he was a research associate of Graduate School of Information Sciences, To- hoku University. In 2006-2007, he was an as- sistant professor of Department of Information Sciences, Tokyo Denki University. He joined Kyoto University in 2008, and he is currently an associate professor of Graduate School of Infor- matics. His research interests include web min- ing, network algorithms. He is a member of IEICE, IPSJ, DBSJ, OR Soc.
Japan.
Taihei Oshino received B.E. from Fac- ulty of Engineering, Kyoto University in 2009 and Master degree from the Graduate School of Informatics, Kyoto University, in 2011. He joined Accenture Japan Ltd. as an IT consultant in 2011.
Masatoshi Yoshikawa received the B.E., M.E. and Ph.D. degrees in Information Science from Kyoto University in 1980, 1982 and 1985, respectively. From 1985 to 1993, he was with Kyoto Sangyo University. In 1993, he joined Nara Institute of Science and Technology as an Associate Professor of Graduate School of In- formation Science. From June 2002 to March 2006, he served as a professor at Nagoya Uni- versity. Currently, he is a Professor of Gradu- ate School of Informatics, Kyoto University. His current research interests include XML information retrieval, databases on the Web, and health/medical informatics. He is a member of ACM and IPSJ.