Runoff Characteristics of North and
South-Facing Slopes in the Caribou-Poker Creek
Research Watershed, Interior Alaska (Extended
Abstract)
著者
URANO Shin-ichi, OKADA K., YABE K., KAWAUCHI
K., TAKAHASHI N., NAKAI T., Yazaki T., Hirano
T., Ishikawa N., Hinzman L.
journal or
publication title
The science reports of the Tohoku University.
Fifth series, Tohoku geophysical journal
volume
36
number
4
page range
466-470
year
2003-05
Runoff
in
Characteristics
of North and South-Facing
Slopes
the Caribou-Poker
Creek Research Watershed,
Interior
Alaska (Extended Abstract)
SHIN-ICHI URAN01, K. OKADA', K. YABE2, K. KAWAUCHI3, N. TAKAHASHI3, T. NAKAIl, T. YAZAKIi, T. HIRANO',
N. ISHIKAWA4, and L. HINZMAN5
`Grad . School. of Agri., Hokkaido Univ. (Kita-9 Nishi-9, Kita-ku, Sapporo 060-8589, Japan) 'Sapporo School . of the Arts (Geijutsunomori-1, Minami-ku, Sapporo 005-0864)
'Muroran Insti . of Tech. (Nizumoto-cho 27-1, Muroran 050-8585, Japan)
Insti. of Low Temp. Sci., Hokkaido Univ. ( Kita-19 Nishi-8, Kita-ku, Sapporo 060-0819) 'Univ . of Alaska, Fairbanks (Fairbanks, AK 99775-5860, USA)
(Received January 7, 2003)
Introduction
In interior Alaska, the hydrological characteristics in small watersheds are very
complex because the permafrost distributions are different as a function of slope and
aspect. But the relationship between the permafrost distribution and the hydrological
characteristics, for example the water discharge from slopes with different permafrost
distributions, has not been studied. We measured river discharge at several points in the
Caribou-Poker Creeks Research Watershed (CPCRW) near Fairbanks in the summers of
1997 to 2001, and clarified the differences of runoff discharge between north and
south-facing slopes in small sub-watersheds. From these results, we considered the
relation-ship between the permafrost distribution and runoff characteristics in the slopes.
Research Watershed
The target watershed, the Caribou Creek watershed except C4 in CPCRW, has a
total area of about 30 km2, the relative height range of 550 m, and the main river length
of about 10 km. Monthly mean temperatures are — 24.4°C in January and 17.1°C in
August, and annual precipitation is about 285 mm, including 170 mm as snow (Haugen et
al., 1982). This area belongs to the discontinuous permafrost region. But the
perma-frost distributions are different between the north and south-facing slopes in small
watersheds. From our electrical survey it was estimated that on the north-facing
slopes, the permafrost was nearly continuous, but on the south-facing slopes, permafrost was only sporadic.
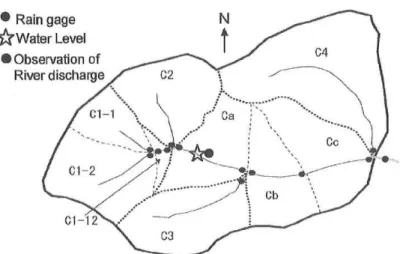
467 • Rain gage
*Water Level
• Observation of River dischargeFig. 1. Schematic of research
C4
...
....
.
Cc \
watershed and observation sites
• a) co .z CA 120 100 80 60 40 20 0 Fig. 2. 00Cr000 000000 6 .4: CkS C:si CQ 0 C \J
Trna(hou)
Discharge fluctuation in river on July 26, 2001 0
O
Methods
We subdivided the total watershed to smaller watersheds, and determined the ratio
(Rs) of the slope area facing to south to total area from a topographic map. The total research watershed and each small one are shown in Fig. 1.
Measurements of river runoff from each small watershed were carried out at the
confluence of the branch and the main channel (Fig. 1). Runoff discharges were calcu-lated from water velocities of several sections and the areas of the section in cross
section of river. Water velocity measurements were made using a photo type current
meter. Discharge measurements at the all points shown in Fig. 1 were executed for
about 7 hours from 1,000 to 1,700 in a day. These discharge measurements were made
once a day two times each summer from 1997 to 2001. Precipitation, water level of river
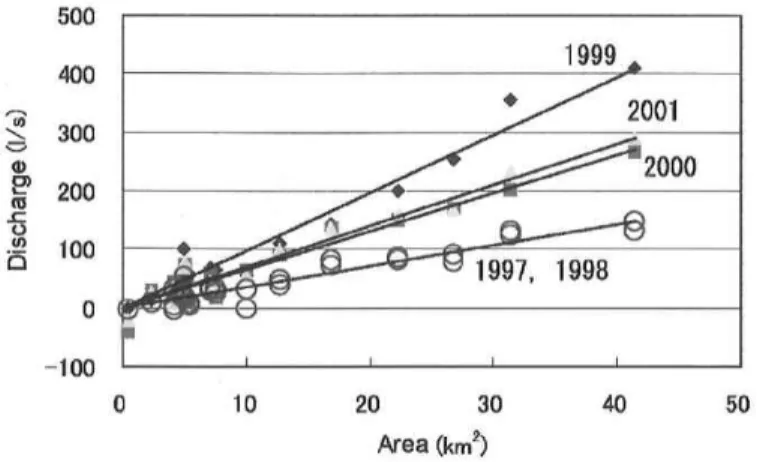
500 400 300 ti 200 0 100 0 -100 1999 • 2001 2000 1997, 1998 Fig. 3. 0 10 20 30 40 50 Area (km2)
Relationship between area and discharge in Caribou Creek Watershed
(=I 0 (J) 0 Fig. —4-- 1997 .8 —1111-1998 .6 —A-- 1999 .8 X 2000.8 - 2001 .7 caj C.4 Cv) -0 mr I 0 0 0 0 0 0 -0 0
Each Small Watershed
4. Specific discharges SD in each small watershed
Results and Discussion
In our observation, it required about 7 hours to measure. the discharge at all locations
from upstream to downstream, so it was necessary to check the fluctuation of river
discharge. Fig. 2 is the river discharge change at the observation point of water level in
a day on July 26, 2001. The maximum change of discharge during daytime was from
10% to 15%. But these errors were not too severe because the degree of error became smaller in the case of analyzing the small watersheds in which the measurement intervals were shorter.
Fig. 3 shows the relationship between the area and the discharge in each watershed.
The stream discharges in large watersheds were in proportion to the area, but these
relationships were different among years because of the difference in soil water
condi-tions, as influenced by antecedent precipitation. The relationships were not clear in
469 16 14 ,--, 12
"
.E 10
8 6 4 2 0 2001.7 9.97 Fig. 5. Rela slope Rs y = 7.4211x + 2.5442 2.54 ... 0 0.2 0.4 0.6 0.8The area ratio of south-facing slope (Rs)
1
Relationship between specific discharge SD and the area ratio of south-facing
1 0.9 0.8 o 0.7 0.6 ^ 0.5 cf) 0 .4 0.3 0.2 0.1 0 1999 2000 ^ 2001 1998
0
2
4
6
8
10
12
The average SD in Caribou Creek watershed(Uskm2)
Fig. 6. The ratios of discharges of north-to south-facing slopes in small watersheds
against the average SD in whole watershed in summers for 1997 to 2001.
shown in Fig. 4. The reason of this would be because the influences of geology,
vegeta-tion and permafrost in each watershed on hydrological characteristics appeared more
clearly in small watershed than in large one.
Fig. 5 shows the relationship between the specific discharge, SD, and the ratio of south-facing slope area to total area in small watershed, Rs, in the case of 2001. We can see in Fig. 5 that the SD is nearly in proportion to the Rs, and the SD values at Rs = 0 and Rs =1 were 2.54 (l/skm2) and 9.97 (l/skm2) respectively. That is, each of these values
means the discharge from north and south-facing slopes in the summer, 2001. In this
case the SD ratio of north and south-facing slope is about 0.25. There were similar
relationships such as Fig. 5 between SD and Rs in the other summers from 1997 to 2000. Fig. 6 shows the relationship between the SD ratios of north and south-facing slopes
of 1997 and 1998 were dry, and the summer of 1999 was quite wet. Fig. 6 indicates that the SD ratios were small in dry summers, 1997 and 1998, and during the more wet summer, the SD ratio was larger, in proportion to the average SD. The smallest value of the SD ratio was about 0.1 in 1997 and 1998. From these results, it was clear that the runoff characteristics were different on slopes facing north and south, the former was about 1/10 of the latter just during baseflow in summers, and therefore the direction of slopes influenced the stream discharge in small watersheds.
There were some differences in vegetation, geology, and permafrost distribution
among the slopes. But the factor that is most strongly influenced by the direction of slope and directly influences the runoff is the permafrost distribution of slope. So it was thought that the main reason for the difference of discharges such as Fig. 5 and Fig. 6 was the difference in the permafrost distribution among the slopes.
Conclusion
In this study, it was determined in all of the small watersheds included in Caribou Creek watershed that the runoff characteristics were different between north and
south-facing slopes. In the north-facing slopes, the specific discharge of baseflow for dry
summers was about 1/10 of the values on south-facing slopes. It was thought that the main reason for this difference in runoff was the difference in the permafrost distribution among the slopes.
References
Haugen, R.K., C.W. Slaughter, K.E. Howe and S.L. Dingman, 1982 : Hydrology and Climatology of the Caribou-Poker Creeks Research Watershed, Alaska. CRREL Retorts, 82(26).